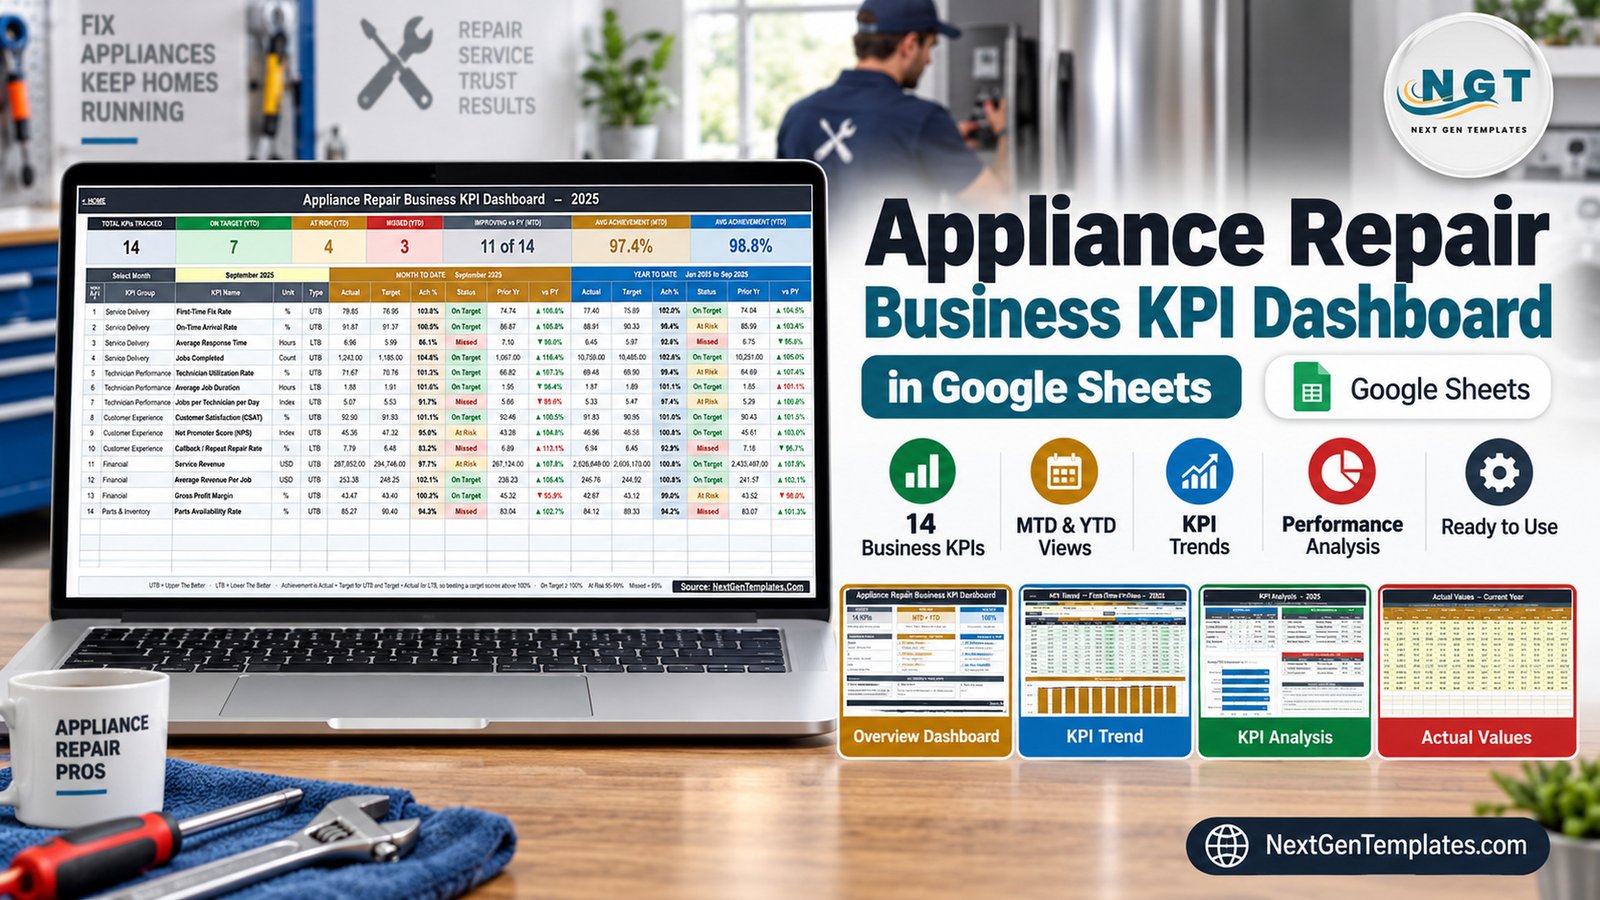
The Appliance Repair Business KPI Dashboard in Google Sheets puts 14 appliance repair business KPIs from 5 groups on one page, with Month-to-Date and Year-to-Date actual, target, achievement %, status and prior-year comparison for each. A single month dropdown drives the KPI Dashboard, KPI Trend and KPI Analysis pages, and the whole workbook runs on formulas — no add-ons, no macros, no scripts.
Most appliance repair owners already have job counts, technician hours, callbacks and survey scores somewhere, but rarely in one monthly view against a target and last year. This template gives you that view: type the numbers into three input sheets, pick a month, and read which KPIs are On Target, At Risk or Missed.
Get the Appliance Repair Business KPI Dashboard in Google Sheets
Key Features of the Appliance Repair Business KPI Dashboard in Google Sheets
- 📅 Month picker: select any month of 2025 in the sample file (it opens on September 2025) and every page recalculates.
- 📊 MTD and YTD side by side: Actual, Target, Ach %, Status, Prior Yr and vs PY for every KPI, with the YTD block covering January to the selected month.
- 🎯 UTB and LTB scoring: 11 KPIs are Upper The Better and 3 are Lower The Better (Average Response Time, Average Job Duration, Callback / Repeat Repair Rate). LTB achievement is Target ÷ Actual.
- 🚦 Status thresholds: On Target from 100%, At Risk 95–99%, Missed below 95%, editable in the Status formulas.
- 📈 KPI Trend: one KPI across twelve months with an MTD chart and a YTD chart.
- 🏆 KPI Analysis: group roll-ups plus the top five and bottom five KPIs by YTD achievement.
- 🧩 Master list: KPI Definition holds name, group, unit, formula, definition, type, owner, priority and frequency, with rows for up to 22 KPIs.
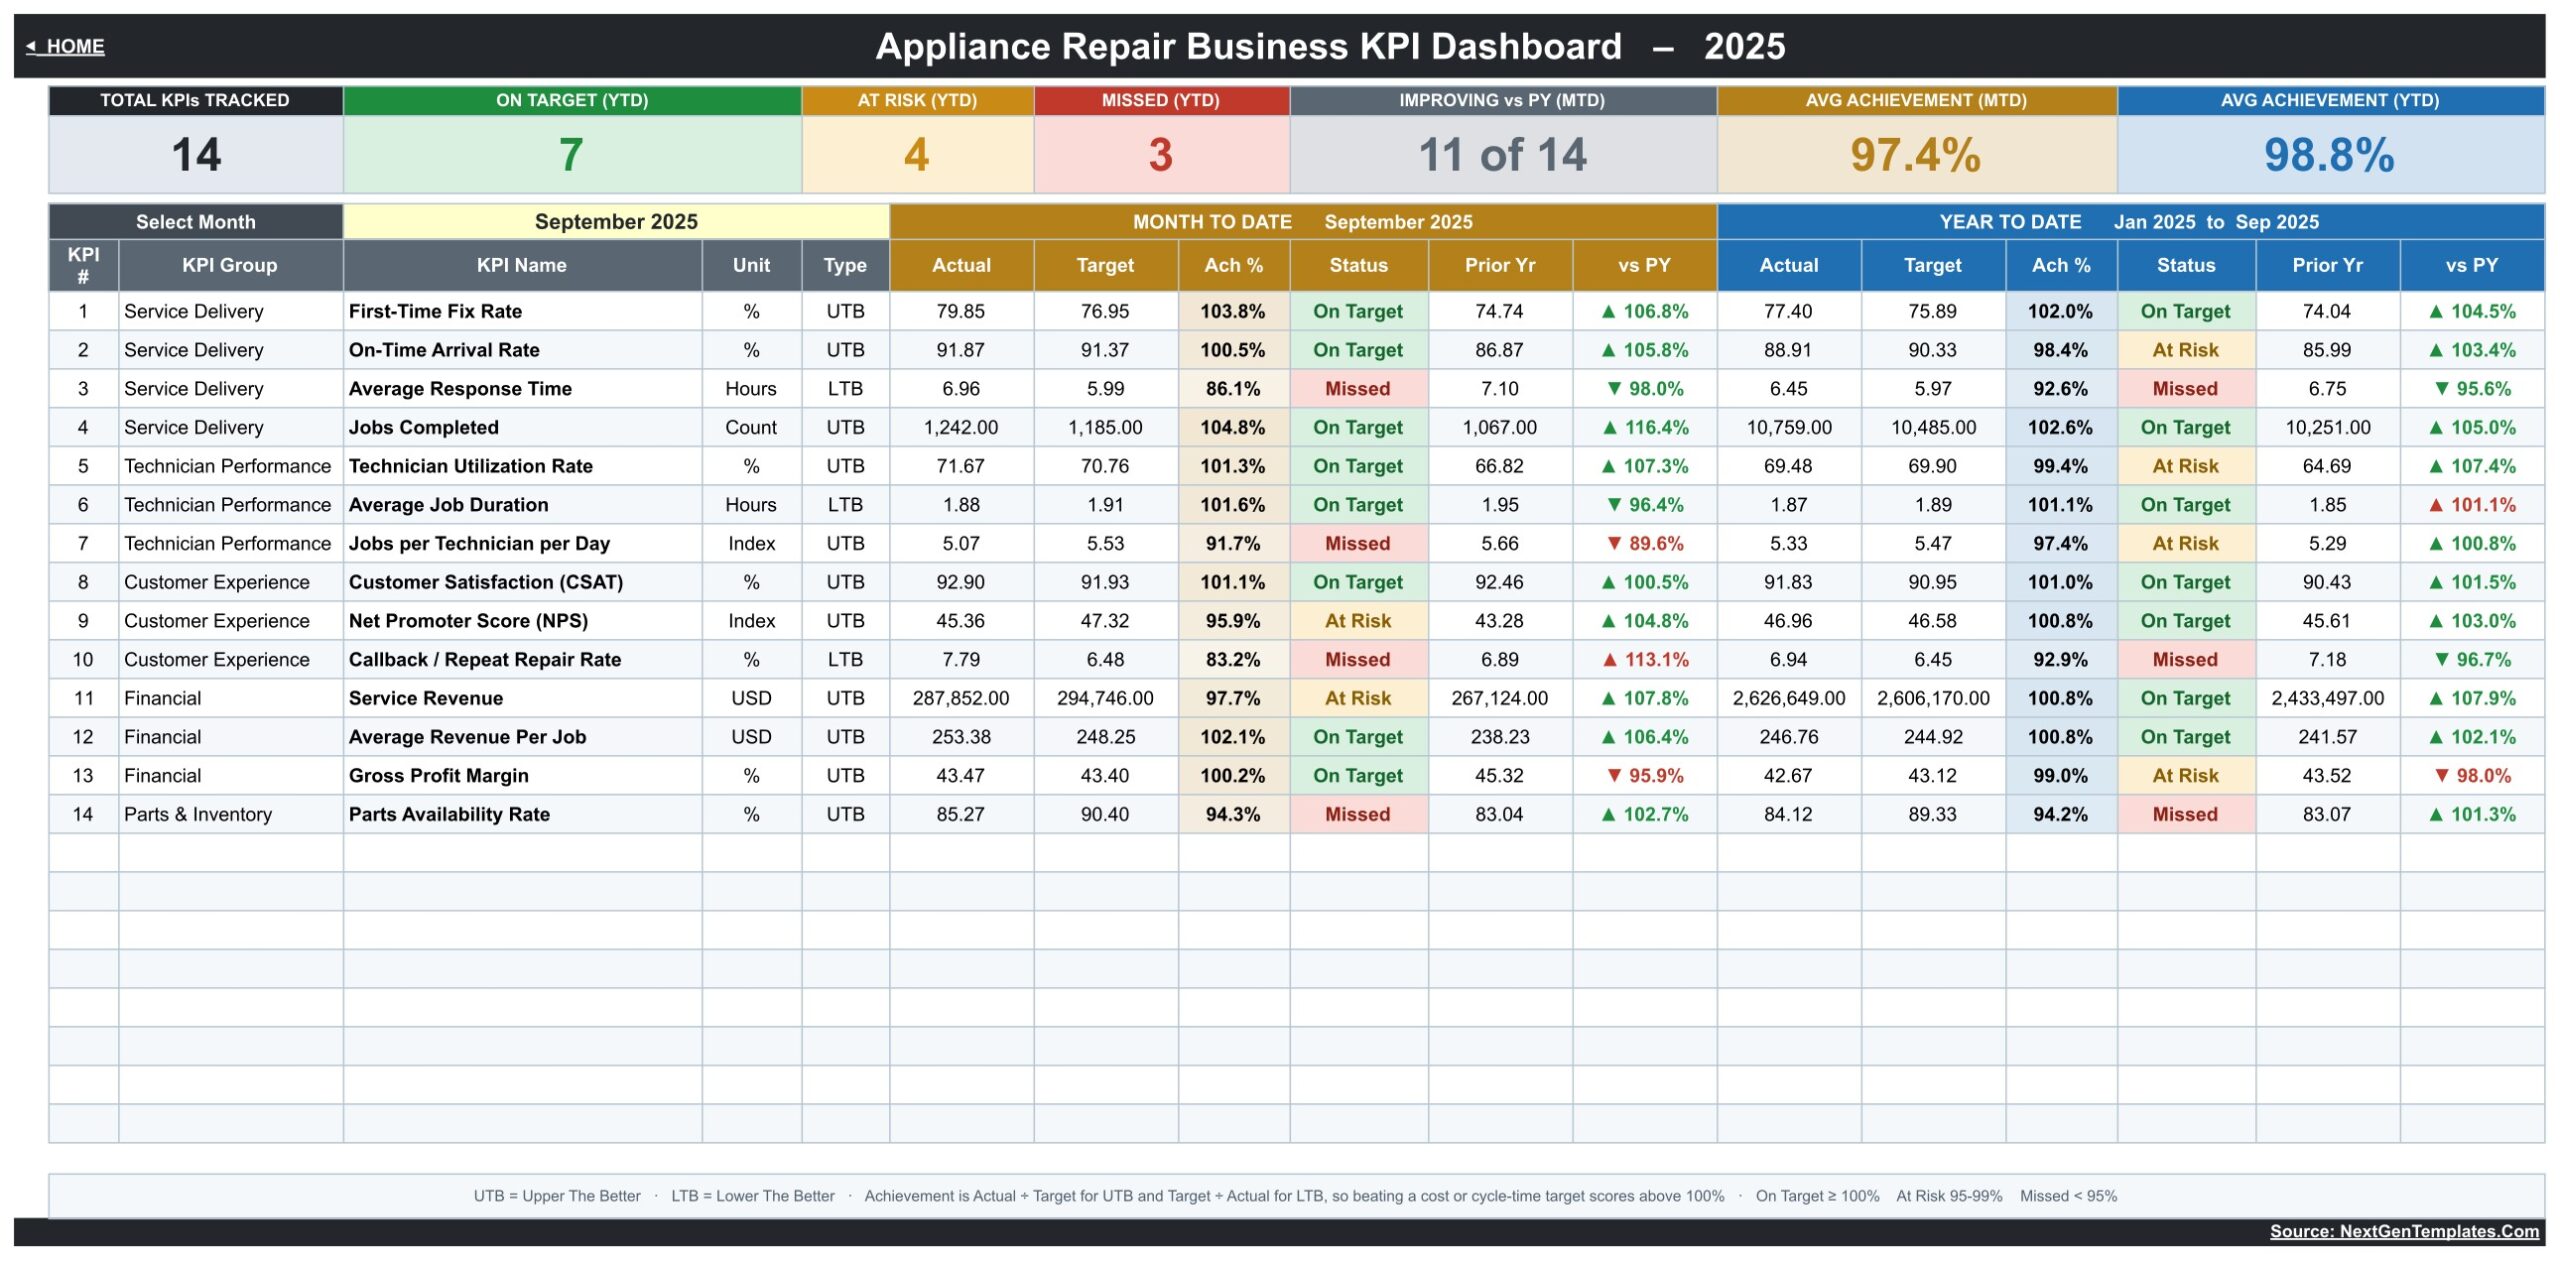
In the sample September view, the summary cards read 14 KPIs tracked, 7 On Target, 4 At Risk and 3 Missed on a YTD basis, 11 of 14 improving versus prior year MTD, and average achievement of 97.4% MTD and 98.8% YTD.
Dashboard Pages Explanation
Home
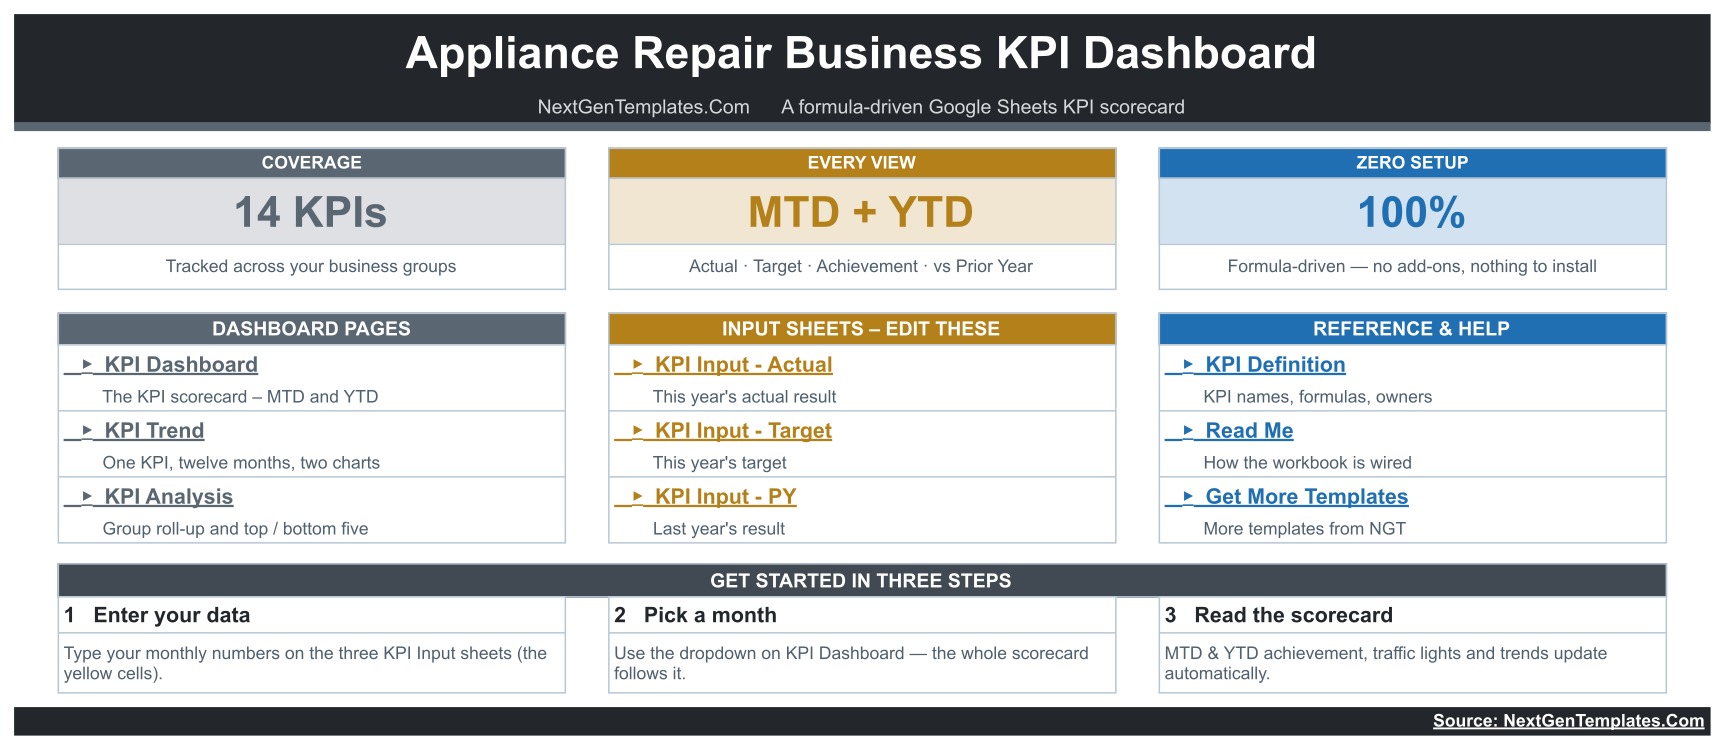
The start page summarises coverage (14 KPIs, MTD + YTD, formula-driven), links to the dashboard pages, the three input sheets and the reference tabs (KPI Definition, Read Me, Get More Templates), and lists the three setup steps: enter your data, pick a month, read the scorecard.
KPI Dashboard
Seven cards across the top — Total KPIs Tracked, On Target (YTD), At Risk (YTD), Missed (YTD), Improving vs PY (MTD), Avg Achievement (MTD) and Avg Achievement (YTD) — sit above the scorecard table. Each of the 14 rows shows KPI group, name, unit, type and the full MTD and YTD blocks with coloured status cells and ▲/▼ arrows against prior year. The arrows are colour-coded by direction, so a lower Average Job Duration than last year shows a green down arrow.
KPI Trend
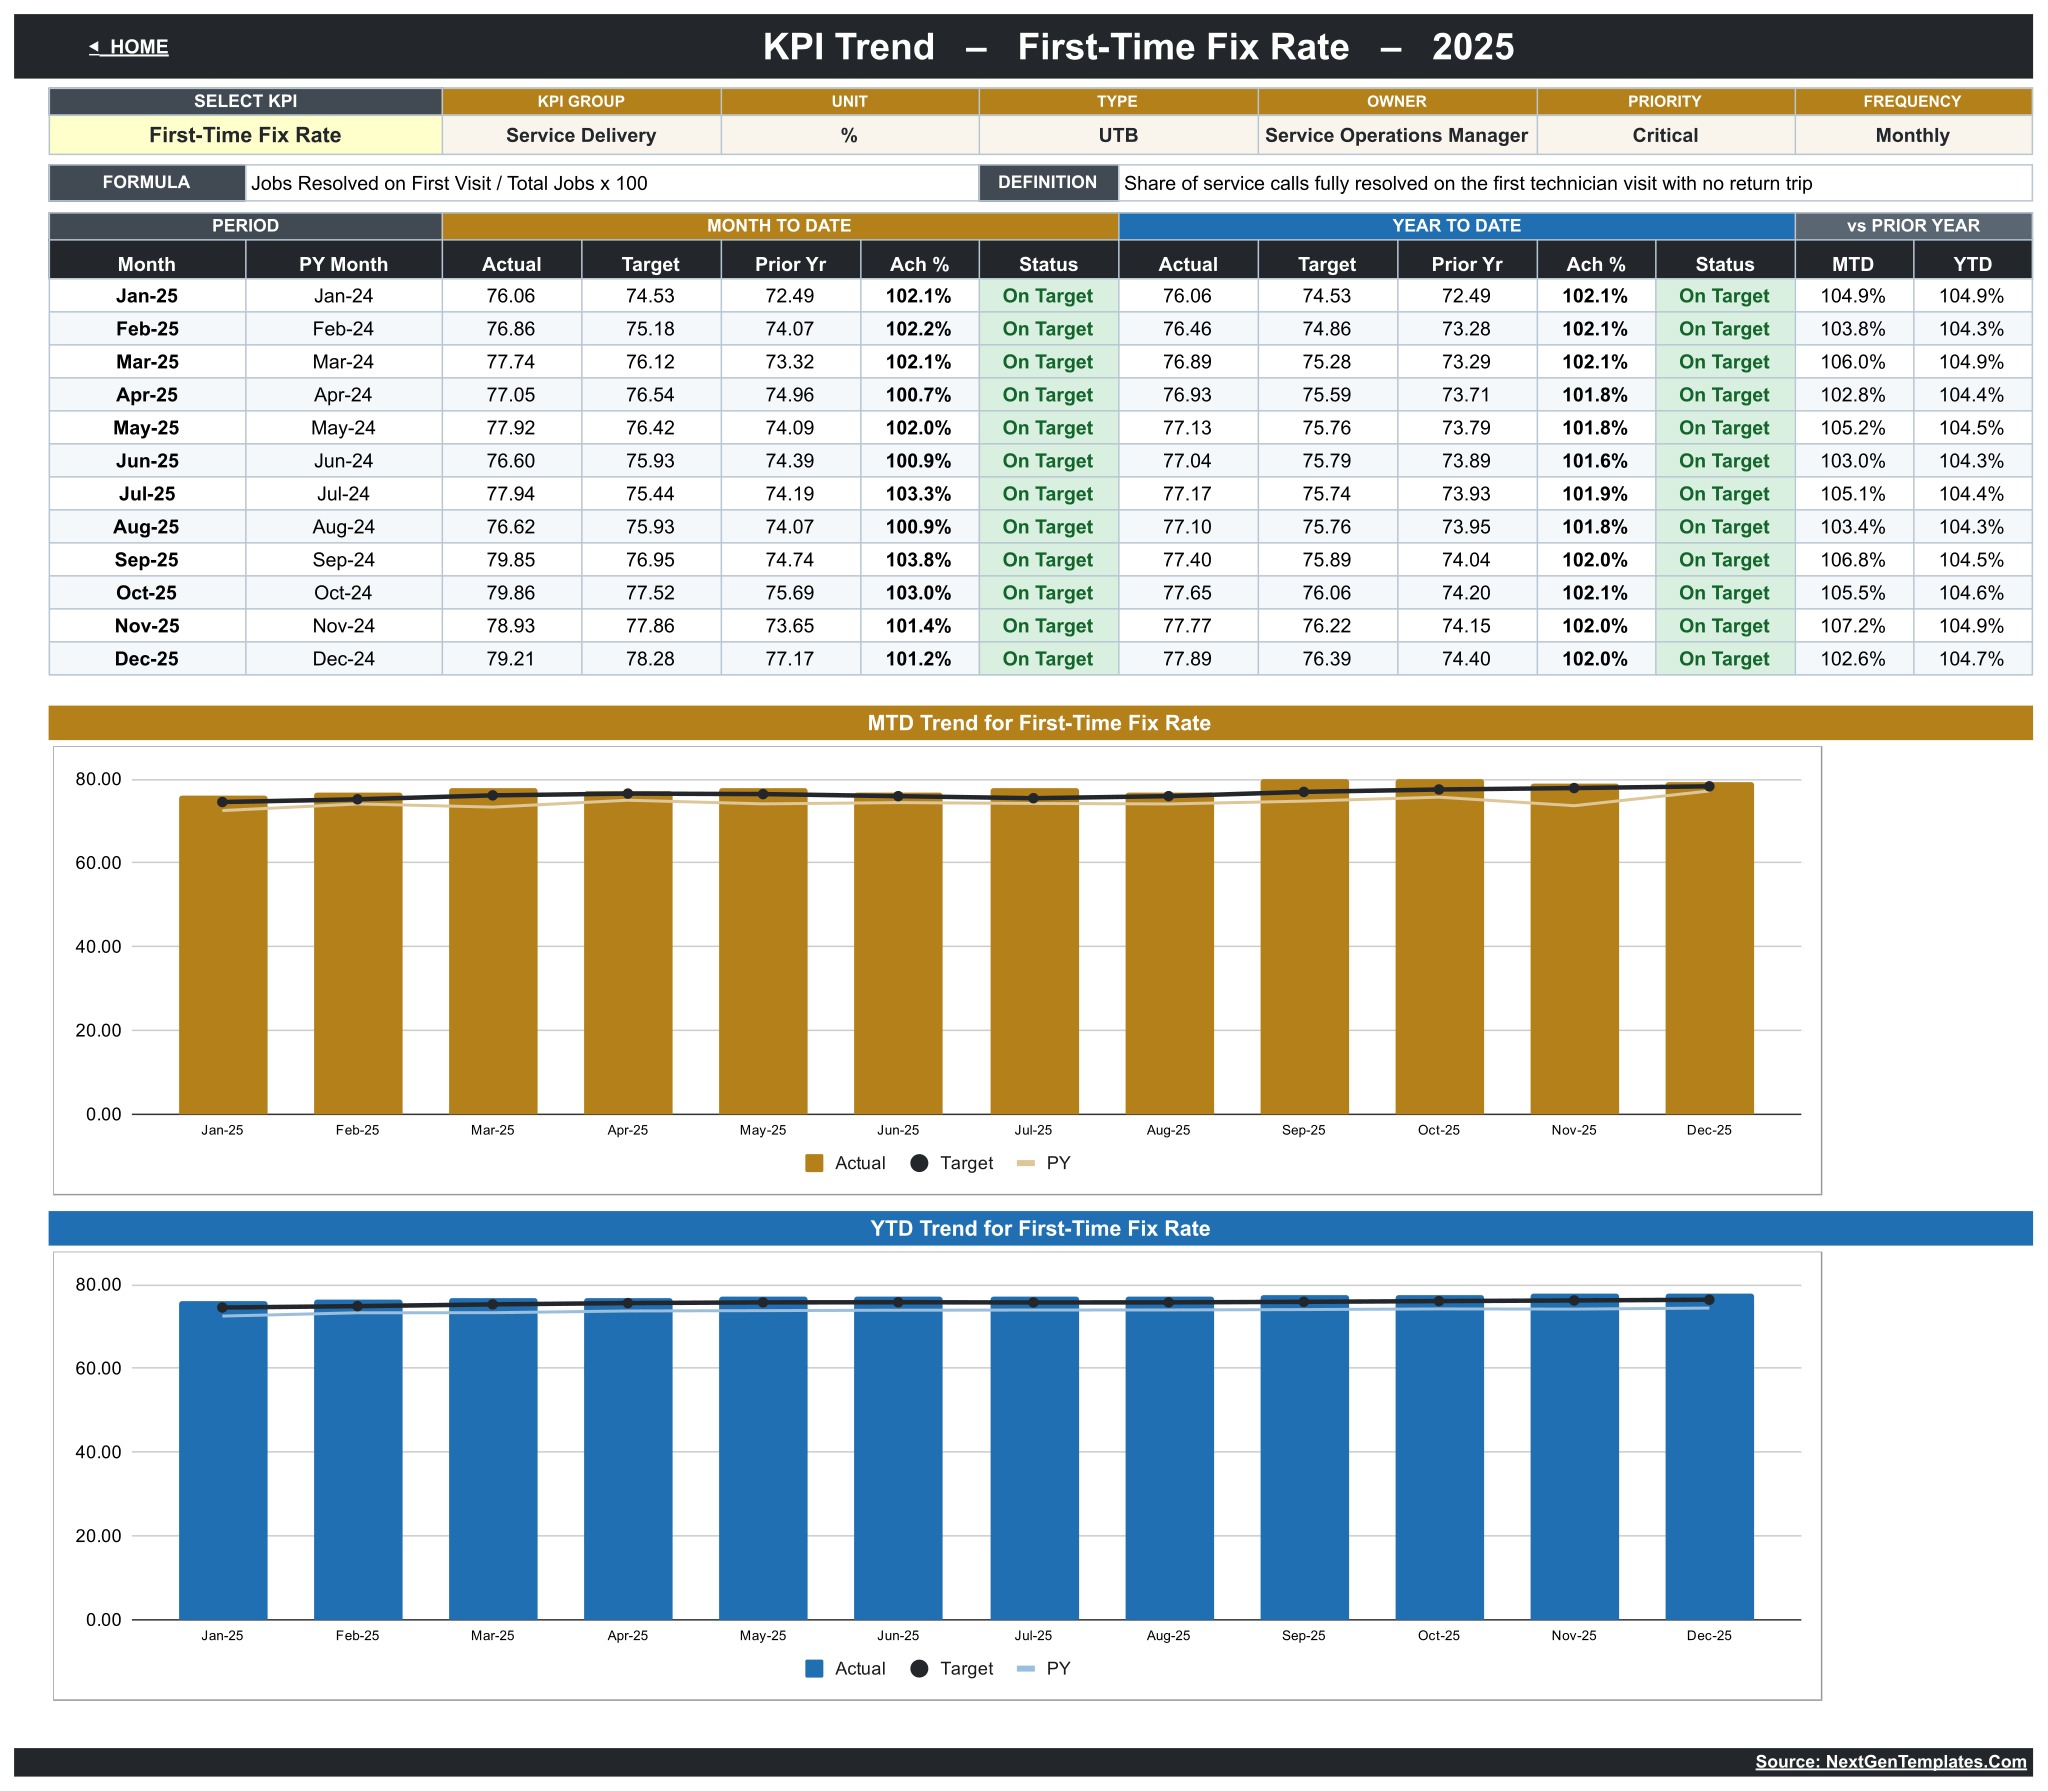
Choose a KPI (First-Time Fix Rate in the sample) to see its group, unit, type, owner, priority, frequency, formula and definition. A twelve-month table lists MTD and YTD actual, target, prior year, Ach % and status plus MTD and YTD vs PY. Two charts follow: MTD Actual, Target and PY by Month, and YTD Actual, Target and PY by Month.
KPI Analysis
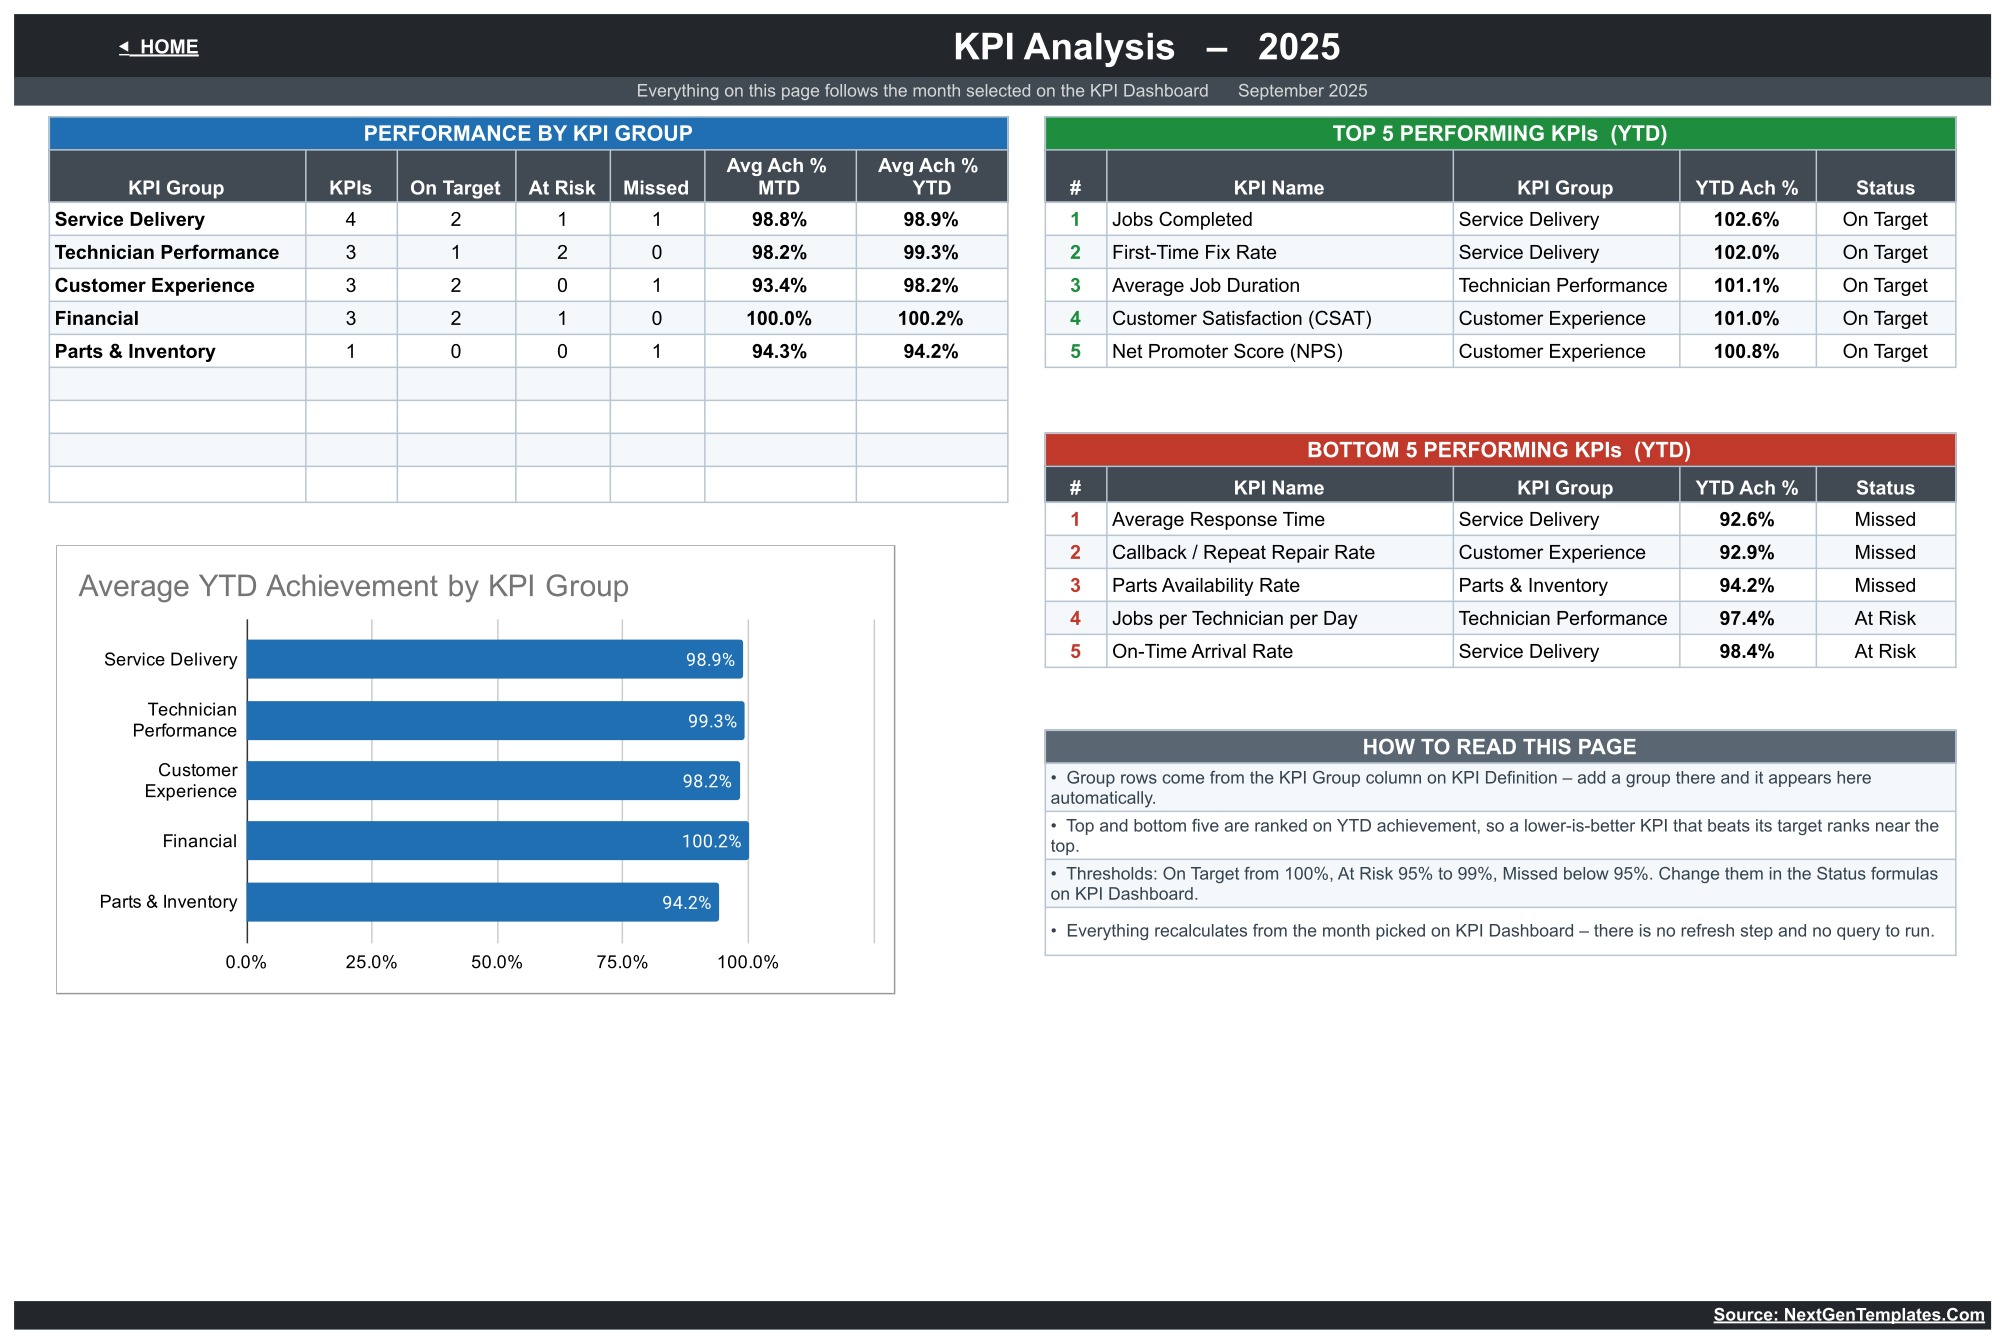
Performance by KPI Group counts KPIs, On Target, At Risk and Missed per group with average achievement MTD and YTD. The Average YTD Achievement by KPI Group chart ranges from 94.2% (Parts & Inventory) to 100.2% (Financial) in the sample. Top 5 and Bottom 5 tables rank KPIs by YTD achievement — Jobs Completed leads at 102.6%, Average Response Time trails at 92.6%.
KPI Input – Actual (and Target, PY)
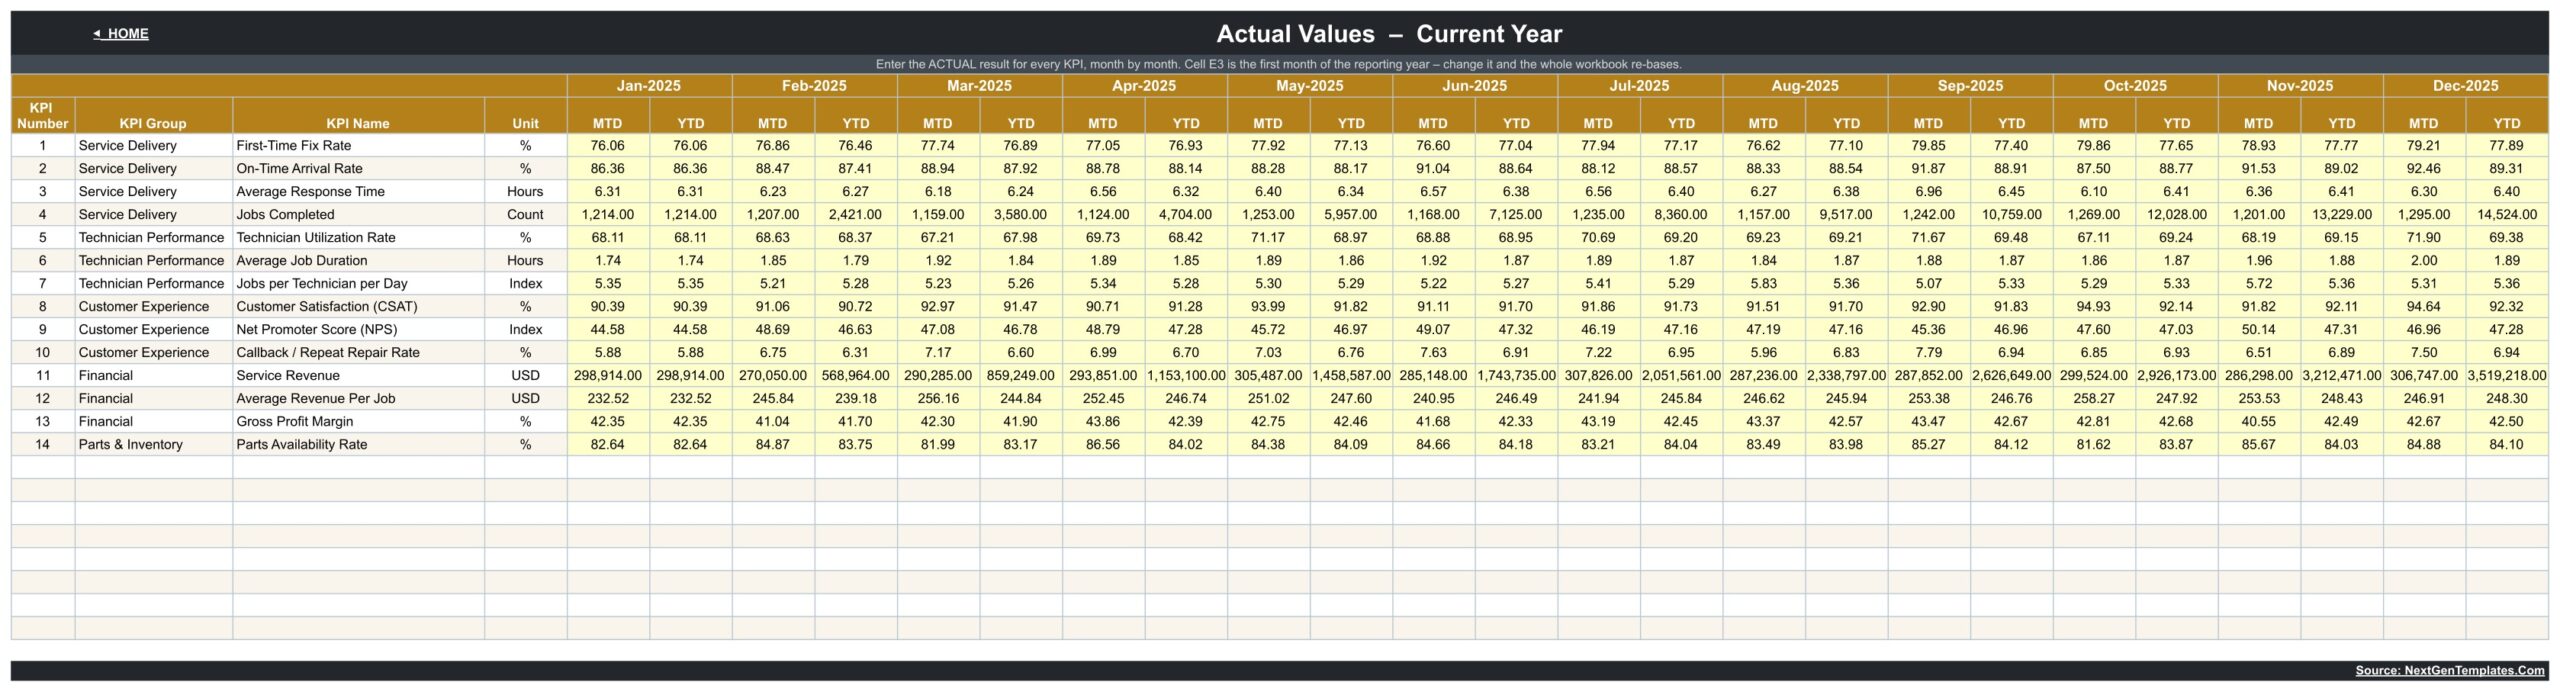
The yellow input grid has one row per KPI and an MTD and a YTD column for each month from January to December. KPI Input – Target and KPI Input – PY follow the same layout for targets and last year’s results. One cell sets the first month of the reporting year, and the workbook re-bases from it.
KPI Definition
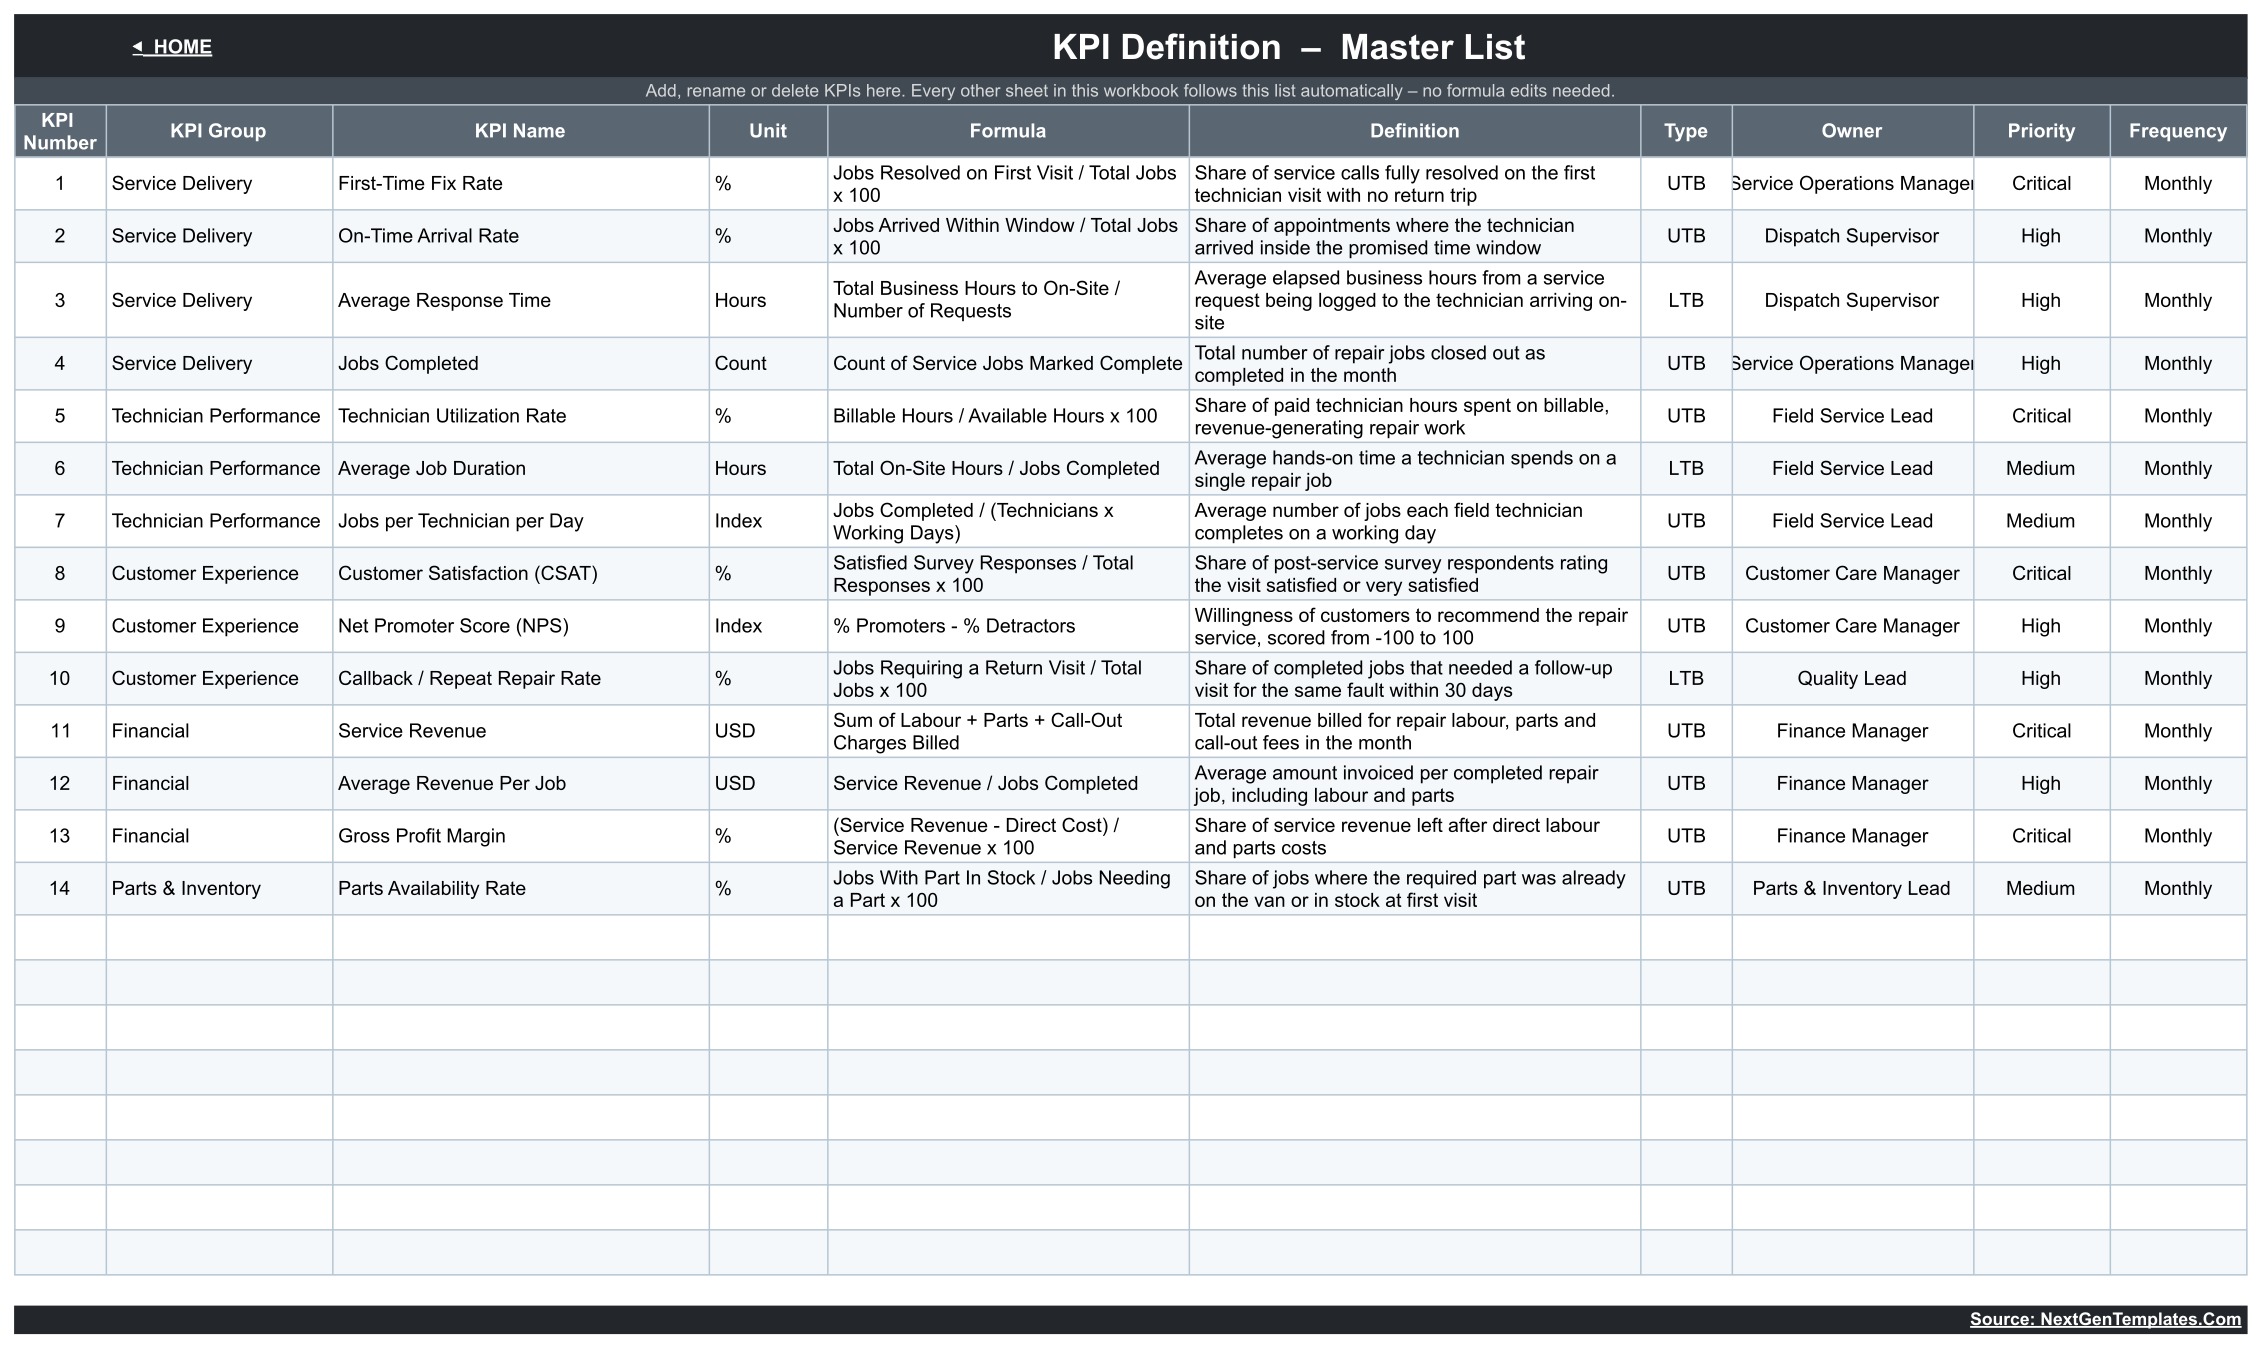
The master list covers First-Time Fix Rate, On-Time Arrival Rate, Average Response Time, Jobs Completed, Technician Utilization Rate, Average Job Duration, Jobs per Technician per Day, Customer Satisfaction (CSAT), Net Promoter Score (NPS), Callback / Repeat Repair Rate, Service Revenue, Average Revenue Per Job, Gross Profit Margin and Parts Availability Rate, each with a formula such as Billable Hours / Available Hours x 100 for technician utilization rate.
Appliance Repair KPI Dashboard vs. Excel Dashboard vs. Field-Service Software — Feature Comparison
| Feature | Appliance Repair Business KPI Dashboard in Google Sheets | Microsoft Excel KPI Dashboard | Field-service software (ServiceTitan / Housecall Pro type) |
|---|---|---|---|
| Cost | ✅ One-time purchase | One-time, plus an Excel licence | Monthly subscription |
| Platform | ✅ Browser + Google account | Excel desktop | Vendor apps |
| Setup time | ✅ Fill three input sheets | Similar | Technicians, customers and price book first |
| Real-time collaboration | ✅ Google Sheets sharing | OneDrive/SharePoint | ✅ Built in |
| Mobile access | Google Sheets app | Excel mobile | ✅ Technician apps |
| Customizable KPIs | ✅ KPI Definition list | ✅ Usually | Vendor reports |
| Share with a link | ✅ Yes | Needs Microsoft 365 | User seats |
| Dispatch, invoicing, parts ordering | ❌ No | ❌ No | ✅ Yes |
| MTD + YTD vs target and prior year | ✅ Every KPI | Depends | Varies by plan |
For owners who run jobs elsewhere but want a monthly management scorecard without another subscription, this template sits in the sweet spot.
Who Should Use This Template
Perfect for:
- Owners of residential and light-commercial appliance repair businesses
- Service and dispatch managers reviewing first-time fix rate, on-time arrival and response time
- Finance and parts leads tracking service revenue, gross profit margin and parts availability
Not a fit if:
- You need scheduling, technician dispatch, invoicing or parts ordering
- You need warranty-claim processing, manufacturer reporting or safety-compliance records — the template does not do this
Real-World Use Cases
Tom owns a five-technician appliance repair company. On the first Monday of each month he enters last month’s figures and checks the Service Delivery rows. When Callback / Repeat Repair Rate lands in Missed, he opens KPI Trend to see whether it is one bad month or a slide.
Priya runs dispatch for a regional repair service. She watches On-Time Arrival Rate and Average Response Time each month and uses the prior-year arrows to show whether scheduling changes actually helped.
Sam is the parts and finance lead. He reads the Financial and Parts & Inventory rows on KPI Analysis; in the sample, Parts Availability Rate sits in the Bottom 5 at 94.2% YTD, which points straight at van stock levels.
Advantages of the Appliance Repair Business KPI Dashboard
- 💰 One-time price with no per-user fee.
- ⏱️ Monthly review takes minutes once the numbers are in.
- 🔄 Direction-aware scoring means response time, job duration and callbacks are not mis-scored.
- 🤝 Share one live file with partners or managers through Google Sheets.
Opportunities for Improvement
- ✍️ Each month has its own MTD and YTD input column, so both must be kept in step when you enter data.
- ✂️ On KPI Definition the Owner column is slightly narrow, so “Service Operations Manager” is clipped at the edges; widen the column if it bothers you.
- 🔌 There is no connection to field-service or job-management software; figures are entered by hand.
- 📉 It is a monthly scorecard, not a daily job board — it will not show individual jobs or technicians.
Best Practices
- Set realistic monthly targets, allowing for seasonal peaks such as summer air-conditioner and refrigerator calls.
- Check each KPI’s UTB/LTB type on KPI Definition before entering data.
- Keep prior-year values complete so vs PY arrows are meaningful.
- Learn the basics of sharing and protected ranges in the Google Docs Editors Help Center.
Explore Relevant Templates
The Appliance Repair Business KPI Scorecard in Google Sheets is a different build: ten KPI cards with a month picker, MTD/YTD and Target/PY selectors and a mini bar chart per card, rather than a 14-row MTD/YTD table with trend and analysis pages. To run the jobs themselves, see the Appliance Repair Service Management System Web App or the Service Center and Repair Shop Management System Web App. For warranty and maintenance dates, try the Warranty Expiration Calendar in Google Sheets and the Maintenance Tasks Calendar in Google Sheets. Another home-services KPI dashboard in the same format is the Irrigation Installation KPI Dashboard. An Excel edition of the Appliance Repair Business KPI Dashboard is being prepared.
If you would like to learn the reporting side behind dashboards like this, the Excel Pivot Tables & Dashboards course on NextGenTemplates Academy works through it with practice files.
Get the Appliance Repair Business KPI Dashboard in Google Sheets
Frequently Asked Questions
What KPIs are in the Appliance Repair Business KPI Dashboard?
Fourteen: First-Time Fix Rate, On-Time Arrival Rate, Average Response Time, Jobs Completed, Technician Utilization Rate, Average Job Duration, Jobs per Technician per Day, CSAT, NPS, Callback / Repeat Repair Rate, Service Revenue, Average Revenue Per Job, Gross Profit Margin and Parts Availability Rate.
How long does setup take?
Copying the file takes a minute. Setup is then entering monthly Actual, Target and prior-year MTD and YTD values into the three yellow input sheets and choosing a month on the KPI Dashboard page.
Can I add my own KPIs?
Yes. KPI Definition has rows for up to 22 KPIs; add or rename one there and the other pages follow the list without formula edits.
How does this compare to ServiceTitan or Housecall Pro-style software?
Those tools schedule, dispatch and invoice on a subscription. This template is a one-time-purchase monthly KPI scorecard that compares results with targets and last year; it does not replace job management.
Does it need add-ons or Apps Script?
No. Everything is built with standard Google Sheets formulas, dropdowns and charts, so it runs in any browser with a Google account.
Is the sample data real?
No. The 2025 numbers are fictional sample data so you can see how every page behaves before entering your own.
About the Author
Built by PK — Microsoft Certified Professional with 15+ years of Excel, Google Sheets and Power BI experience and founder of NextGenTemplates. Every template is hand-built and tested before release.
Conclusion
If you want a clear monthly view of service delivery, technician performance, customer experience, finances and parts availability, the Appliance Repair Business KPI Dashboard in Google Sheets gives you 14 scored KPIs, trend charts and group analysis in one shared file.
✅ Instant download · One-time payment · No subscription
Last updated: September 2026