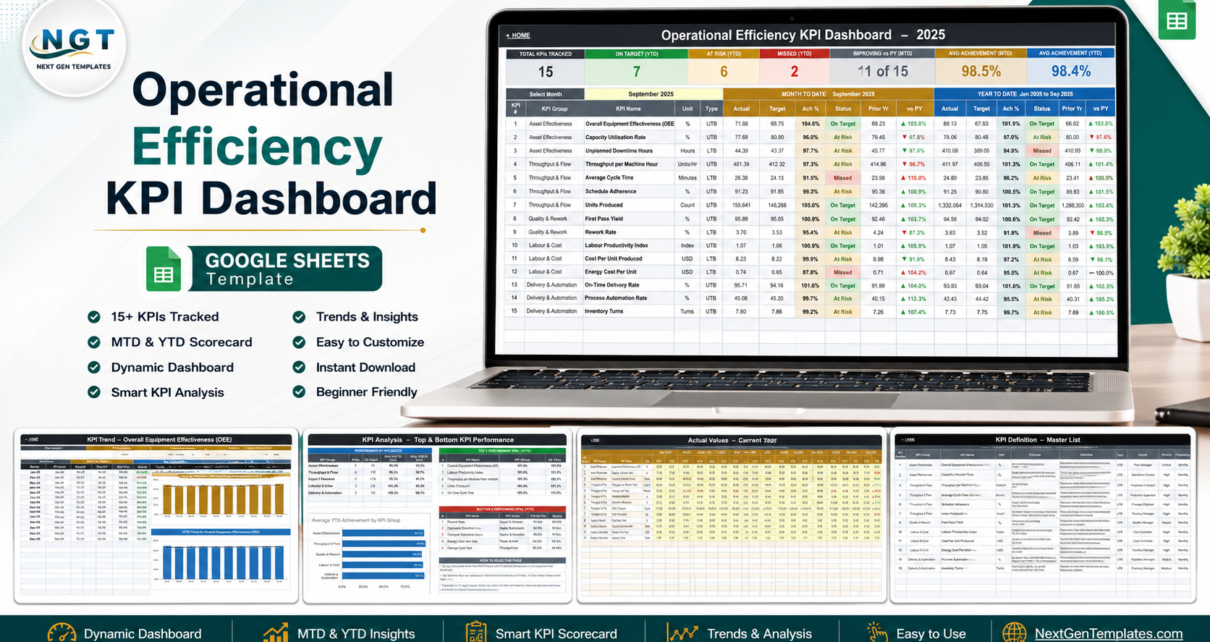
A formula-driven Google Sheets KPI scorecard that tracks 15 operational efficiency KPIs across 5 groups, with MTD and YTD side by side, traffic-light status, a 12-month KPI Trend page and a KPI Analysis page. No add-ons, no scripts, no refresh step.
Online Tutorial for Data Analysis and Automation
A formula-driven Google Sheets KPI scorecard that tracks 15 operational efficiency KPIs across 5 groups, with MTD and YTD side by side, traffic-light status, a 12-month KPI Trend page and a KPI Analysis page. No add-ons, no scripts, no refresh step.
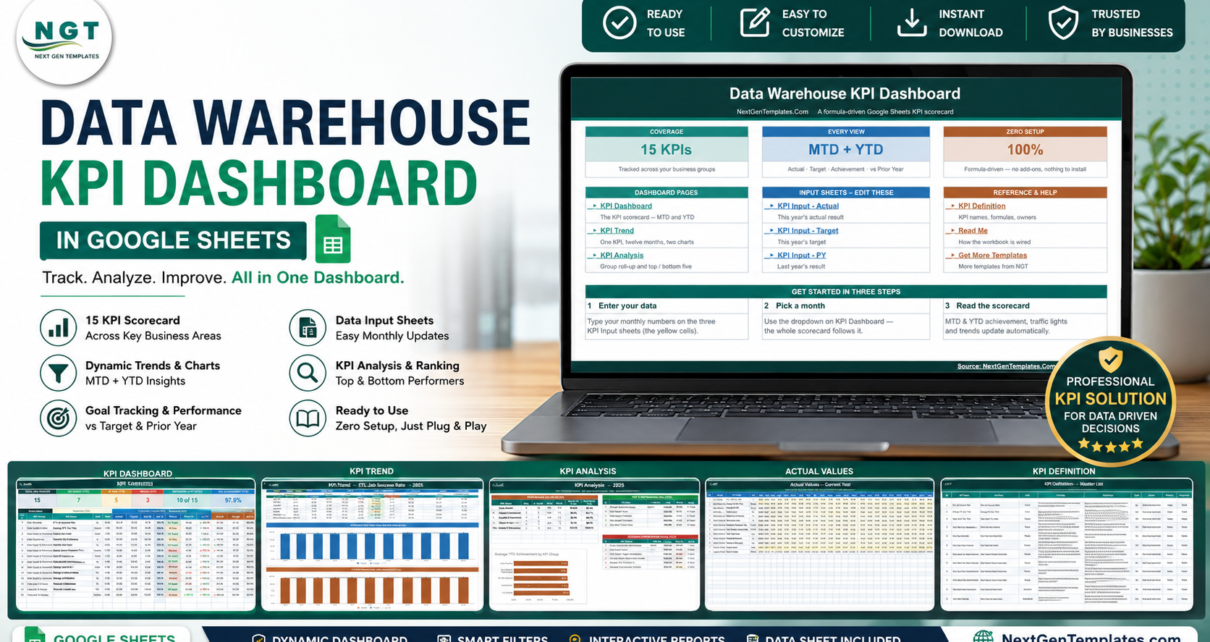
The Data Warehouse KPI Dashboard in Google Sheets is a formula-driven monthly scorecard for 15 data platform KPIs – ETL job success, pipeline SLA, warehouse uptime, data quality, lineage coverage and unit cost – with MTD and YTD achievement, traffic lights and prior-year comparison on every row.

A formula-driven Google Sheets KPI scorecard for 15 web analytics KPIs, with a month picker, MTD and YTD traffic lights, a per-KPI trend page and a group analysis page. Independent template – it does not connect to Google Analytics or GA4; you enter your own monthly numbers.
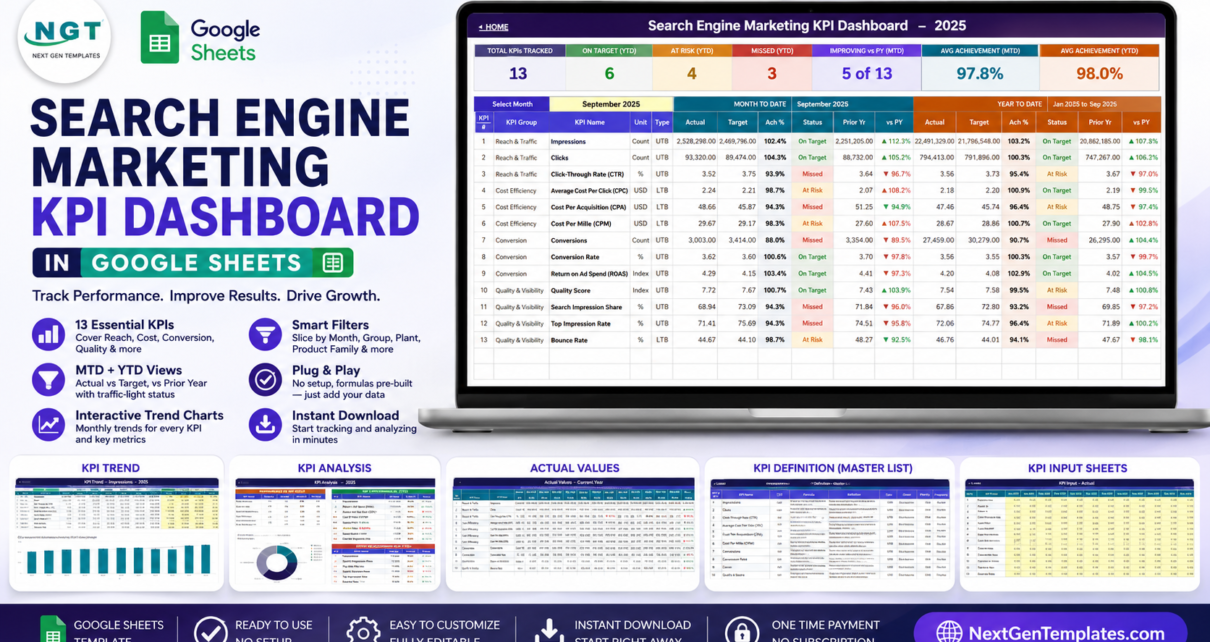
A month-by-month paid search scorecard built in Google Sheets: 13 KPIs across four groups, MTD and YTD achievement, traffic lights, a single-KPI trend page and a group roll-up. You enter your own numbers – it does not connect to any ad platform.
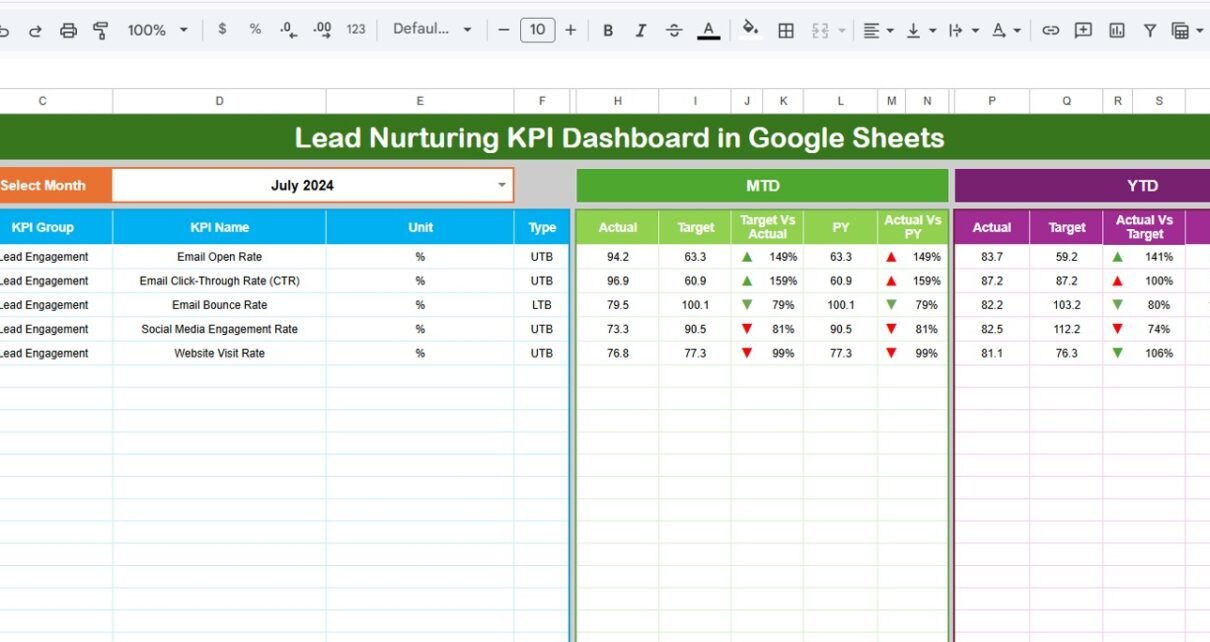
Track lead nurturing KPIs in Google Sheets with a 6-sheet dashboard for MTD/YTD actuals, targets, previous-year comparisons, KPI trends, and editable definitions.
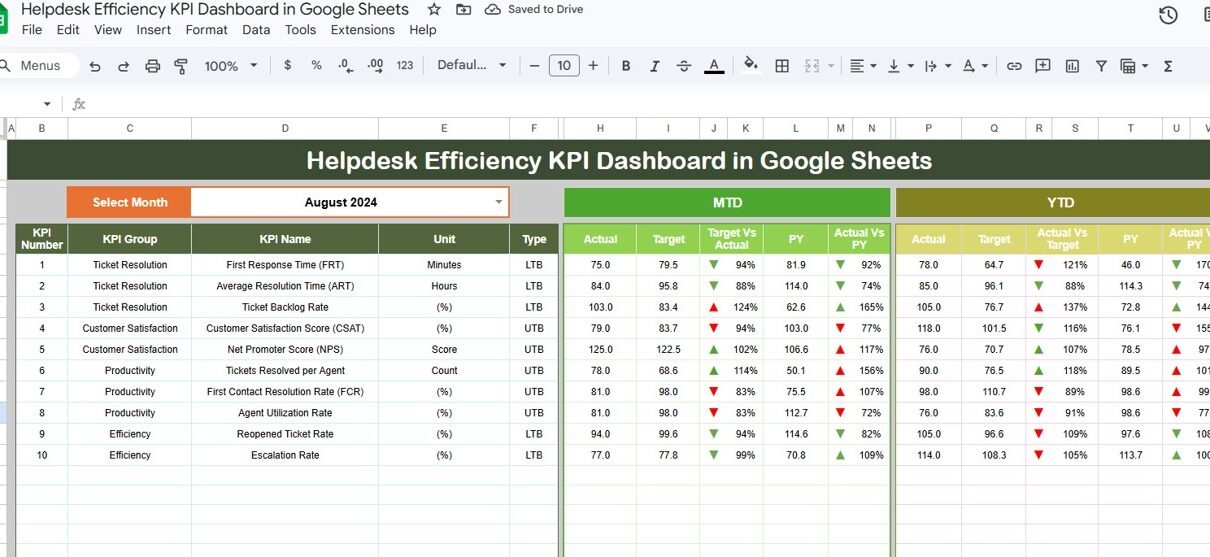
Track and optimize helpdesk performance with this ready-to-use KPI Dashboard in Google Sheets. Monitor MTD and YTD actuals vs targets with trend charts, conditional formatting, and a complete KPI definition library.
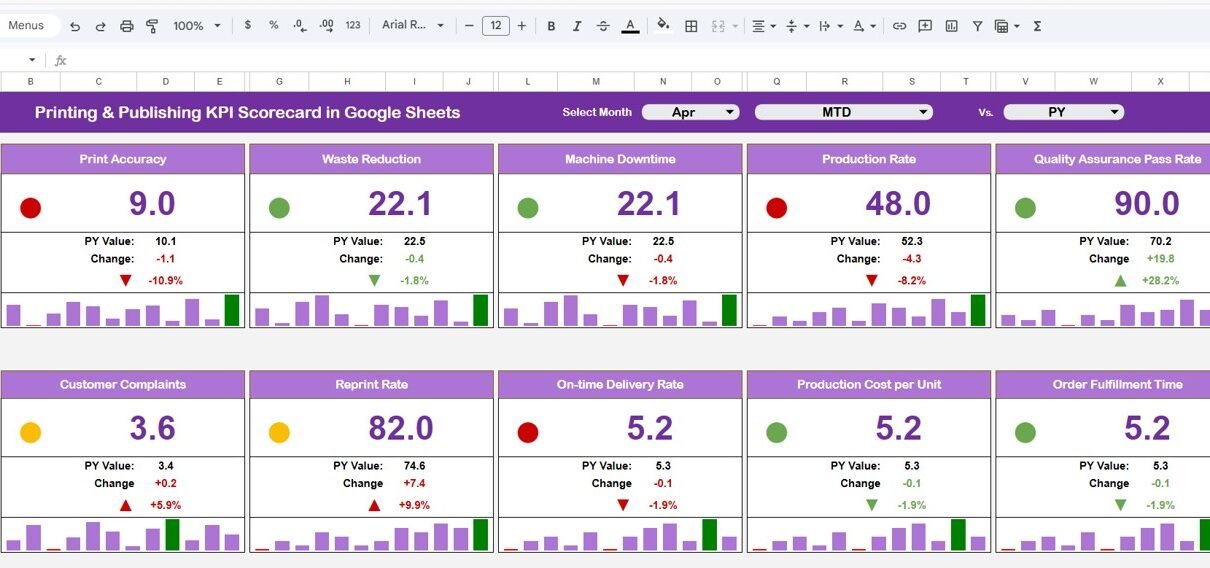
In today’s competitive printing and publishing industry, tracking performance is not optional—it is essential. Businesses must monitor production efficiency, costs, quality, and delivery timelines. However, when data stays scattered across multiple sheets, it becomes difficult to evaluate performance effectively.Printing & Publishing KPI Scorecard in Google Sheets So, how can you track KPIs, monitor trends, and […]
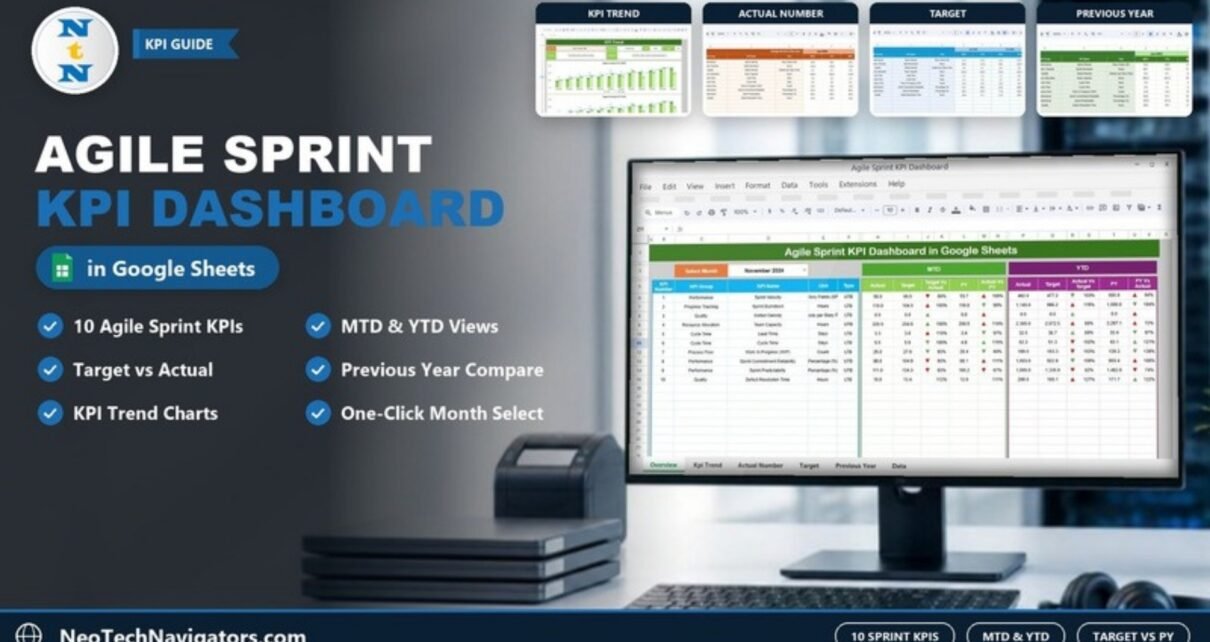
A sheet-by-sheet guide to the Agile Sprint KPI Dashboard in Google Sheets: ten sprint KPIs with formulas, MTD and YTD target and previous-year comparison, and steps to load your own data.
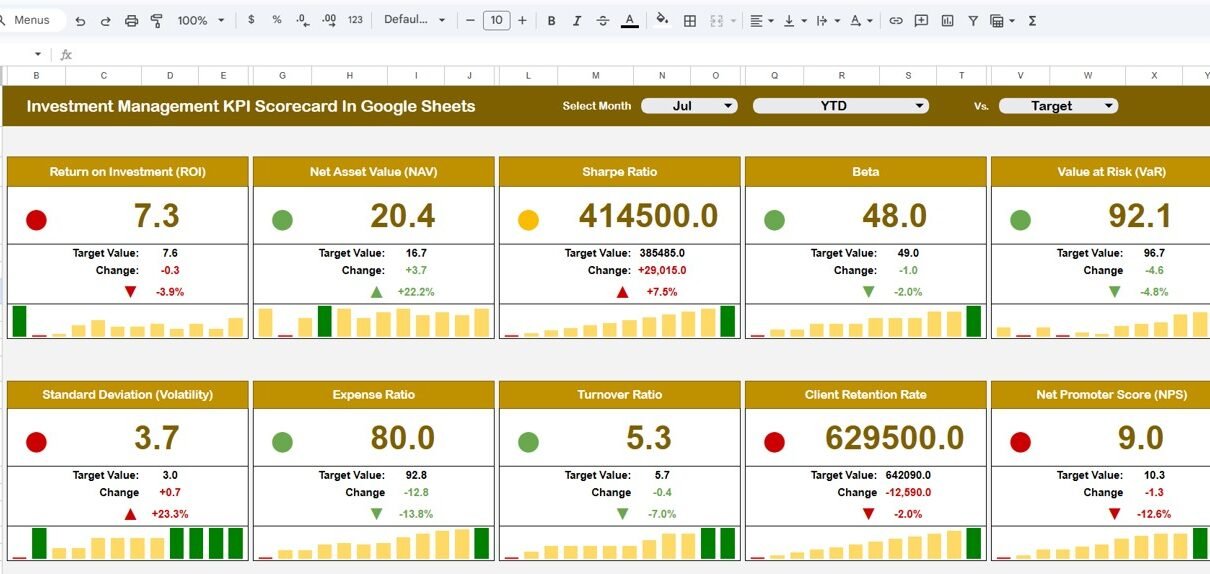
Investment management requires continuous monitoring, accurate performance measurement, and data-driven decision-making. Investment firms, portfolio managers, and financial analysts must evaluate multiple performance indicators regularly to ensure portfolios achieve expected returns while managing risks effectively. However, many organizations still rely on manual spreadsheets that make analysis slow and inconsistent. Therefore, professionals increasingly use automated KPI scorecards […]
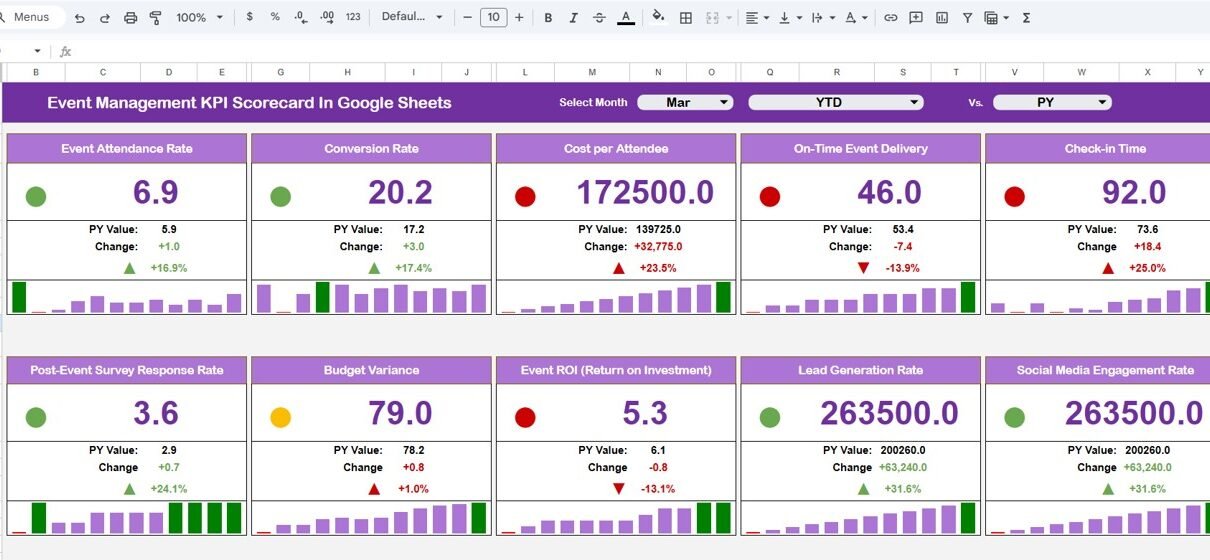
Event management has evolved significantly in recent years. Today, organizers must track performance, monitor budgets, evaluate attendee satisfaction, and measure event success using data-driven insights. However, many event teams still rely on manual spreadsheets and scattered reports. As a result, they struggle to evaluate performance accurately and make timely improvements. Therefore, organizations increasingly adopt structured […]