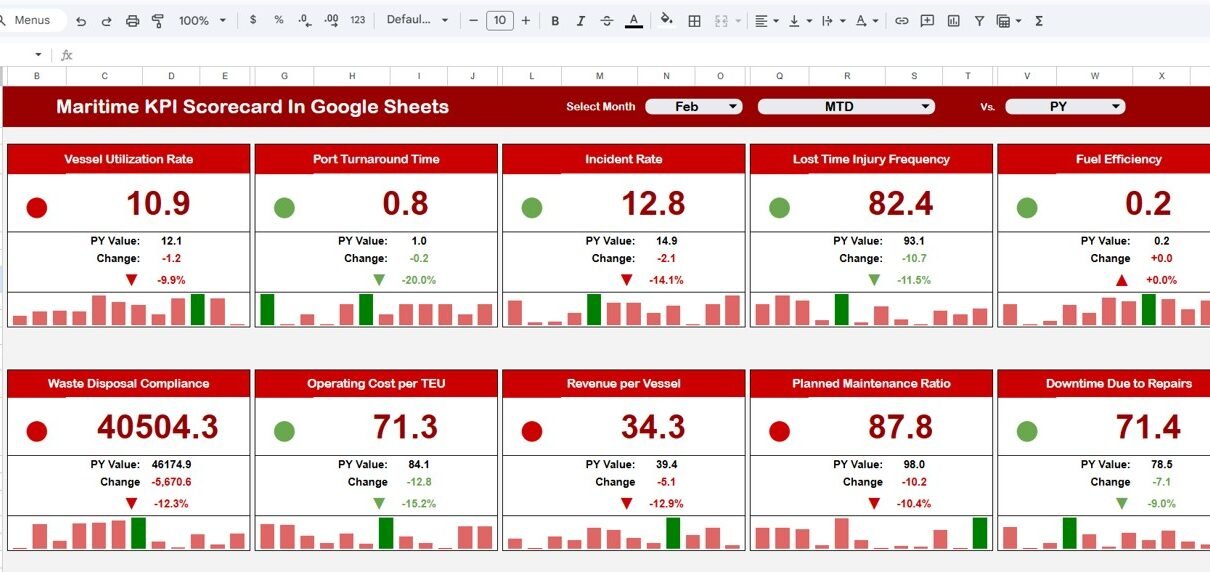
The maritime industry operates in a highly complex and performance-driven environment. Shipping companies, port authorities, logistics operators, and maritime service providers continuously manage vessel operations, fuel efficiency, turnaround time, safety compliance, and operational costs. However, many organizations still rely on manual reports and disconnected spreadsheets to monitor performance. As a result, decision-makers struggle to evaluate […]
Tag: Google Sheets KPI template
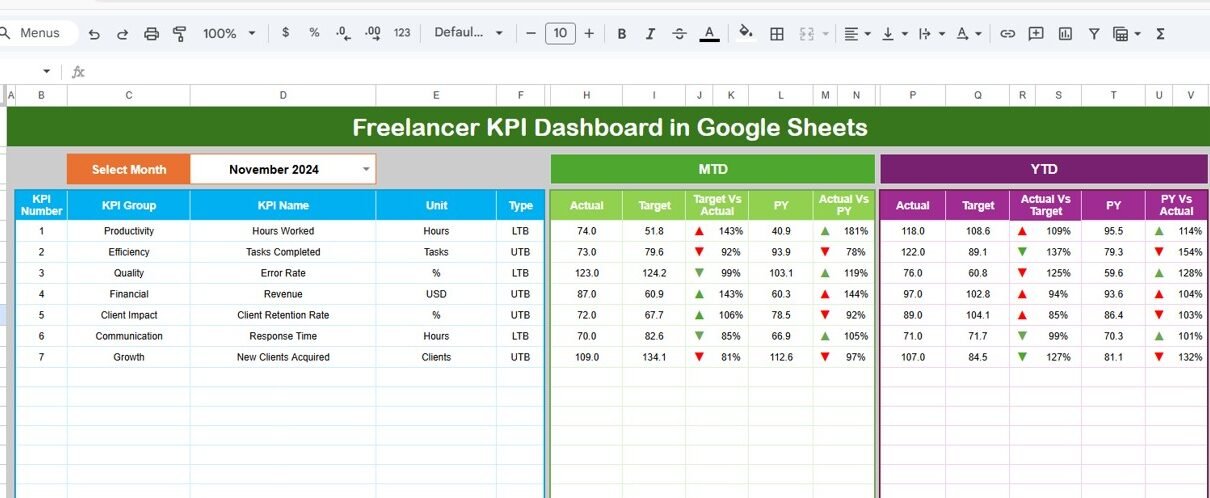
Freelancer KPI Dashboard in Google Sheets
Freelancing gives you freedom. However, freedom without structure creates confusion. Many freelancers work hard every month, yet they still struggle to measure growth clearly. As a result, income becomes unstable, productivity drops, and long-term planning suffers. So, how can you manage your freelance business like a professional company? The answer is simple. You need a […]
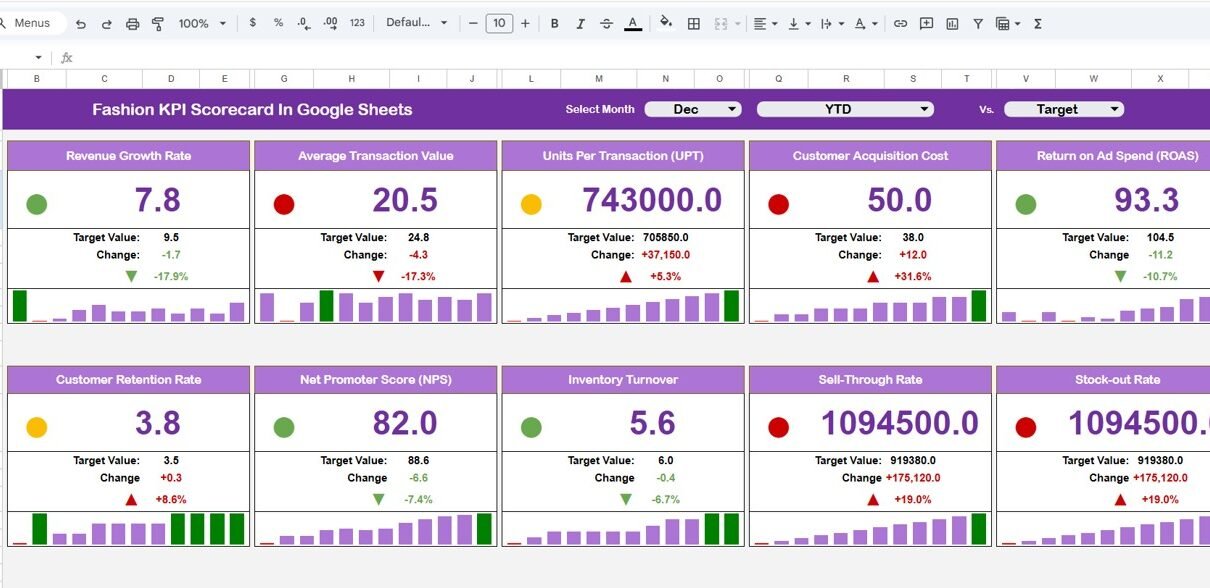
Fashion KPI Scorecard in Google Sheets
The fashion industry moves fast. Trends change every season. Moreover, customer demand shifts quickly. Therefore, fashion brands must track sales, margins, inventory, and customer performance in real time.Fashion KPI Scorecard in Google Sheets However, many fashion businesses still depend on scattered Excel sheets. As a result, managers struggle to compare monthly performance, track targets, and […]
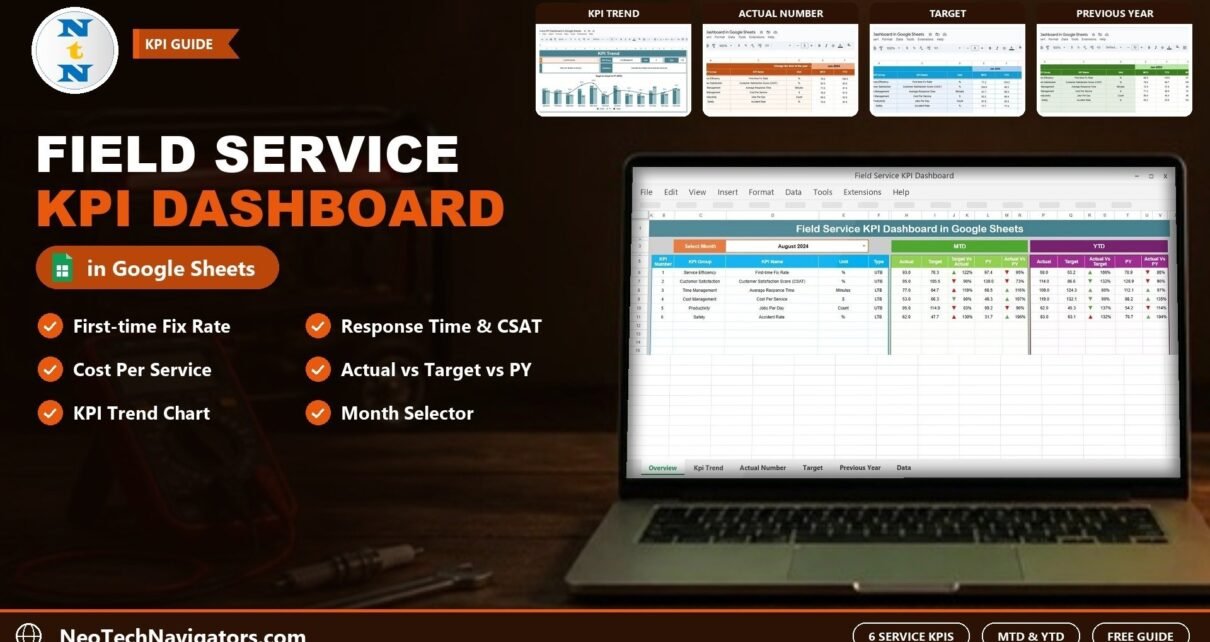
Field Service KPI Dashboard in Google Sheets
A Google Sheets KPI dashboard for field service teams that tracks First-time Fix Rate, CSAT, Average Response Time, Cost Per Service, Jobs Per Day and Accident Rate with MTD/YTD Actual vs Target vs Previous Year.
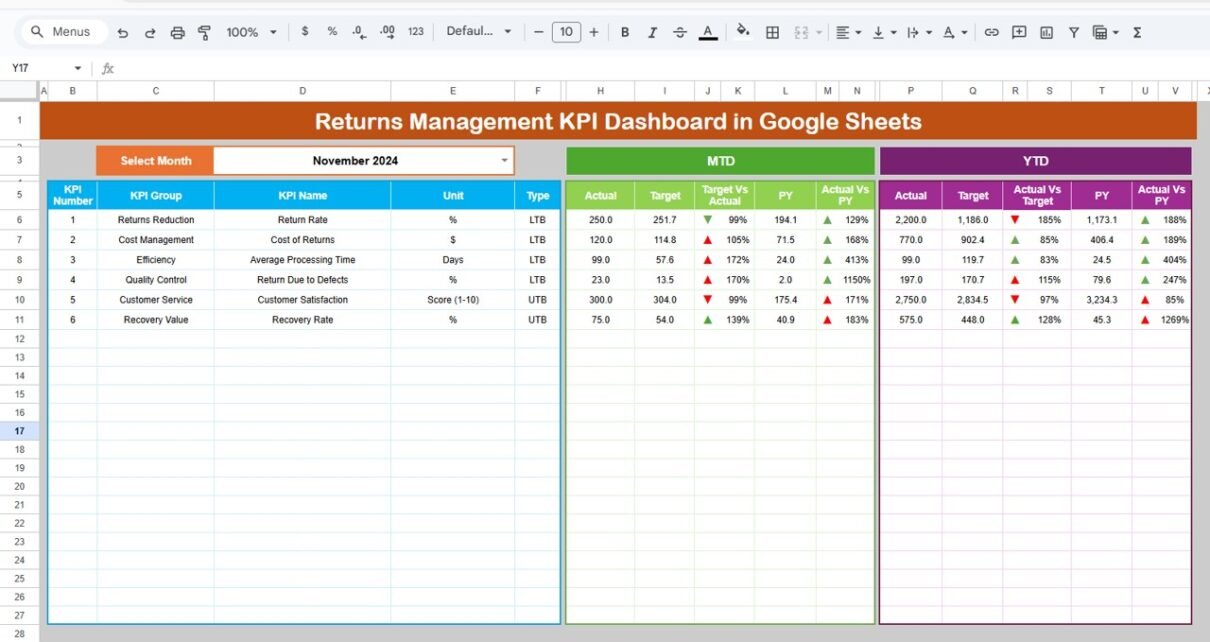
Returns Management KPI Dashboard in Google Sheets
Managing returns is no longer just an operational task. Instead, it plays a direct role in customer satisfaction, cost control, and profitability. Companies handle product returns daily. However, many businesses still track return data in scattered spreadsheets. As a result, managers struggle to monitor return rates, processing time, and financial impact.Returns Management KPI Dashboard in […]
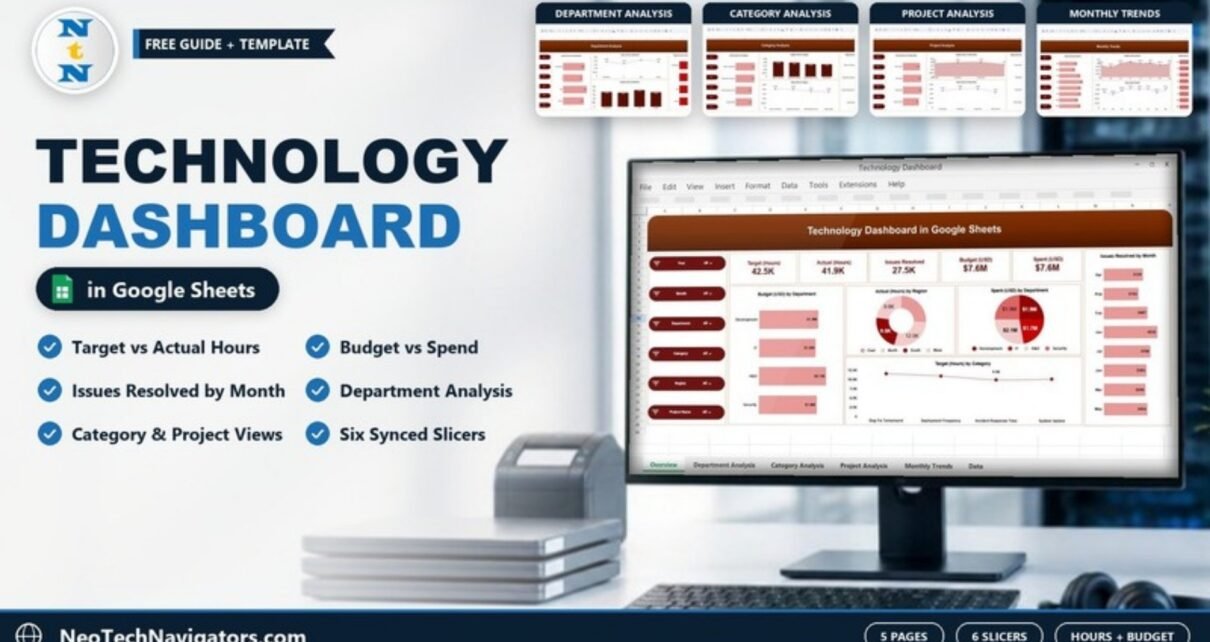
Technology Dashboard in Google Sheets
A five-page Technology Dashboard in Google Sheets that tracks target vs actual hours, issues resolved, budget and spend by department, category, project and month.
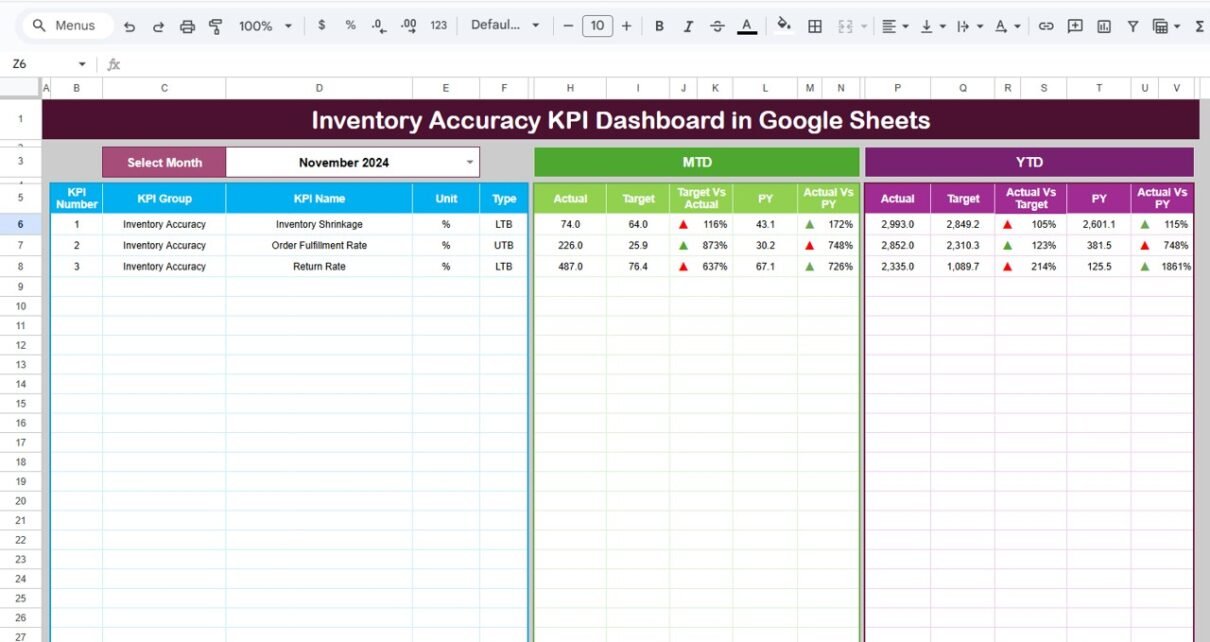
Inventory Accuracy KPI Dashboard in Google Sheets
An Inventory Accuracy KPI Dashboard in Google Sheets is a structured performance tracking tool. It helps warehouse managers, supply chain teams, and inventory controllers measure stock accuracy and operational efficiency.Inventory Accuracy KPI Dashboard in Google Sheets Because the dashboard runs on Google Sheets, you can access it from anywhere. Moreover, your team can collaborate in […]
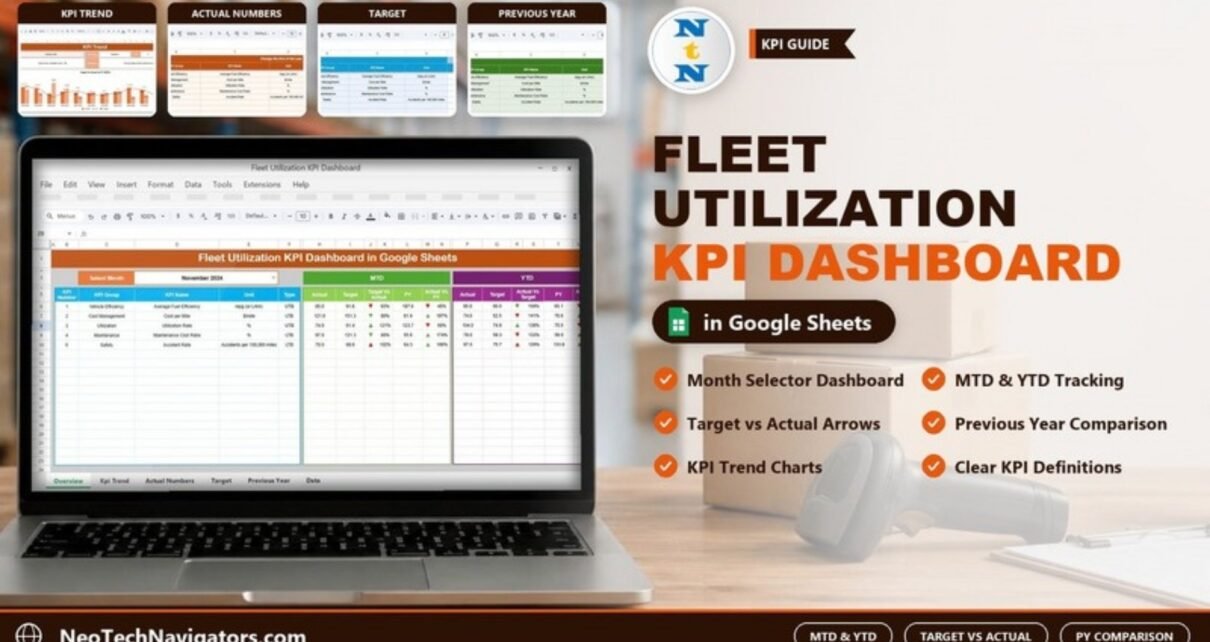
Fleet Utilization KPI Dashboard in Google Sheets
How the Fleet Utilization KPI Dashboard in Google Sheets compares five fleet KPIs (fuel efficiency, cost per mile, utilization rate, maintenance cost ratio and accident rate) with targets and last year on an MTD and YTD basis, with formulas and setup steps.
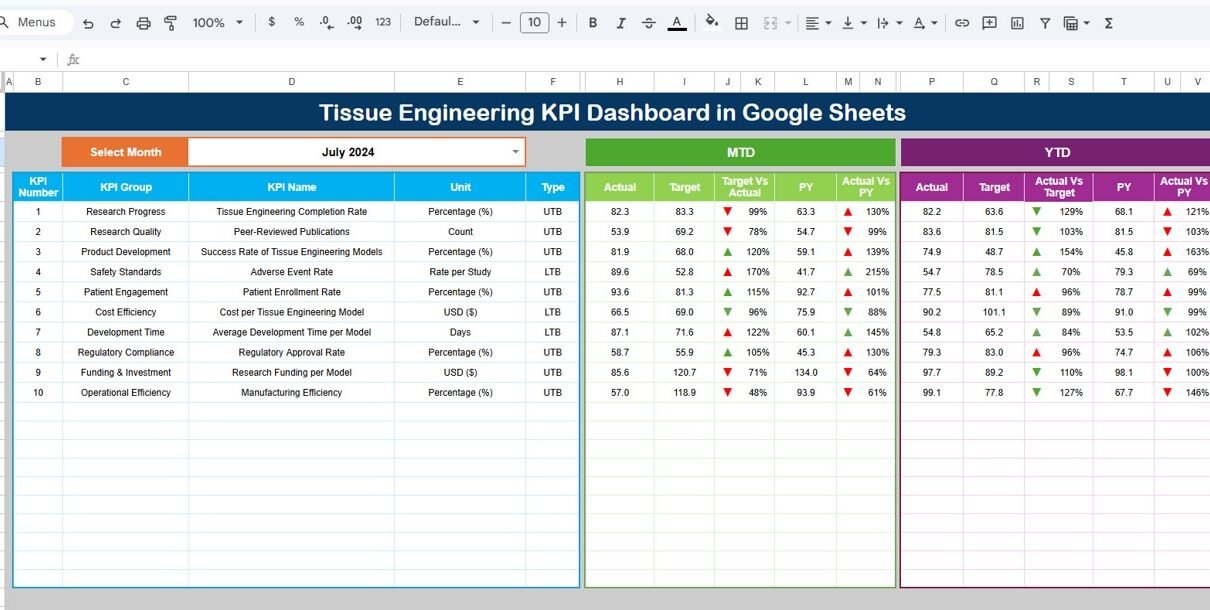
Tissue Engineering KPI Dashboard in Google Sheets
Tissue engineering is a highly specialized and data-intensive field where success depends on precise monitoring of research efficiency, quality outcomes, cost control, and long-term performance trends. Managing these KPIs manually across multiple spreadsheets can quickly become time-consuming and error-prone.Tissue Engineering KPI Dashboard in Google Sheets That is where the Tissue Engineering KPI Dashboard in Google […]
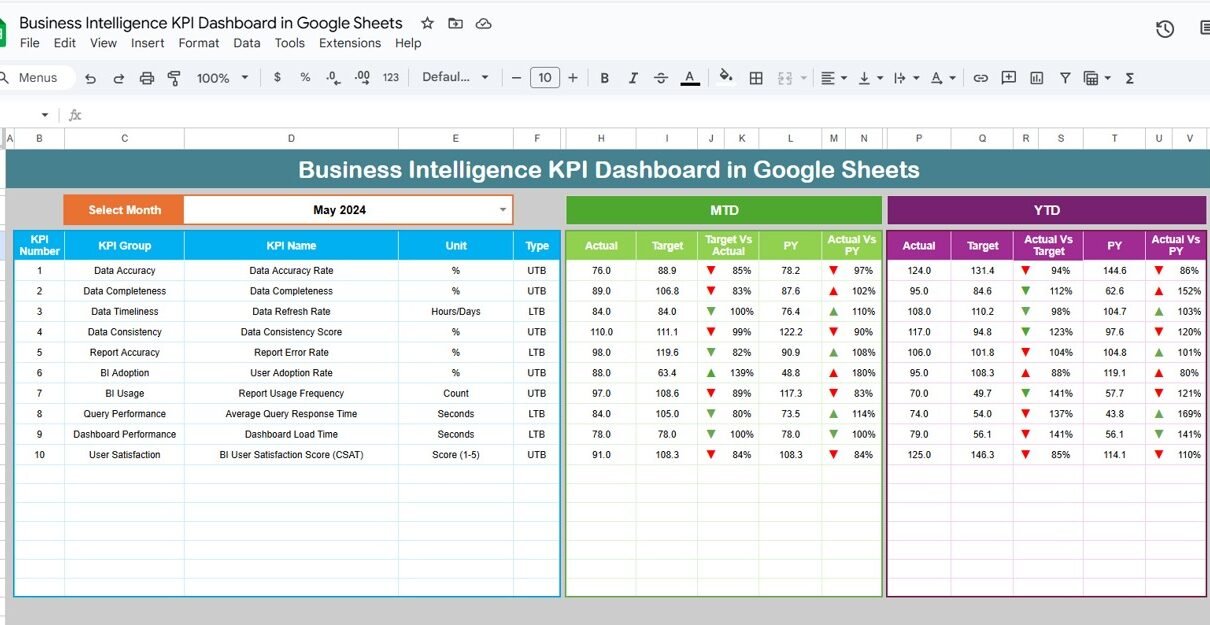
Business Intelligence KPI Dashboard in Google Sheets
Every organization generates massive volumes of data every day. However, data alone never creates value unless teams convert it into meaningful insights. Because of this challenge, business leaders increasingly rely on structured dashboards that track performance clearly and consistently. A Business Intelligence KPI Dashboard in Google Sheets provides a simple yet powerful solution to monitor […]