Google Sheets

Dynamic Map in Google Sheets

Google Sheets is a powerful tool for managing data and creating visualizations. One of its advanced features is the ability to create dynamic maps. A dynamic map in Google Sheets allows you to visualize data in an interactive, map-based format that updates based on user input. This can be incredibly useful for tracking sales performance, […]


Power BI

Text/CSV Connectivity in Power BI

Power BI is a powerful tool that allows users to connect, analyze, and visualize data from various sources. Among these sources, Text/CSV files are common data formats used across industries for storing information. These formats are lightweight and easy to share, making them a popular choice for exporting data from various systems. This article provides […]

Google Sheets

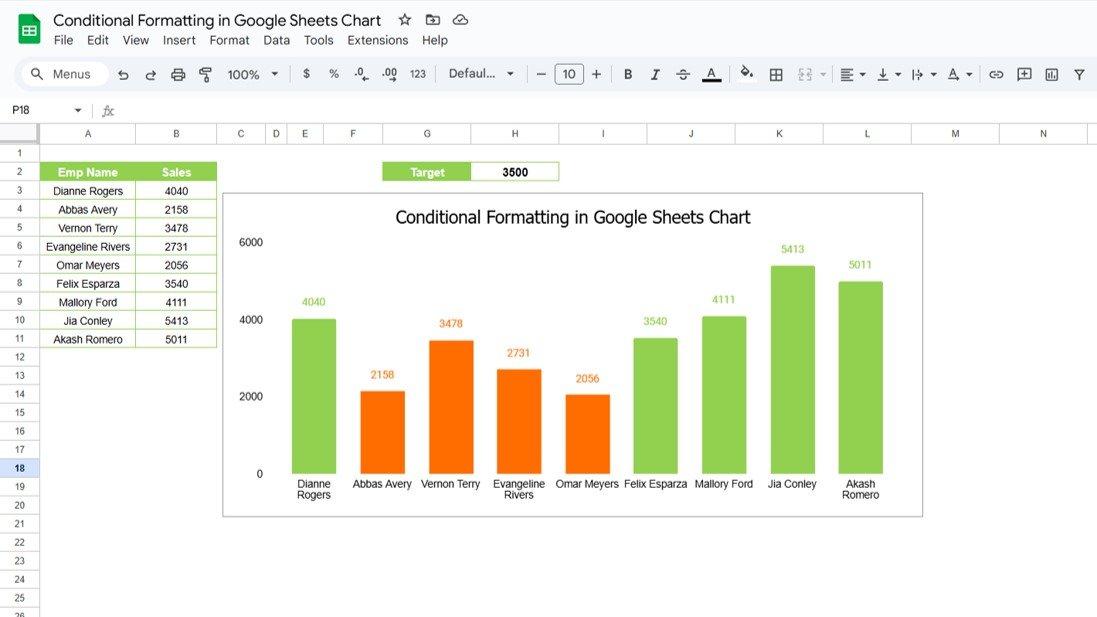
Conditional Formatting in Google Sheets Chart

Google Sheets offers a wide range of features to help you visualize and analyze data efficiently. One of the most powerful and visually appealing options is Conditional Formatting in Google Sheets Charts. By using conditional formatting, you can instantly highlight key data points, making it easier to interpret your data. In this article, we will […]

Power BI

How to Install Power BI Desktop Application for Free

If you’ve been curious about exploring the powerful world of Power BI but are unsure about the cost, there’s some great news for you! You can download and use the Power BI Desktop application absolutely free. In this article, we’ll walk you through the straightforward steps to install Power BI Desktop directly from Microsoft’s official […]

Google Sheets

IF and UNICHAR Function In Google Sheets

Google Sheets is packed with powerful functions that can help you achieve almost anything with your data, from simple calculations to complex conditions. Today, we’re going to dive into two super handy functions—IF and UNICHAR Function—that you can use together to make your data not only more informative but also a little more fun. In […]

Google Sheets

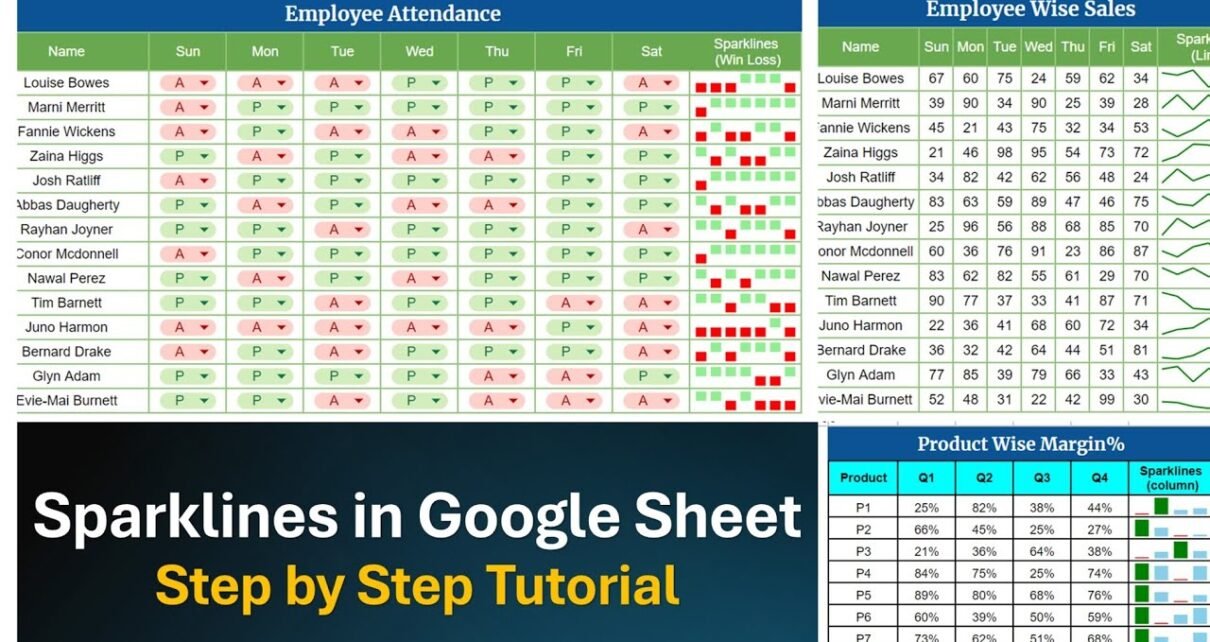
Sparklines in Google Sheets

Have you ever wondered how to make your data look snappy without clogging your spreadsheet with bulky charts? Well, Sparklines in Google Sheets are your go-to solution! These tiny, powerful mini-charts sit neatly in a single cell, showcasing trends and variations with ease. Google Sheets has made it incredibly simple for anyone to add and […]

Google Sheets

Google Sheet Hacks: The Ultimate 3D Doughnut Chart Guide!

Hey there! Are you ready to jazz up your Google Sheets with some snazzy The Ultimate 3D Doughnut Chart Guide!? Well, you’re in the right place! Today, I’m going to walk you through creating a dynamic The Ultimate 3D Doughnut Chart Guide! That not only looks cool but also updates automatically. So, let’s dive in […]

Google Sheets

Visualize Like a Pro: Ultimate Gauge Chart Guide in Google Sheet!

Hey there! Ready to turn your Google Sheets into a powerful dashboard? Well, you’re in luck because today we’re diving into the world of Ultimate Gauge Chart Guide in Google Sheet! These charts are not just cool to look at; they’re incredibly useful for visualizing data like service levels. So, let’s get started and show […]

Google Sheets

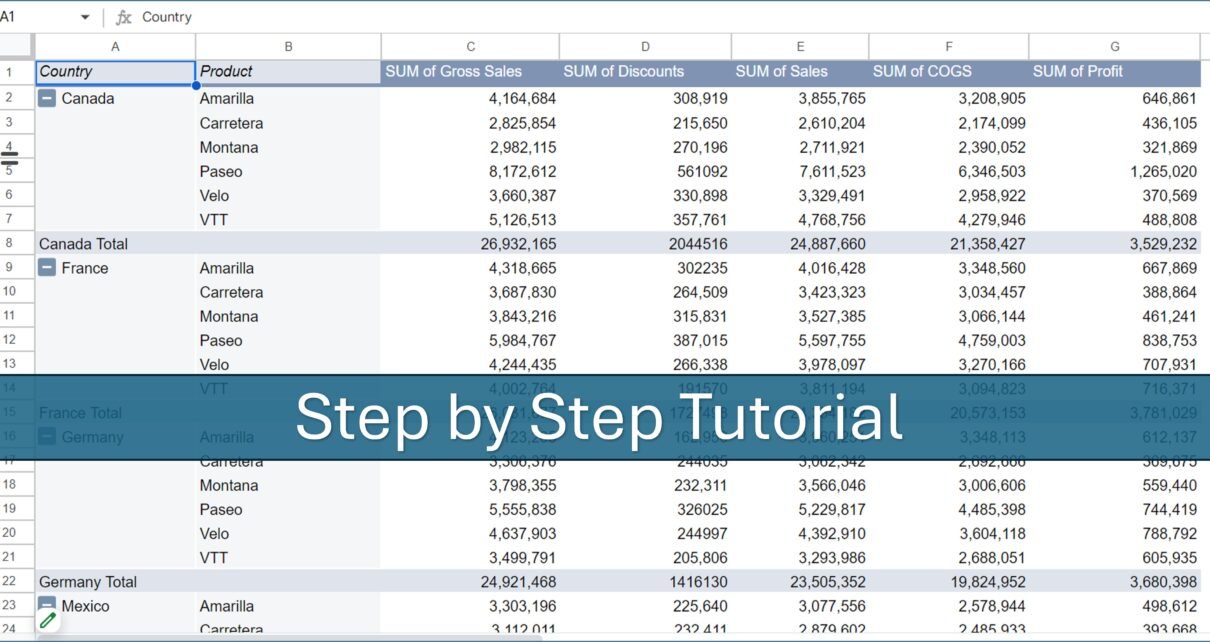
Pivot Table Guide for Google Sheets

Pivot tables are a powerful tool in Google Sheets, enabling users to summarize, analyze, explore, and present data comprehensively. This article  is Pivot Table Guide for Google Sheets creating, using, and optimizing pivot tables in Google Sheets, leveraging straightforward examples and practical tips. What is a Pivot Table in Google Sheets? A pivot table is […]

Sales KPI Dashboard
Google Sheets

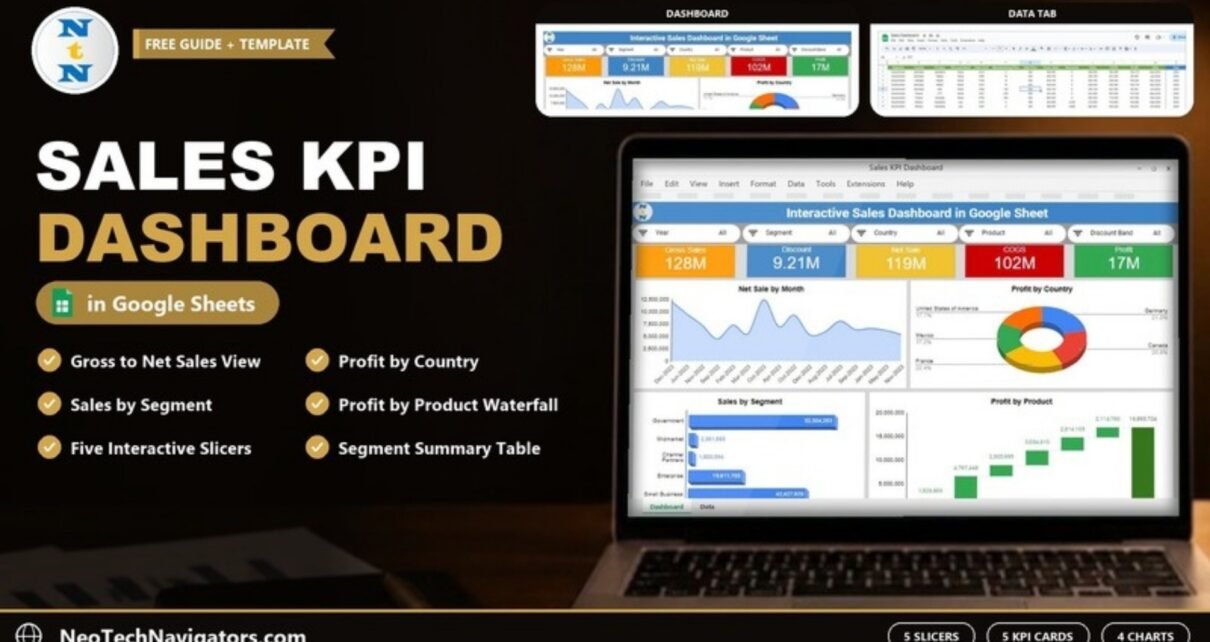
Sales KPI dashboard in Google Sheet

In this article, we have explained our latest google sheet template Sales KPI Dashboard. In today’s fast-paced business environment, tracking and analyzing sales performance is crucial for any organization. Out latest template of Sales KPI Dashboard in Google Sheets offers a dynamic and accessible way to visualize your sales data. It empowers your Sales team […]