In today’s fast-paced media industry, tracking performance is more important than ever. Whether you manage digital campaigns, television broadcasting, radio channels, or online media platforms, you deal with massive amounts of performance data daily. However, when this data is scattered across multiple sheets, it becomes difficult to analyze trends and make informed decisions.Mass Media KPI Scorecard in Google Sheets
So, how can media professionals track KPIs, measure performance, and improve results—all in one place?
Mass Media KPI Scorecard in Google Sheets.
This powerful, ready-to-use scorecard helps media managers, marketing teams, and analysts monitor key performance indicators (KPIs) in real time. Moreover, it transforms raw data into meaningful insights using automated calculations, dynamic visuals, and structured KPI tracking.Mass Media KPI Scorecard in Google Sheets
Get the Mass Media KPI Scorecard in Google Sheets
What is a Mass Media KPI Scorecard in Google Sheets?
A Mass Media KPI Scorecard in Google Sheets is an interactive reporting tool designed to track and evaluate the performance of media campaigns and operations using key performance indicators.
Instead of managing multiple reports, this scorecard allows you to:
- Track 10 essential media KPIs in one place
- Analyze monthly and yearly performance
- Compare actual vs target values
- Monitor trends using MTD and YTD data
- Use visual indicators like traffic lights and arrows
Therefore, it simplifies performance tracking and enhances decision-making.
Why Do You Need a Mass Media KPI Scorecard?
Managing media performance manually often leads to confusion and delays. However, with a structured KPI scorecard, you gain clarity and efficiency.
Key Reasons to Use This Scorecard:
- Centralizes all KPI data
- Provides real-time performance tracking
- Improves campaign effectiveness
- Enhances reporting accuracy
- Saves time and reduces manual work
As a result, you can make faster and smarter media decisions
Key Features of Mass Media KPI Scorecard in Google Sheets
This scorecard includes multiple sheets designed to provide complete performance insights.
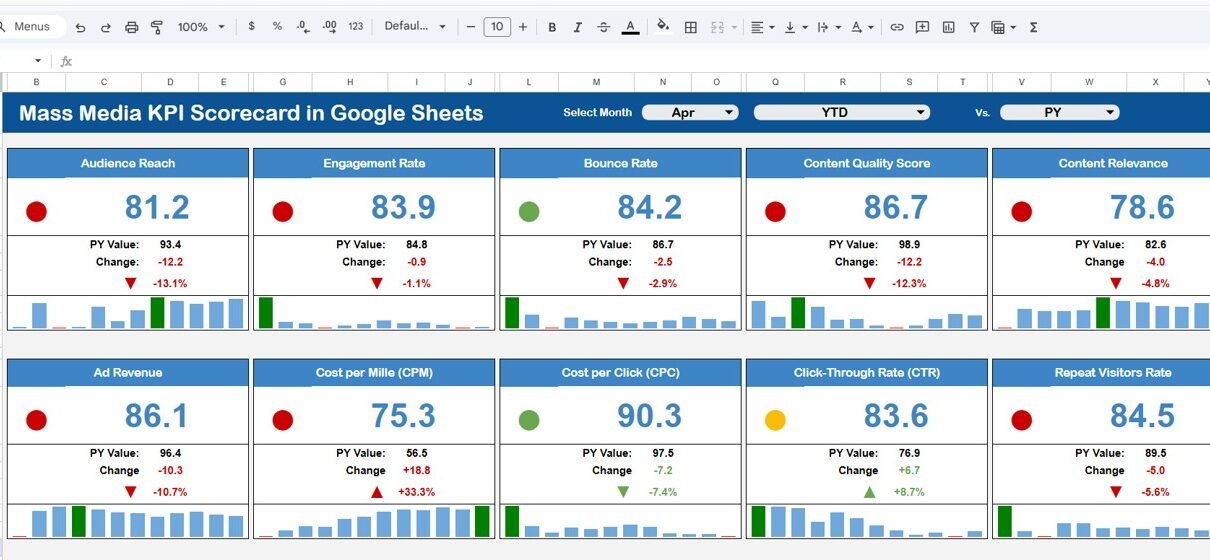
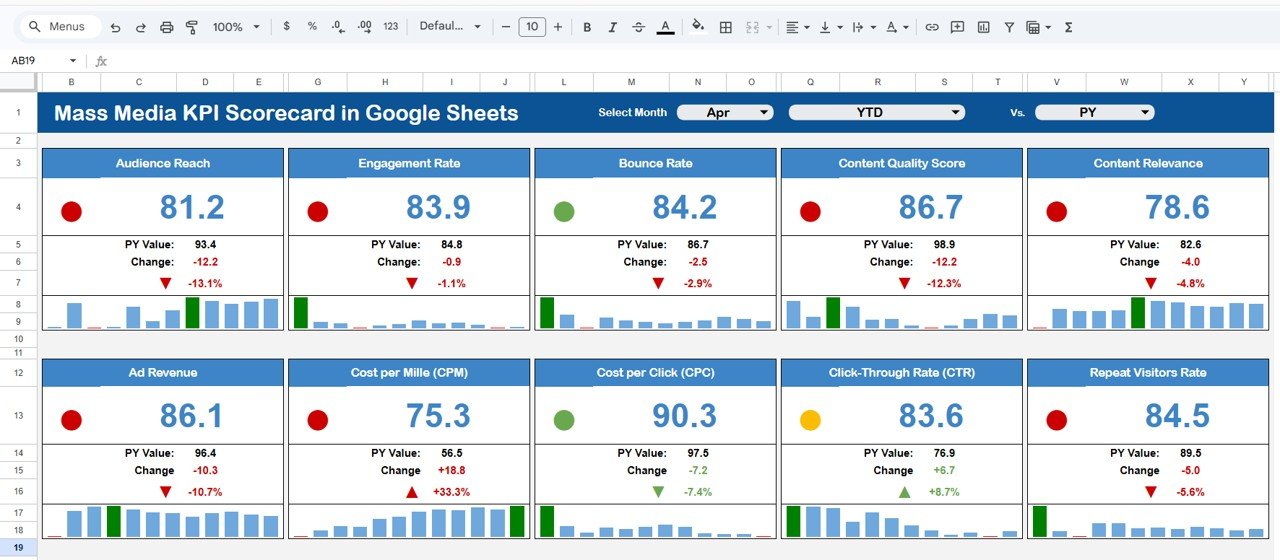
Dashboard Sheet – Central KPI Overview
The Dashboard Sheet is the main interface where all KPI performance is displayed.
🔹 Key Features:
- Month selection dropdown
- Dynamic updates based on selected month
- Display of 10 KPIs
- MTD (Month-to-Date) view
- YTD (Year-to-Date) view
🔹 Visual Indicators:
- Traffic light system (Green, Yellow, Red)
- Up/down arrows for performance comparison
- Target vs Actual comparison
- Previous year vs current year analysis
Trend Sheet – Analyze KPI Trends
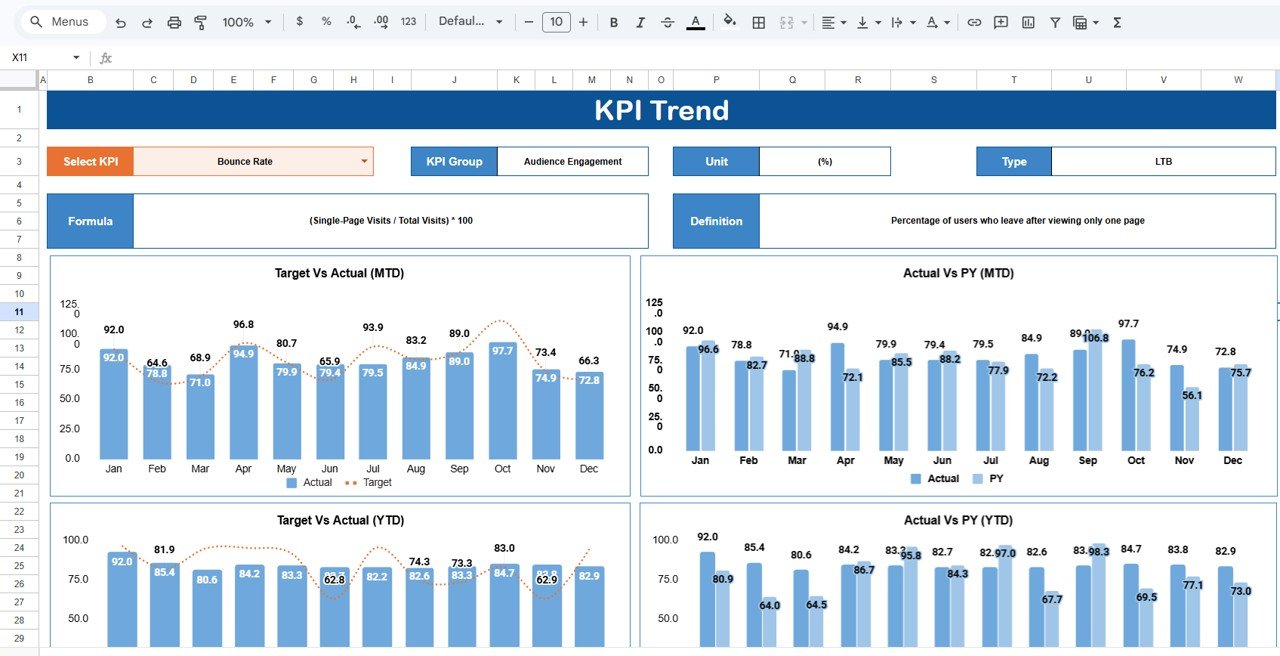
The Trend Sheet provides detailed insights into individual KPIs.
🔹 Features:
- KPI selection dropdown (Cell C3)
- Displays:
- KPI Group
- Unit of KPI
- KPI Type (Lower the better / Upper the better)
KPI Definition Sheet – Understand KPIs Clearly
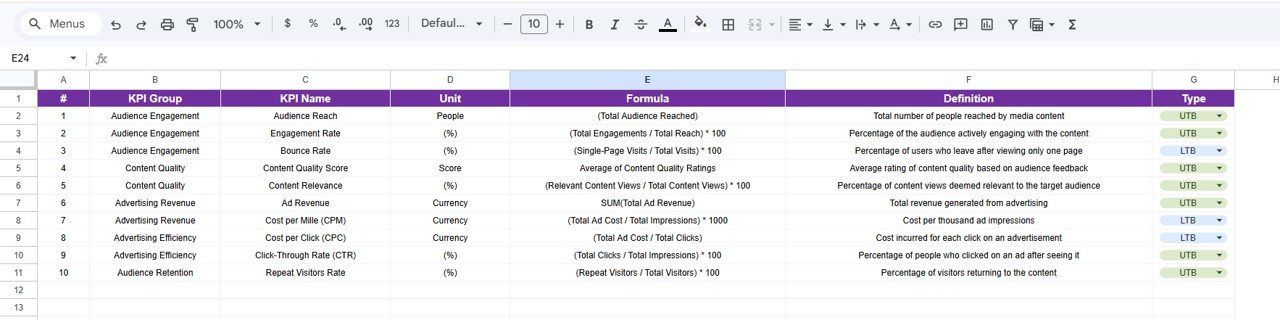
This sheet provides detailed KPI information.
🔹 Includes:
- KPI Name
- KPI Group
- Unit
- Formula
- KPI Definition
Data Input Sheet – Enter Performance Data
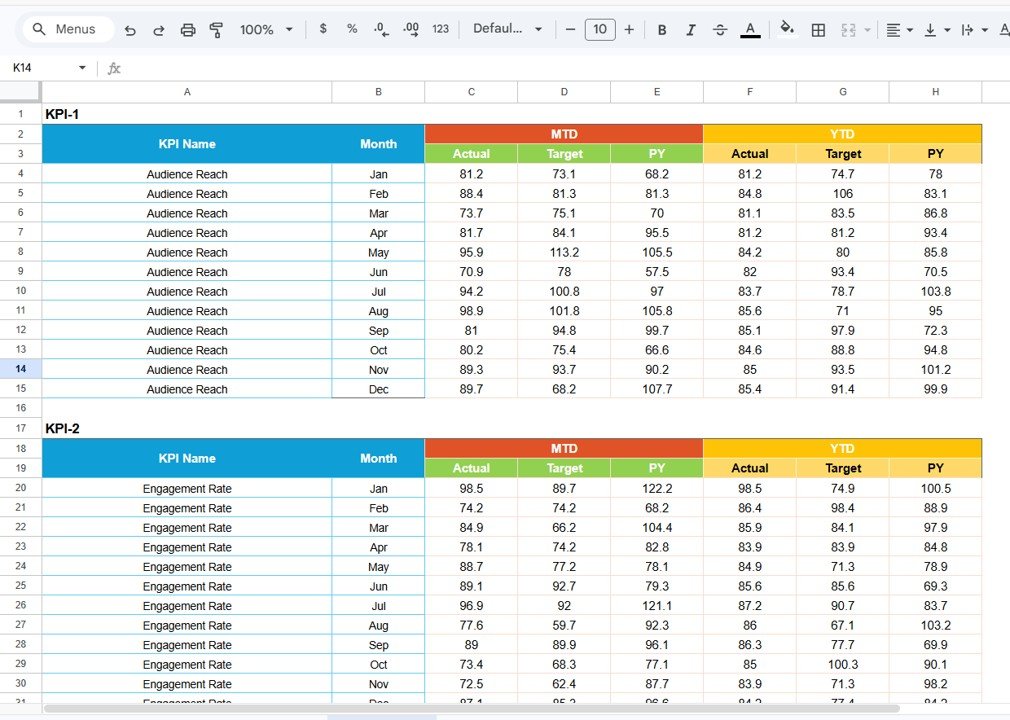
The Data Input Sheet is where you enter KPI values.
🔹 Features:
- Input MTD data
- Input YTD data
- Structured format for easy data entry
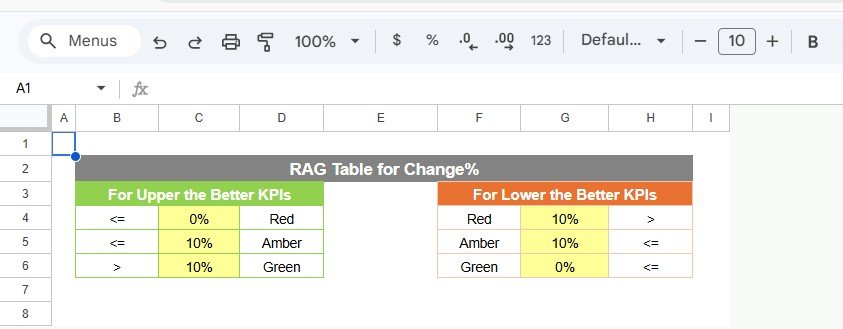
Colour Settings Sheet – Customize Visual Indicators
This sheet allows customization of dashboard visuals.
🔹 Features:
- Set color rules for KPIs
- Define thresholds for performance levels
Advantages of Mass Media KPI Scorecard in Google Sheets
Using this scorecard offers multiple benefits:
Real-Time Performance Tracking
- Monitor KPIs instantly
- Identify issues quickly
Improved Decision-Making
- Data-driven insights
- Better campaign strategies
Clear Data Visualization
- Easy-to-understand visuals
- Quick performance evaluation
Time-Saving Automation
- Automatic calculations
- Reduced manual effort
Enhanced KPI Management
- Structured KPI tracking
- Better performance monitoring
How Does This Scorecard Improve Media Performance?
This scorecard plays a key role in improving media performance.
Here’s how:
- It tracks campaign effectiveness
- It identifies high-performing channels
- It highlights underperforming areas
- It supports strategic planning
- It improves ROI
As a result, you can maximize your media performance.
Best Practices for the Mass Media KPI Scorecard in Google Sheets
To get the best results, follow these best practices:
Define Clear KPIs
- Focus on relevant media metrics
- Avoid unnecessary complexity
Update Data Regularly
- Keep data accurate
- Ensure real-time insights
Use Visual Indicators Effectively
- Monitor traffic lights
- Act on performance signals
Analyze Trends
- Review monthly and yearly trends
- Adjust strategies accordingly
Train Your Team
- Ensure proper usage
- Promote data-driven decisions
Opportunities for Improvement
You can enhance this scorecard further:
🔹 Add Automation
- Integrate with analytics tools
🔹 Include Advanced Analytics
- Add forecasting features
🔹 Expand KPI Coverage
- Include additional metrics
🔹 Enable Real-Time Data Integration
- Connect live data sources
Who Can Benefit from This Scorecard?
This scorecard is ideal for:
- 📺 Media companies
- 📊 Marketing teams
- 📢 Advertising agencies
- 📈 Business analysts
- 🎯 Campaign managers
Therefore, anyone involved in media performance tracking can benefit.
How to Use the Mass Media KPI Scorecard?
Using this scorecard is simple:
- Enter KPI definitions
- Input performance data
- Select the desired month
- Switch between MTD and YTD views
- Analyze dashboard insights
As a result, you can track and improve performance efficiently.
Prefer to learn the reporting skills behind scorecards like this? The Excel Pivot Tables & Dashboards course on NextGenTemplates Academy teaches them step by step with practice files.
Get the Mass Media KPI Scorecard in Google Sheets
Conclusion
The Mass Media KPI Scorecard in Google Sheets is a powerful tool for tracking and improving media performance. It simplifies KPI monitoring, enhances decision-making, and provides real-time insights.
Moreover, it helps organizations stay competitive in the fast-changing media landscape. Therefore, if you want to optimize your media performance, this scorecard is the perfect solution.