Hotel Hospitality Revenue Dashboard in Google Sheets
Managing hotel revenue, bookings, and guest satisfaction across multiple properties is a complex task that demands real-time visibility into every revenue stream. The Hotel Hospitality Revenue Dashboard in Google Sheets is a professionally designed, ready-to-use template that gives hotel managers, revenue analysts, and hospitality business owners a complete 360-degree view of their property performance — all within the familiar Google Sheets environment. This dashboard includes 6 interactive sheet tabs covering revenue analysis, occupancy trends, guest insights, booking search, and structured data entry. Whether you manage a single boutique hotel or a multi-property portfolio, this template helps you make data-driven decisions without needing expensive BI tools.Hotel Hospitality Revenue Dashboard in Google Sheets
If you work with hospitality data regularly, you might also find value in our Hospitality Dashboard in Google Sheets and the Hospitality KPI Scorecard in Google Sheets for additional tracking perspectives.
📖 Click here to Purchase Hotel Hospitality Revenue Dashboard in Google Sheets
Key Features of Hotel Hospitality Revenue Dashboard in Google Sheets
This template stands out because of its comprehensive coverage of hotel operations in a single spreadsheet. Here are the key features that make it an essential tool for hospitality professionals:
- 6 Interactive Dashboard Tabs — Overview, Revenue Analysis, Occupancy Analysis, Guest Analysis, Search Page, and Data Sheet provide complete coverage of hotel performance metrics from revenue to guest satisfaction.
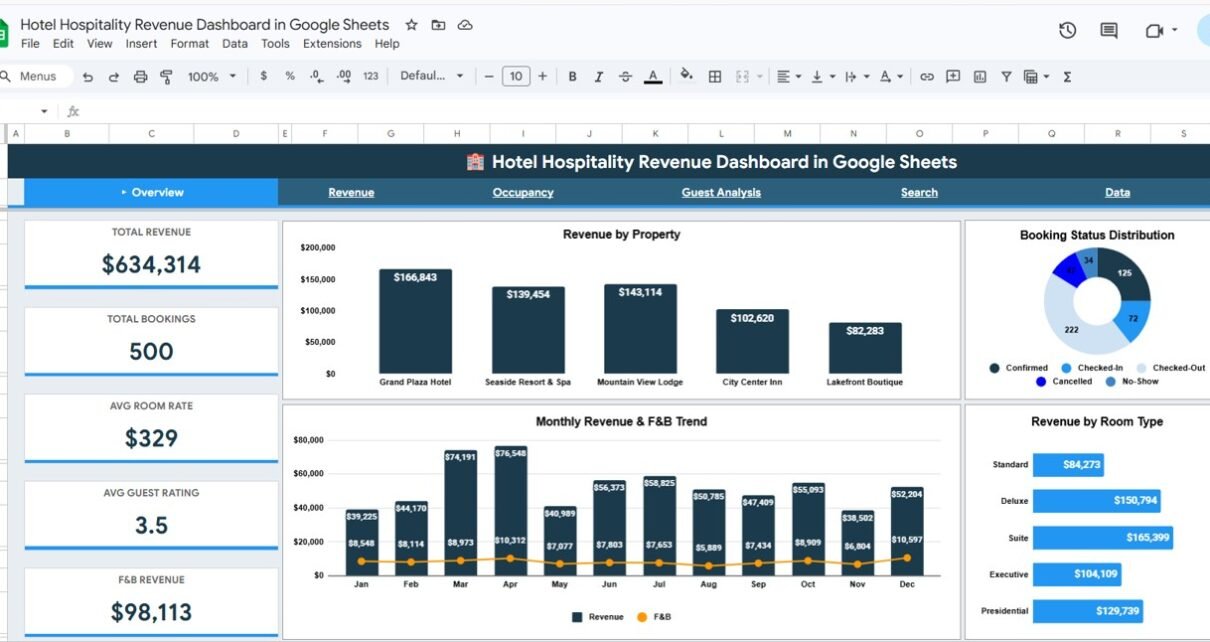
- 5 Real-Time KPI Cards — The Overview page displays Total Revenue, Total Bookings, Average Room Rate, Average Guest Rating, and F&B Revenue as instant-read KPI cards at the top of the dashboard.
- Dynamic Slicers and Filters — Multiple filter controls across all dashboard tabs let you drill down by property, room type, booking channel, guest region, booking status, and more to see targeted insights instantly.
- Multi-Property Revenue Tracking — Compare revenue performance across your entire hotel portfolio with property-level breakdowns, channel analysis, and room type revenue comparisons.
- Occupancy and Revenue Correlation — Unique analysis combining nights stayed with revenue generation helps identify which room types and properties deliver the best returns.
- Guest Satisfaction Monitoring — Track average guest ratings by property and over time, segment revenue by guest type, and identify your most valuable customer categories.
- Instant Booking Lookup — The Search Page provides a dropdown-based booking search that instantly displays all reservation details including revenue breakdown, guest information, and property details.
- Plug-and-Play Design — All formulas, charts, KPI cards, and slicers are pre-built. Simply copy the template to Google Drive, replace sample data in the Data Sheet, and everything updates automatically.
Dashboard Pages Explained
📖 Click here to Purchase Hotel Hospitality Revenue Dashboard in Google Sheets
The Hotel Hospitality Revenue Dashboard in Google Sheets is organized into 6 purpose-built sheet tabs. Each tab focuses on a specific aspect of hotel operations and performance tracking.
1. Overview Page
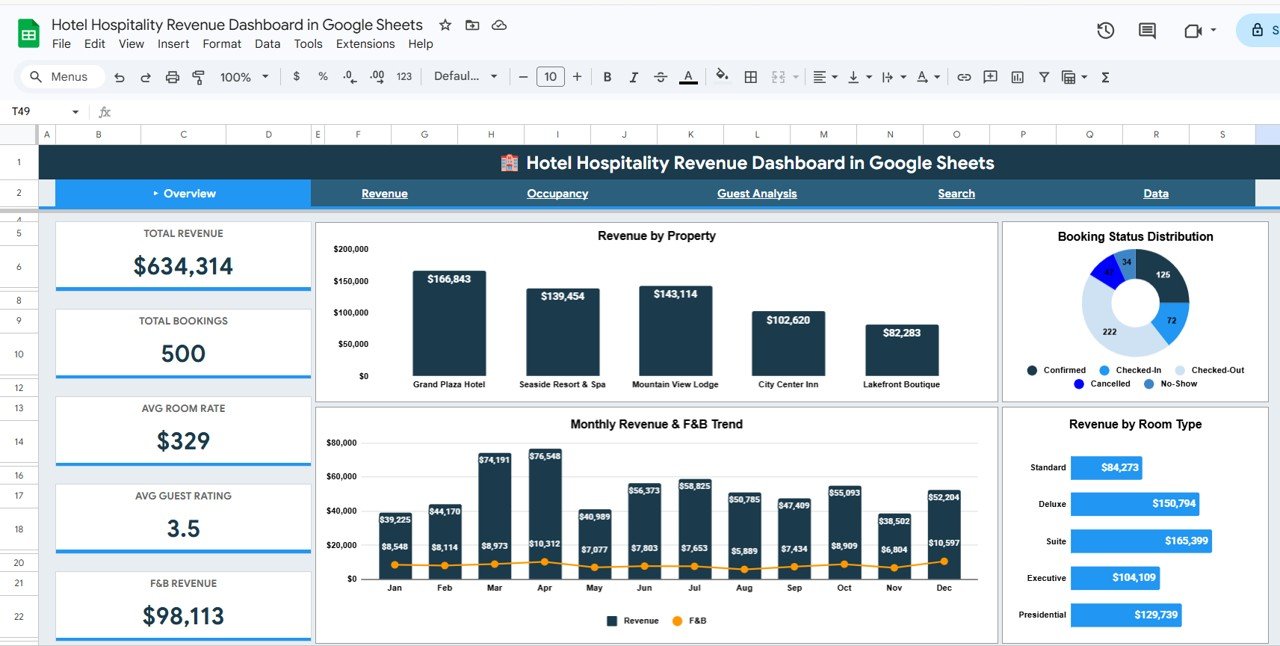
The Overview page serves as the command center of this dashboard. At the top, you’ll find 5 KPI cards displaying Total Revenue, Total Bookings, Avg Room Rate, Avg Guest Rating, and F&B Revenue — giving you an immediate snapshot of your hotel’s financial health. Below the KPI cards, the page includes 4 analysis charts: Revenue by Property shows how each property in your portfolio contributes to total revenue. Monthly Revenue and F&B Trend tracks revenue performance month over month alongside food and beverage income. Booking Status Distribution reveals the proportion of confirmed, cancelled, and pending bookings. Revenue by Room Type breaks down income by suite, standard, deluxe, and other room categories. Multiple slicers at the top allow you to filter the entire overview by specific properties, time periods, or other dimensions.Hotel Hospitality Revenue Dashboard in Google Sheets
Hotel Hospitality Revenue Dashboard in Google Sheets2. Revenue Analysis
The Revenue Analysis tab provides a deeper dive into where your money is coming from. This sheet includes 4 focused analysis views: Quarterly Revenue Comparison by Quarter helps you identify seasonal patterns and year-over-year growth trends. Revenue Stream Breakdown by Category separates room revenue, F&B revenue, spa revenue, and other income sources to show which streams drive the most value. Revenue by Guest Region maps income geographically so you can focus marketing efforts on your highest-value source markets. Revenue by Booking Channel compares direct bookings, OTA bookings, corporate channels, and walk-ins to help you optimize your distribution strategy and reduce commission costs.
Revenue Analysis3. Occupancy Analysis
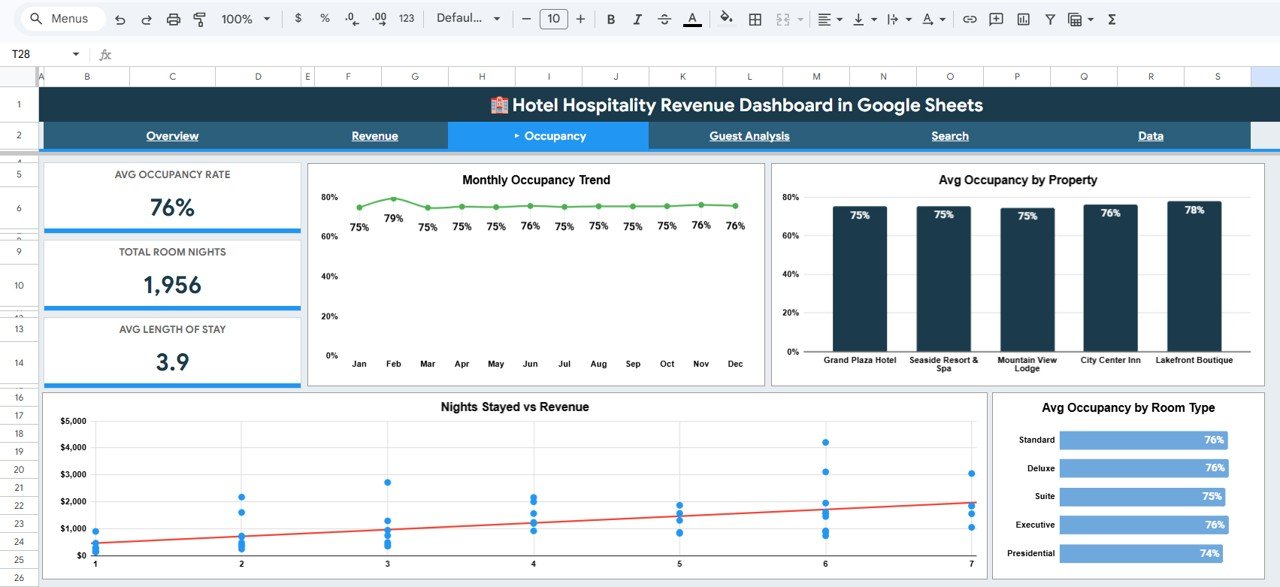
Understanding occupancy patterns is critical for revenue management and pricing strategy. The Occupancy Analysis tab includes: Monthly Occupancy Trend by Month displays how your occupancy rate fluctuates throughout the year, helping you identify peak and off-peak seasons. Avg Occupancy by Property compares utilization rates across your portfolio so you can spot underperforming locations. Nights Stayed vs Revenue provides a correlation view that reveals whether longer stays generate proportionally more revenue. Avg Occupancy by Room Type shows which room categories have the highest demand and can inform pricing adjustments.Hotel Hospitality Revenue Dashboard in Google Sheets
 Occupancy Analysis
4. Guest Analysis
The Guest Analysis tab helps you understand who your guests are and how satisfied they are with your service. Guest Type Distribution by Category breaks down your bookings by guest segment — business travelers, leisure guests, group bookings, and more. Avg Guest Rating by Property reveals which properties deliver the best guest experience. Monthly Avg Guest Rating Trend by Month tracks satisfaction over time so you can correlate improvements or declines with operational changes. Revenue by Guest Type shows which guest segments contribute the most to your bottom line, helping you prioritize your marketing and service investments.
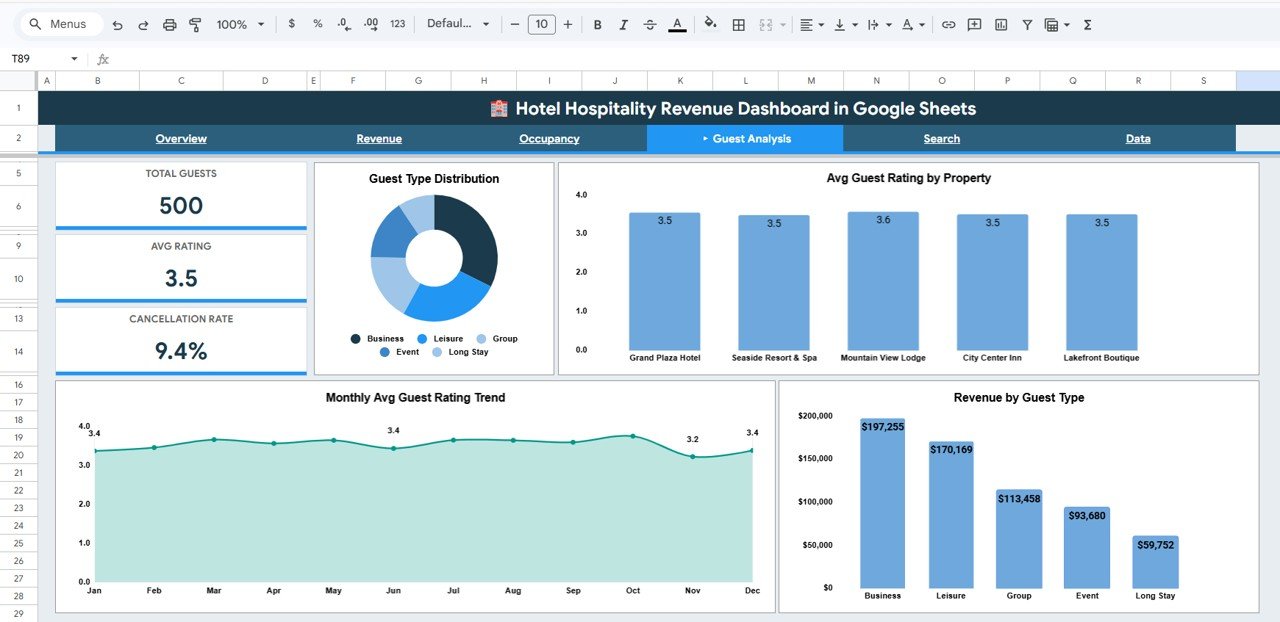 Guest Analysis
5. Search Page
The Search Page is a powerful lookup tool that lets you find any booking instantly. Simply select a Booking ID from the dropdown, and the page displays every detail for that reservation: guest name, room type, property name, booking channel, guest region, number of nights, room rate, total revenue, F&B revenue, spa revenue, other revenue, occupancy percentage, guest rating, booking status, and guest type. On the right side, Quick Stats panels show total bookings, average room rate, total revenue, and average rating for quick reference. This is especially useful when handling guest inquiries or reviewing specific reservation performance.Hotel Hospitality Revenue Dashboard in Google Sheets
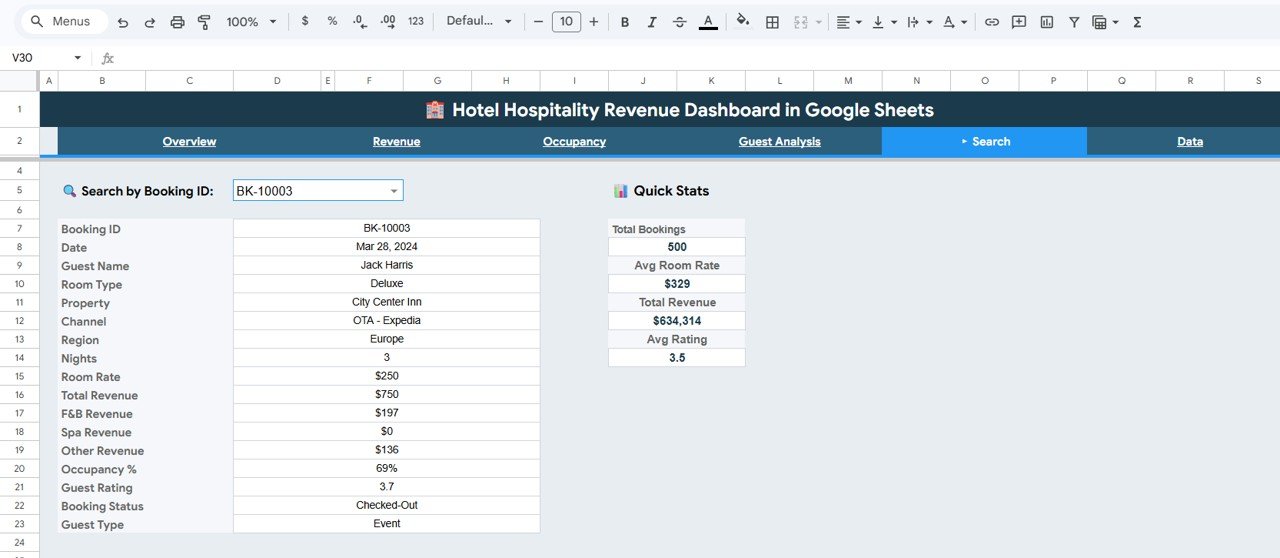 Search Sheet Tab
6. Data Sheet
The Data Sheet is where all your booking records live. Enter your data in the structured format provided — each row represents a single booking with columns for booking ID, guest name, property, room type, check-in date, nights stayed, room rate, revenue figures, occupancy, ratings, and more. All 5 dashboard tabs pull their data directly from this sheet, so when you replace the sample data with your own records, every chart, KPI card, and analysis view updates automatically in real time.
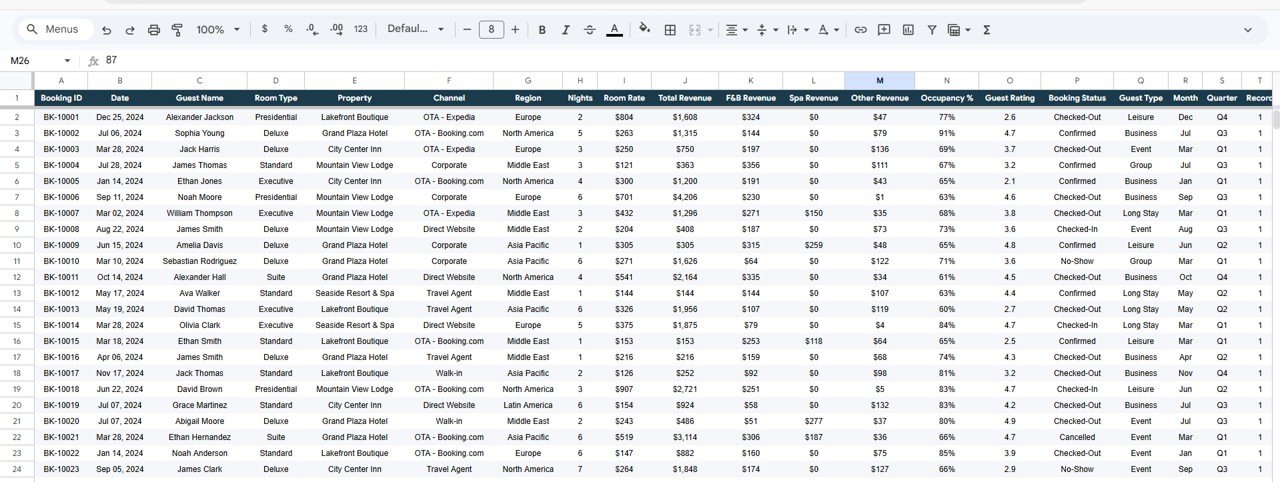 Data Sheet Tab
Advantages of Hotel Hospitality Revenue Dashboard in Google Sheets
📖 Click here to Purchase Hotel Hospitality Revenue Dashboard in Google Sheets
- Zero Setup Required — Unlike custom BI solutions that require weeks of configuration, this dashboard is ready to use immediately. Copy to Google Drive, paste your data, and start analyzing.
- Cloud-Based Collaboration — Being in Google Sheets means your team can access the dashboard from anywhere, share it with stakeholders, and collaborate in real time without software installations.Hotel Hospitality Revenue Dashboard in Google Sheets
- Cost-Effective Alternative — For small and mid-size hotel operators, this template delivers professional-grade analytics without the cost of Power BI, Tableau, or custom software development.
- Multi-Property Visibility — Property-level filters and comparisons across all tabs make it easy for hotel groups to monitor performance at both the portfolio and individual property level.
- Complete Revenue Picture — By tracking room revenue, F&B revenue, spa revenue, and other income streams, you get a holistic view of where your money comes from — not just room bookings.Hotel Hospitality Revenue Dashboard in Google Sheets
- Guest Intelligence — Combining satisfaction ratings with revenue data helps you identify which guest segments are most profitable and where service improvements will have the biggest financial impact.Hotel Hospitality Revenue Dashboard in Google Sheets
For similar dashboards in other formats, check out the Hospitality & Guest Booking Performance Dashboard in Google Sheets and the Hospitality KPI Dashboard in Google Sheets.
Opportunities for Improvement
- Forecast Integration — Adding a revenue forecasting tab using historical trends would help managers plan budgets and staffing more effectively.
- Competitive Benchmarking — Including fields for competitor pricing or market-average occupancy rates would provide context for your own performance metrics.
- Automated Data Import — Connecting to PMS (Property Management System) APIs via Apps Script could automate the data entry process and eliminate manual updates.
- Additional Time Filters — Week-over-week and year-over-year comparison views would add more granularity to trend analysis.
- Revenue Per Available Room (RevPAR) — Adding this industry-standard metric as a KPI card would align the dashboard more closely with professional hotel revenue management practices.
Best Practices for Using This Dashboard
📖 Click here to Purchase Hotel Hospitality Revenue Dashboard in Google Sheets
- Update Data Weekly — For the most accurate insights, export your PMS data weekly and paste it into the Data Sheet. Consistent updates ensure your charts and KPIs reflect current performance.
- Use Slicers Strategically — When presenting to stakeholders, use the slicer filters to focus on specific properties, time periods, or booking channels rather than showing everything at once.
- Monitor Guest Ratings Closely — A sudden dip in the Monthly Avg Guest Rating Trend can signal operational issues. Investigate promptly by cross-referencing with the Guest Analysis tab.
- Compare Revenue Channels — Regularly review the Revenue by Booking Channel chart to ensure you’re not over-reliant on high-commission OTA platforms. Shift marketing spend to promote direct bookings.
- Leverage the Search Page — When handling guest complaints or follow-ups, use the Search Page to quickly pull up booking details without scrolling through the raw data.
Explore Relevant Templates
If you’re looking for more hospitality and hotel management templates, NextGenTemplates offers a growing collection across multiple platforms:
- Hotel and Hospitality Revenue Dashboard in Excel — The same comprehensive revenue tracking dashboard built for Microsoft Excel users who prefer desktop-based analytics.
- Hotel and Hospitality Revenue Dashboard in Power BI — An advanced interactive version with drill-through pages, DAX measures, and dynamic filtering in Power BI Desktop.
- Hospitality & Guest Booking Performance Dashboard in Google Sheets — A complementary dashboard focused specifically on booking performance and guest analytics.
- Boutique Hotels Dashboard in Power BI — Purpose-built for boutique hotel operators tracking occupancy, revenue, and guest experience metrics.
- Hospitality Dashboard in Google Sheets — A broader hospitality management template covering operational KPIs and staff performance in Google Sheets.
Frequently Asked Questions
📖 Click here to Purchase Hotel Hospitality Revenue Dashboard in Google Sheets
What is the best Google Sheets template for tracking hotel revenue?
The Hotel Hospitality Revenue Dashboard in Google Sheets is one of the most complete options available. It tracks 5 key KPIs including Total Revenue, Total Bookings, Average Room Rate, Average Guest Rating, and F&B Revenue across 6 interactive tabs with charts, slicers, and a booking search page — all within Google Sheets.
How many KPIs does this hotel dashboard track?
The Overview page tracks 5 primary KPIs: Total Revenue, Total Bookings, Avg Room Rate, Avg Guest Rating, and F&B Revenue. Additional metrics like occupancy percentage, revenue by guest region, revenue by booking channel, and quarterly comparisons are available across the Revenue Analysis, Occupancy Analysis, and Guest Analysis tabs.
Can I use this dashboard for multiple hotel properties?
Yes. The dashboard supports multi-property tracking with property-level breakdowns in the Overview, Revenue Analysis, and Occupancy Analysis tabs. Use the built-in slicers to filter by specific properties or view the entire portfolio at once.
Do I need Google Sheets experience to use this template?
No advanced skills are required. The template is fully pre-built with formulas, charts, and KPI cards. Simply copy it to your Google Drive, replace the sample data in the Data Sheet, and all visualizations update automatically.
How do I track hotel revenue by booking channel in Google Sheets?
The Revenue Analysis tab includes a dedicated Revenue by Booking Channel chart that compares income from direct bookings, OTA platforms, corporate channels, and walk-ins. Enter your booking channel data in the Data Sheet and the chart generates automatically.
Can I customize the charts and add new data fields?
Yes. Since this is a Google Sheets template, you have full editing access. You can modify existing charts, add new columns to the Data Sheet, create additional analysis tabs, and extend the dashboard to match your specific hotel reporting requirements.
Conclusion
The Hotel Hospitality Revenue Dashboard in Google Sheets is a powerful, affordable, and easy-to-use template that brings professional-grade hotel analytics to your Google Drive. With 6 interactive tabs, 5 KPI cards, dynamic slicers, and a one-click booking search, it covers everything from high-level revenue overviews to granular guest satisfaction analysis. Whether you’re a hotel general manager, a revenue analyst, or a hospitality consultant, this dashboard gives you the visibility you need to make smarter, data-driven decisions.
📖 Click here to Purchase Hotel Hospitality Revenue Dashboard in Google Sheets
👉 Visit our YouTube channel for step-by-step tutorials: Youtube.com/@NeoTechNavigators