Law Firm Performance Dashboard in Google Sheets is a comprehensive, cloud-based analytics template designed for law firms, corporate legal departments, solo practitioners, and legal operations managers who need to monitor billing performance, case outcomes, attorney productivity, and financial health from one centralized Google Sheets dashboard. This template includes 6 interactive pages — Overview, Case Analysis, Financial, Attorney Performance, Search, and Data Sheet — providing complete visibility into every critical aspect of law firm operations.
Whether you manage a boutique litigation practice or a large corporate legal department, this dashboard transforms raw case data into actionable visual insights using dynamic charts, KPI summary cards, and interactive slicer filters. Simply make a copy to your Google Drive, replace the sample data with your own records, and all charts update automatically. For alternative platforms, explore the Law Firm Performance Dashboard in Excel or the Law Firm Performance Dashboard in Power BI.
Key Features of Law Firm Performance Dashboard in Google Sheets
Click here to Purchase the Law Firm Performance Dashboard in Google Sheets
The Law Firm Performance Dashboard in Google Sheets includes 6 interactive pages that track 5 core KPIs and feature over 15 analytical charts. It covers case management, billing and collections, attorney evaluation, financial analysis, and case search functionality — all within a single Google Sheets workbook that supports real-time team collaboration.
Key capabilities include high-level KPI tracking with Total Cases, Total Billed, Total Collected, Avg Hourly Rate, and Collection Rate displayed on the Overview page. Dynamic charts analyze Cases by Practice Area, Case Priority Distribution, Case Status Distribution, Monthly Billed vs Collected Revenue, Revenue vs Expenses by Practice Area, Attorney Revenue Ranking, and Attorney Collection Rates. Built-in slicers allow instant filtering by practice area, status, priority, and time period. A dedicated Search page provides quick case lookup by Case ID with filtered results.
Dashboard Pages Explanation
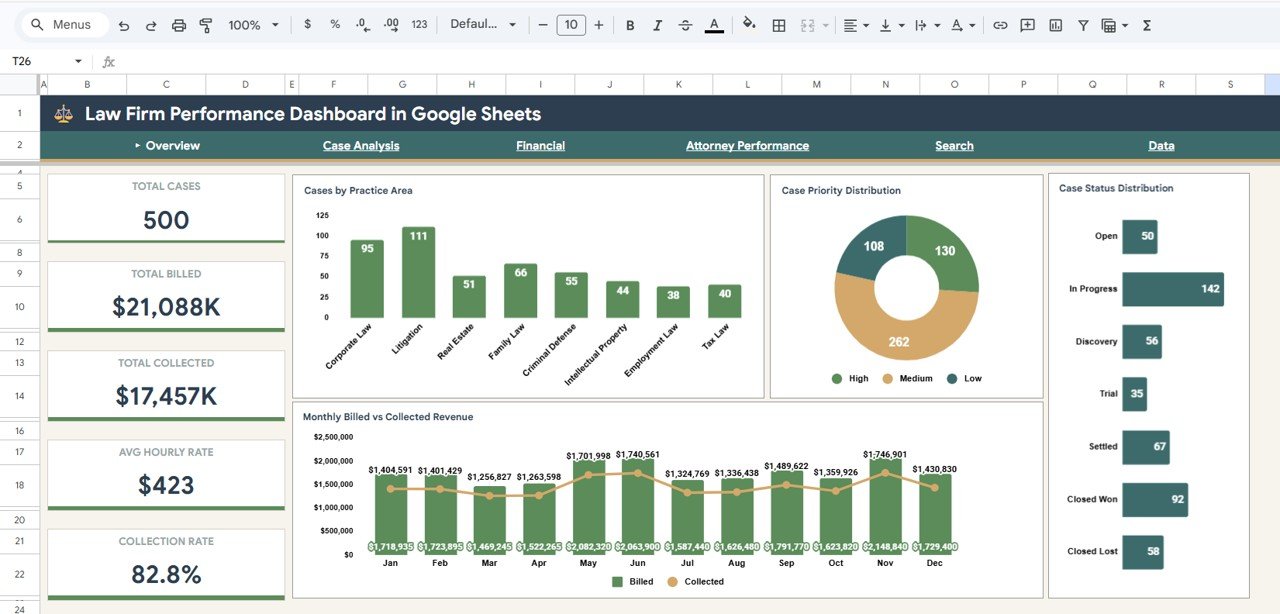
1. Overview Page
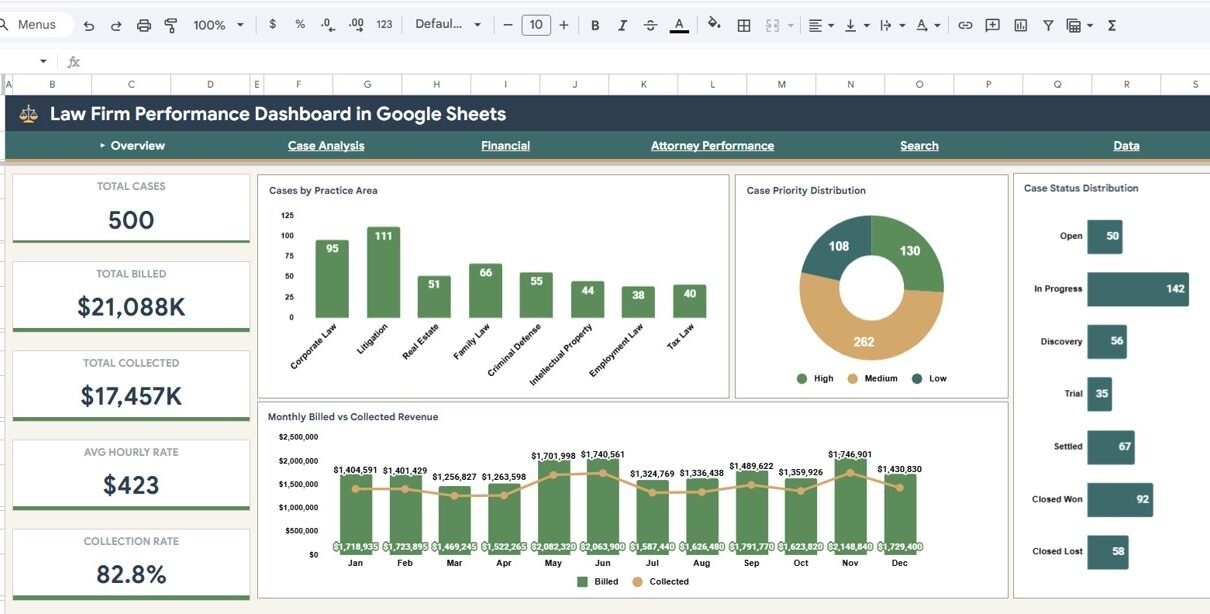
The Overview Page serves as your law firm command center. At the top, five KPI cards display Total Cases, Total Billed, Total Collected, Avg Hourly Rate, and Collection Rate for an instant snapshot of firm health. Below, you see Cases by Practice Area showing how workload is distributed across legal specialties, Case Priority Distribution by Priority Level highlighting the urgency mix of your caseload, Case Status Distribution by Status tracking the ratio of open to closed cases, and Monthly Billed vs Collected Revenue by Month revealing billing trends and collection gaps over time. Multiple slicers let you filter all charts simultaneously for targeted analysis.
Law Firm Performance Dashboard in Google Sheets
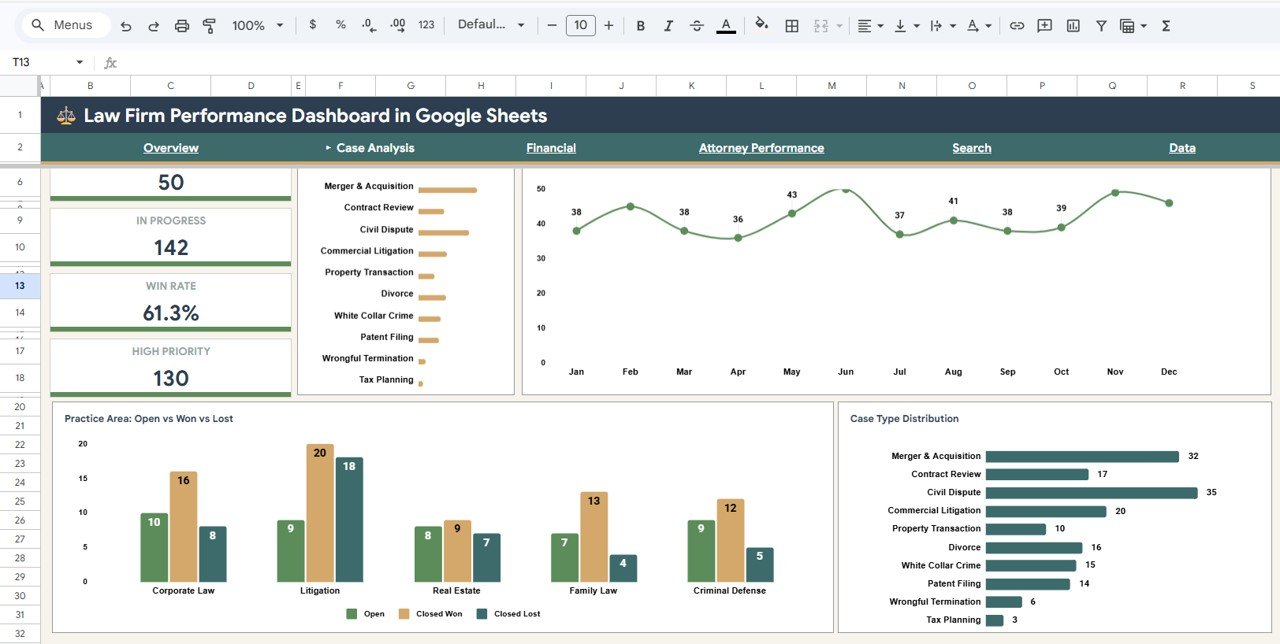
2. Case Analysis
The Case Analysis page provides deeper insights into your case portfolio. Cases by Month tracks how case volume fluctuates over time, helping you anticipate workload surges and plan staffing. Open vs Closed Won vs Closed Lost by Practice Area evaluates case outcomes across different legal specialties, allowing you to identify which practice areas have the best win rates. Case Type Distribution by Case Type breaks down your caseload by categories such as litigation, advisory, compliance, corporate, and others.
Case Analysis Page
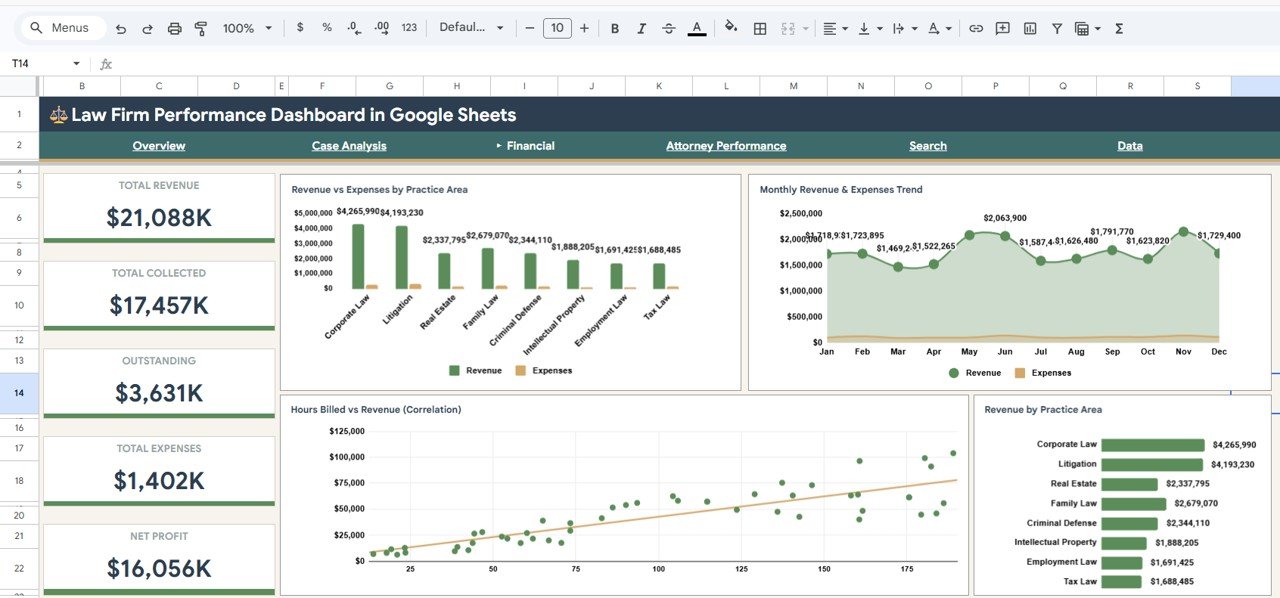
3. Financial
The Financial page focuses on your firm’s monetary performance. Revenue vs Expenses by Practice Area compares income against costs for each legal specialty, revealing which areas are most profitable. Monthly Revenue and Expenses Trend by Month shows how both metrics evolve over time so you can spot seasonal patterns and cost spikes early. Hours Billed vs Revenue Correlation helps evaluate billing efficiency across the firm. Revenue by Practice Area provides a clear ranking of which practice areas generate the most income.
Financial Page
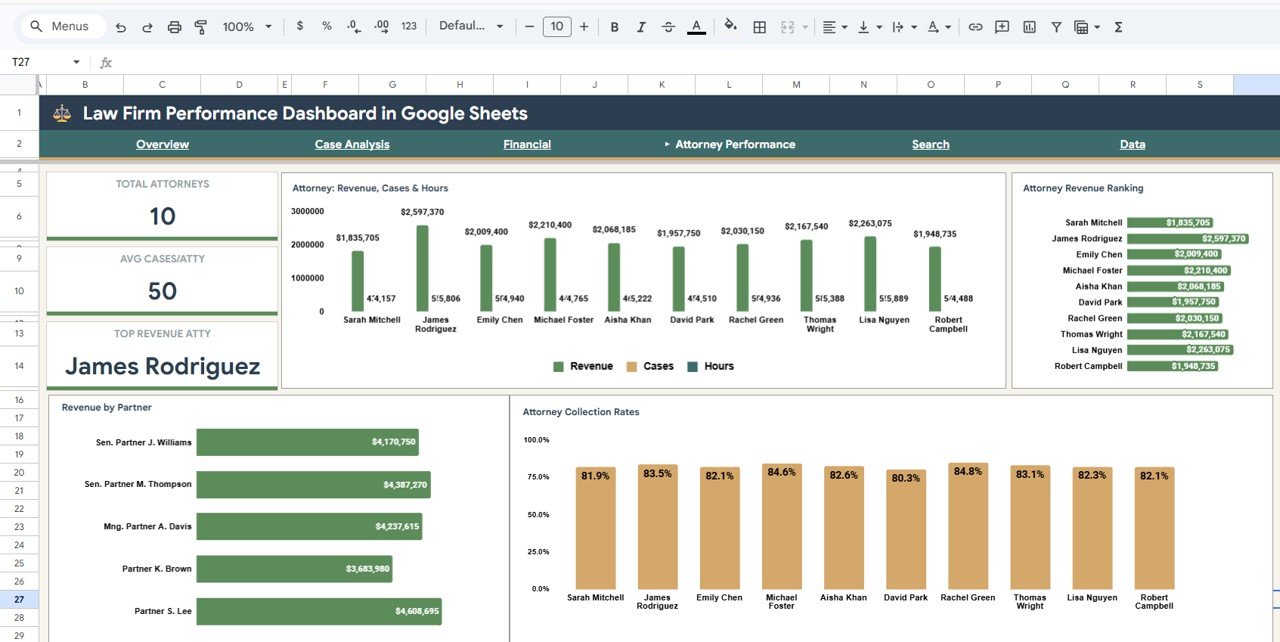
4. Attorney Performance
The Attorney Performance page evaluates individual attorney contributions across multiple dimensions. Attorney Revenue, Cases and Hours by Attorney provides a comprehensive performance overview combining billing, caseload, and time investment. Attorney Revenue Ranking by Attorney identifies your top earners. Revenue by Partner tracks partner-level billing contributions. Attorney Collection Rates by Attorney measures each attorney’s effectiveness at converting billed amounts into actual collected revenue — a critical metric for firm profitability.
Attorney Performance Page
5. Search
The Search page provides a convenient lookup tool for quick case retrieval. Case Lookup by Case ID lets you instantly find any specific case record by entering its unique identifier. The Search Results Table by Practice Area displays filtered results based on your search criteria, making it ideal for client meetings, quick case reviews, or pulling up details on the fly without scrolling through the full data set.
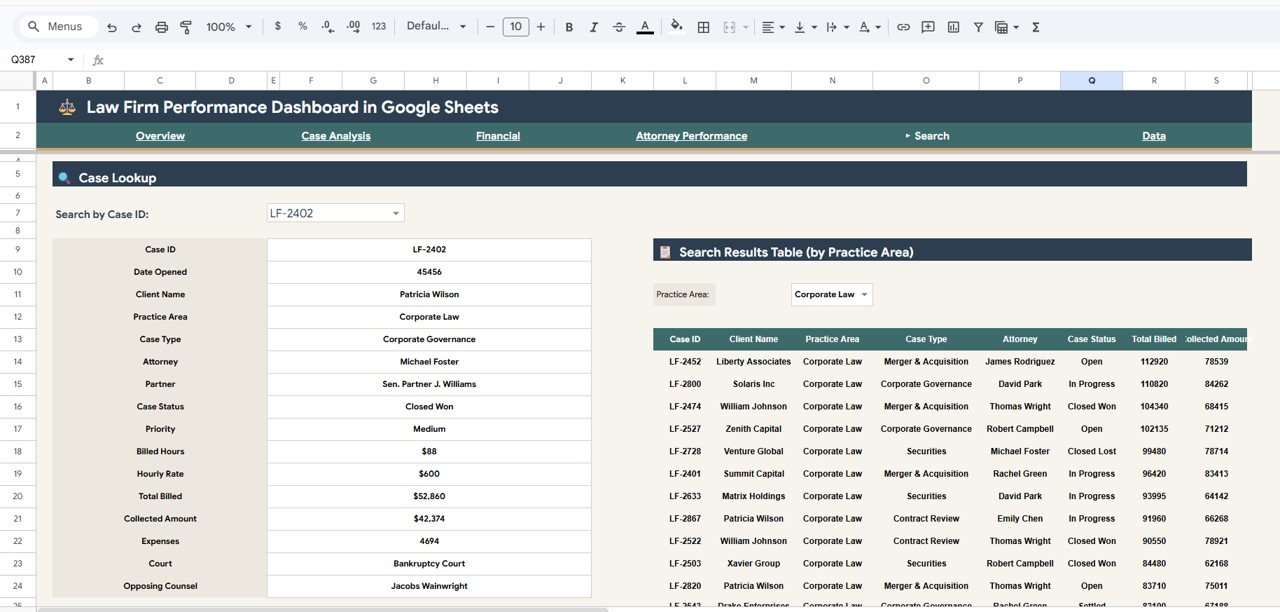
Search Page
6. Data Sheet Tab
The Data Sheet is where you enter all your law firm case records. It includes structured columns for Case ID, Practice Area, Case Type, Priority, Status, Attorney, Partner, Billed Amount, Collected Amount, Hourly Rate, Billable Hours, Expenses, Client Satisfaction, and more. All dashboard pages read from this single data source, so updating your data here automatically refreshes every chart and KPI across the entire workbook.
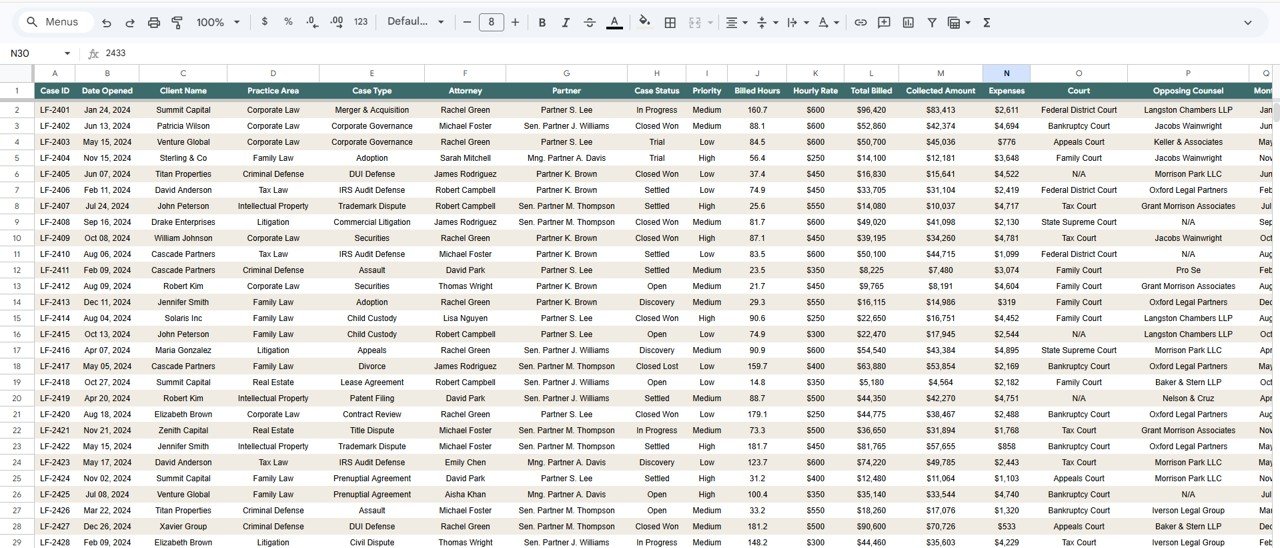
Data Sheet Tab
Advantages of the Law Firm Performance Dashboard in Google Sheets
This dashboard eliminates the need for complex BI tools by providing powerful analytics directly in Google Sheets. Because it runs in the cloud, your entire legal team can access and update the dashboard simultaneously from any device. The template requires no coding, no macros, and no additional software — just a Google account. All charts and KPIs refresh automatically when data changes, saving hours of manual reporting. The structured data format makes it easy to import records from existing case management systems or spreadsheets.
Opportunities for Improvement
Click here to Purchase the Law Firm Performance Dashboard in Google Sheets
While the dashboard covers the most important law firm analytics, you could extend it further by adding a Client Analysis page to segment billing by client type, a Time Tracking page for more granular billable hour analysis, or integration with Google Apps Script for automated data import from practice management software. Custom conditional formatting could also highlight overdue collections or cases approaching statute of limitations deadlines.
Best Practices
For the best results, update your case data weekly to maintain accurate KPIs and trend analysis. Use consistent naming conventions for Practice Area, Case Type, and Attorney names to ensure charts aggregate correctly. Share the dashboard with view-only access for stakeholders who only need to review metrics, and editor access for team members responsible for data entry. Archive completed cases periodically to keep the data sheet manageable while maintaining historical trend data.
Explore Relevant Templates
Law Firm Performance Dashboard in Excel — Same powerful law firm analytics built entirely in Excel with pivot tables and slicers for desktop users.
Law Firm Performance Dashboard in Power BI — Advanced law firm analytics with interactive Power BI visuals and DAX-driven measures for enterprise reporting.
Law Firm Performance Dashboard in HTML — Browser-based law firm analytics with zero software requirements and modern SaaS-style design.
Legal Dashboard in Google Sheets — Track general legal cases, costs, and lawyer performance in a cloud-based Google Sheets template.
Arbitration and Mediation Dashboard in Excel — Monitor dispute resolution cases, claim amounts, and settlement outcomes.
Frequently Asked Questions
Click here to Purchase the Law Firm Performance Dashboard in Google Sheets
What KPIs does the Law Firm Performance Dashboard in Google Sheets track?
The Law Firm Performance Dashboard in Google Sheets tracks 5 key performance indicators on the Overview page: Total Cases, Total Billed, Total Collected, Avg Hourly Rate, and Collection Rate. Additional analysis across 5 more pages covers case volume trends, practice area profitability, attorney performance rankings, and financial correlations.
Do I need advanced Google Sheets skills to use this dashboard?
No. Simply make a copy of the template to your Google Drive using the link in the PDF guide, replace the sample data with your own records, and all charts and KPIs update automatically. No formulas to edit, no scripts to run.
Can I share this dashboard with my entire legal team?
Yes. Since this is a Google Sheets template, you can share it with any number of team members. Multiple people can view and update the dashboard simultaneously in real time from any device with a browser and a Google account.
How many dashboard pages are included?
This template includes 6 interactive pages: Overview, Case Analysis, Financial, Attorney Performance, Search, and Data Sheet. Each page provides focused insights into a different aspect of law firm operations.
Is this the best Google Sheets dashboard for tracking law firm performance?
The Law Firm Performance Dashboard in Google Sheets from NextGen Templates is one of the most comprehensive cloud-based options available. It covers billing, collections, case analysis, attorney performance, financial trends, and case search across 6 interactive pages with dynamic filtering and real-time collaboration.
Is this template available in other platforms?
Yes. NextGenTemplates also offers the Law Firm Performance Dashboard in Excel, Power BI, and HTML formats. Visit nextgentemplates.com to explore all available versions.
Conclusion
The Law Firm Performance Dashboard in Google Sheets is the ideal analytics solution for law firms that want complete visibility into billing, collections, case outcomes, and attorney productivity without investing in expensive BI software. With 6 interactive pages, 5 core KPIs, dynamic charts, slicer filters, and cloud-based real-time collaboration, this template transforms how you monitor and manage your legal operations. Click here to Purchase the Law Firm Performance Dashboard in Google Sheets and start making data-driven decisions for your firm today.
Visit our YouTube channel for step-by-step video tutorials: Youtube.com/@NeoTechNavigators
Click here to Purchase the Law Firm Performance Dashboard in Google Sheets