The Public Health KPI Scorecard in Google Sheets tracks 10+ health performance indicators across 4 interactive worksheets with automated MTD/YTD calculations, traffic-light color coding, and trend analysis charts. According to WHO data, health departments that implement structured KPI monitoring see 15–25% faster response times to disease outbreaks and measurably improved program accountability.
For public health officers, hospital administrators, and NGO program managers who need to monitor vaccination coverage, disease incidence, patient outcomes, and operational efficiency — this Google Sheets scorecard provides a centralized, collaborative, and automated alternative to scattered spreadsheets and expensive BI platforms.
Key Features of the Public Health KPI Scorecard in Google Sheets
👉 Click here to Purchase the Public Health KPI Scorecard in Google Sheets
This Google Sheets KPI Scorecard includes 4 purpose-built worksheets that work together as an integrated performance monitoring system. The Scorecard sheet serves as the main dashboard, displaying all KPIs with dropdown menus for month selection and MTD/YTD toggling. Each metric shows Actual vs Target values with automatic conditional formatting that highlights strong, average, and underperforming areas.
The KPI Trend sheet provides deeper analysis — select any KPI from the dropdown on cell C3 to view its Group, Unit, Type (Upper the Better or Lower the Better), Formula, and Definition alongside MTD and YTD trend charts comparing Actual, Target, and Previous Year data. The Input Data sheet centralizes all data entry, while the KPI Definition sheet maintains standardized metric definitions across your organization.
The template tracks 10+ customizable public health KPIs including vaccination coverage rate, disease incidence per 100,000 population, maternal mortality ratio, patient satisfaction score, bed occupancy rate, and average length of stay. All formulas are pre-built — no coding, no Apps Script, no macros required.
Dashboard Pages Explanation
1. Scorecard Sheet (Main Dashboard)
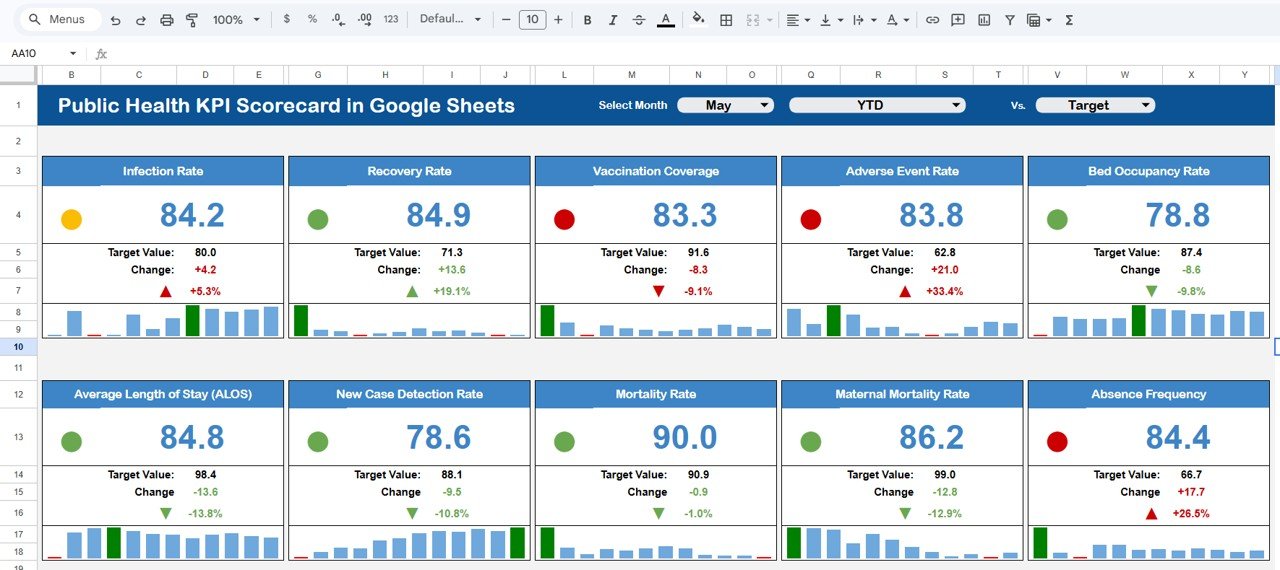
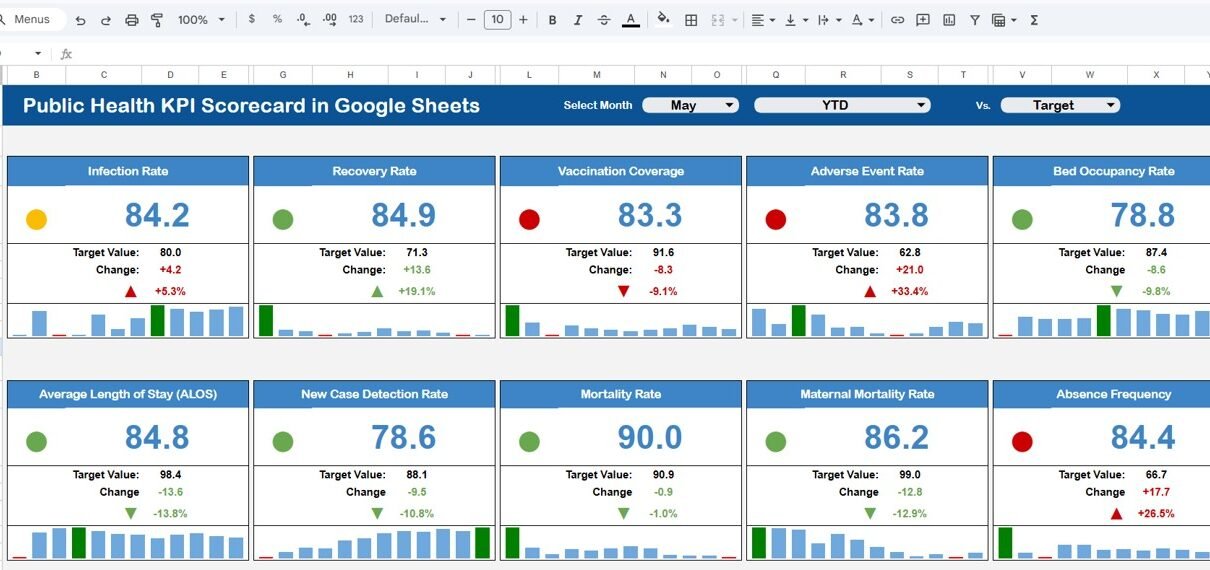
Public Health KPI Scorecard in Google Sheets
The Scorecard sheet is the main interface where you view KPI performance at a glance. Dropdown menus let you select the reporting month and switch between MTD and YTD views. Actual vs Target values appear for every KPI with color-coded conditional formatting — green for on-track, yellow for at-risk, and red for below-target. This consolidated view eliminates the need to navigate multiple reports or compile data manually.
2. KPI Trend Sheet
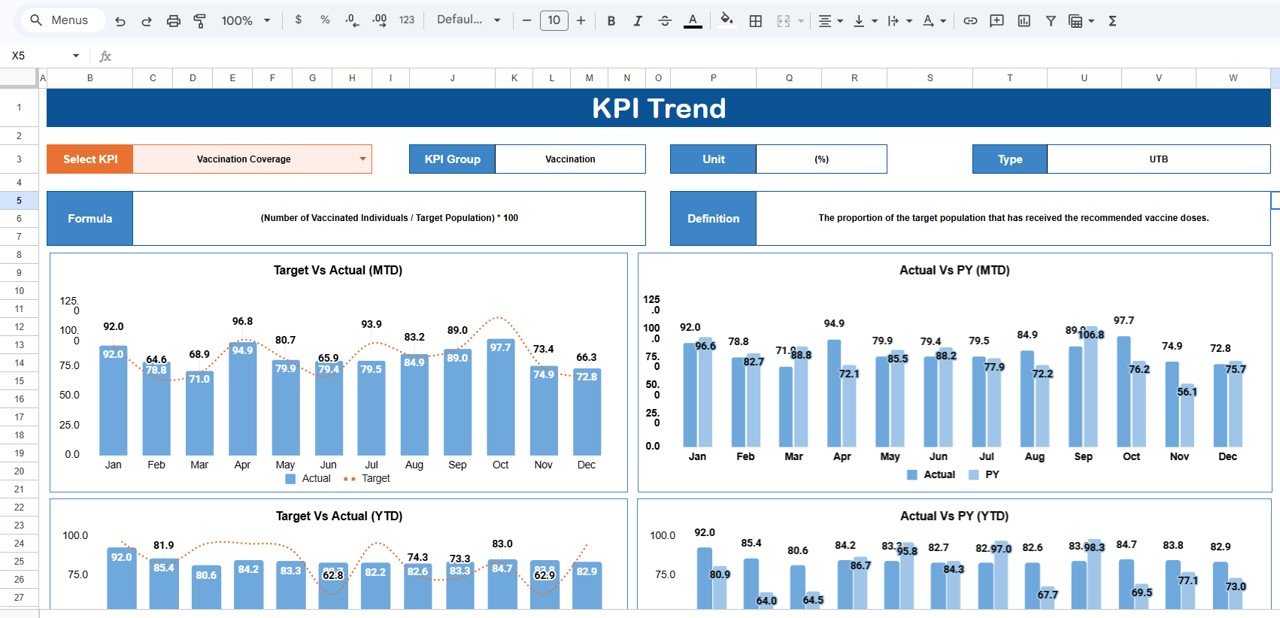
KPI Trend Sheet
Select any KPI name from the dropdown available on cell C3. The sheet displays KPI Group, Unit, Type (Lower the Better or Upper the Better), Formula, and Definition. Below, MTD and YTD trend charts plot Actual, Target, and Previous Year numbers — letting you identify seasonal patterns, track improvement trajectories, and spot declining performance before it becomes critical.
3. Input Data Sheet
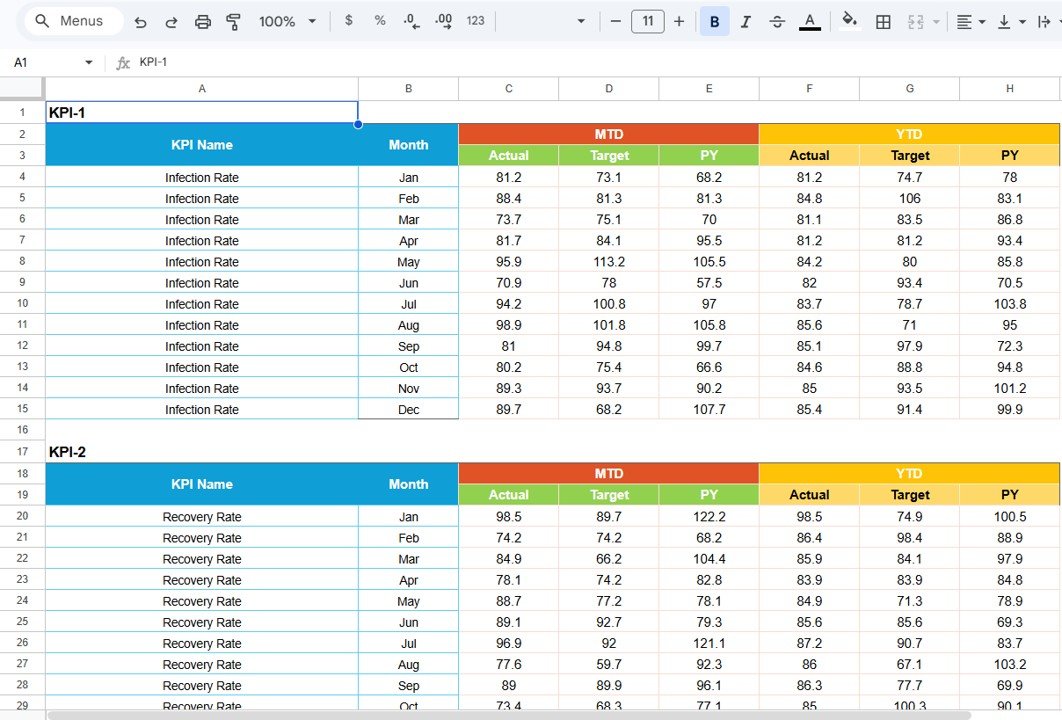
Input Data Sheet
The Input Data sheet is your central data repository. Record actual values, targets, and previous year metrics for each KPI on a monthly basis. As new results become available, simply update the relevant cells — the entire scorecard, including charts and traffic-light indicators, refreshes automatically.
4. KPI Definition Sheet
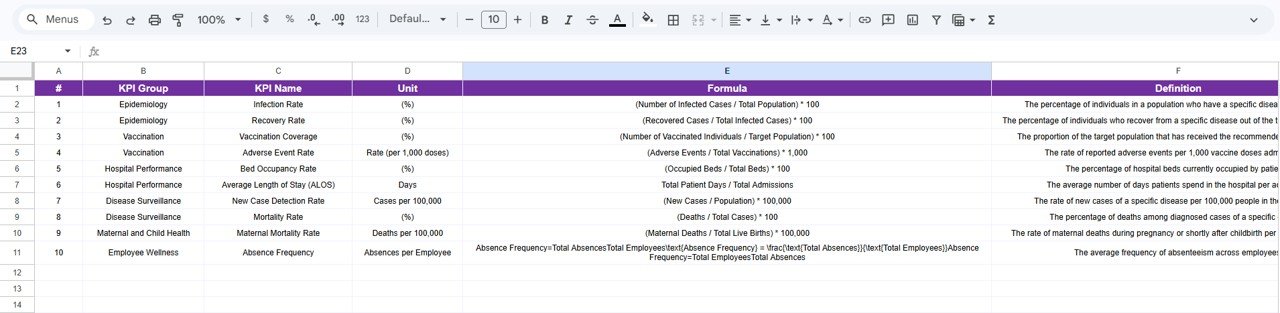
KPI Definition Sheet
Enter the KPI Name, KPI Group, Unit, Formula, and KPI Definition in this reference sheet. It ensures every team member, department head, and external stakeholder interprets each metric the same way — eliminating ambiguity and improving accountability across your health programs.
Public Health KPI Scorecard in Google Sheets vs. Excel Scorecard vs. Paid Health SaaS — Feature Comparison
| Feature | Public Health KPI Scorecard in Google Sheets | Excel KPI Scorecard | Athenahealth / Kareo |
|---|---|---|---|
| Cost | $8.99 one-time | $12.99 one-time | $25–150 / user / month |
| Platform | Google Sheets (browser) | Microsoft Excel (desktop) | Cloud SaaS |
| Setup Time | Under 10 minutes | Under 10 minutes | Days to weeks |
| Real-Time Collaboration | ✅ Built-in | Requires OneDrive/SharePoint | ✅ Yes |
| Mobile Access | ✅ Any device with browser | Requires Excel mobile app | ✅ Mobile app |
| Customizable KPIs | ✅ Fully editable | ✅ Fully editable | Limited to plan tier |
| Share with Link | ✅ One-click sharing | Requires file transfer | Requires user license |
| Year-1 Cost (5 users) | $8.99 total | $12.99 total | $1,500–$9,000+ |
For health departments that want structured KPI tracking without paying monthly SaaS subscriptions, the Public Health KPI Scorecard in Google Sheets delivers the same visual reporting at a fraction of the cost.
Who Should Use This Template
✅ Perfect for:
- Public health officers and epidemiologists at district, state, or national health departments
- Hospital administrators and clinic managers tracking patient care and operational KPIs
- NGOs and nonprofits monitoring vaccination drives, disease prevention, and community health outcomes
- WHO field coordinators and government health program managers needing standardized KPI reporting
❌ Not a fit if:
- You need HIPAA-compliant EHR integration with real-time patient data feeds from lab systems
- Your organization requires automated data import from IoT medical devices or electronic health record systems
Real-World Use Cases
Dr. Meera manages a district health department serving 200,000 residents. She uses the Public Health KPI Scorecard in Google Sheets to track monthly vaccination coverage, disease incidence per 100,000 population, and maternal health indicators. Instead of compiling data from 15 sub-centers into manual reports, she shares one scorecard link with all PHC officers who update their numbers directly — saving 8+ hours per month on reporting.
James coordinates a USAID-funded malaria prevention program across 3 African countries. He tracks bed-net distribution rates, treatment completion percentages, and community health worker visit frequency. The YTD trend charts help him prepare quarterly donor reports showing program trajectory against targets — without hiring a data analyst.
Sarah leads quality improvement at a 120-bed rural hospital. She monitors patient satisfaction scores, average length of stay, readmission rates, and infection control compliance. The traffic-light indicators help her board of directors quickly identify which departments need intervention during monthly reviews.
Advantages of the Public Health KPI Scorecard in Google Sheets
👉 Click here to Purchase the Public Health KPI Scorecard in Google Sheets
The scorecard eliminates 3 common problems in public health reporting: data fragmentation across multiple spreadsheets, inconsistent KPI definitions between departments, and delayed performance visibility. With all metrics in one shared Google Sheet, every stakeholder sees the same numbers simultaneously. The automated MTD/YTD calculations save 5–10 hours per month compared to manual Excel reporting, and the cloud-based access means field officers can update data from mobile devices in remote areas.
The $8.99 one-time cost replaces what would be $1,500–$9,000 per year in SaaS subscriptions for 5 users. For budget-constrained health departments and NGOs, this represents a 99% cost reduction while maintaining the same visual KPI monitoring capabilities.
Opportunities for Improvement
The scorecard does not include automated data import from electronic health record (EHR) systems or laboratory information management systems (LIMS). Organizations with 50+ KPIs may find the single-page scorecard layout becoming dense — in such cases, splitting into department-specific scorecards is recommended. The template uses Google Sheets formulas rather than Google Apps Script, which means conditional formatting logic is cell-based rather than programmatic.
Best Practices
Start by defining 10–15 KPIs that directly align with your health program objectives — avoid tracking vanity metrics. Update data monthly on a fixed schedule (e.g., by the 5th of each month) to maintain consistency. Use the KPI Definition sheet to document each metric before sharing the scorecard with stakeholders — this prevents interpretation conflicts. Review both MTD and YTD views in monthly meetings to balance short-term performance with long-term trends. Protect formula cells using Google Sheets’ protected ranges feature to prevent accidental edits. Archive a copy at year-end for historical comparison.
Explore Relevant Templates
🔹 Public Health KPI Scorecard in Excel — The same public health scorecard with identical 4-sheet structure built for Microsoft Excel users.
🔹 Telecommunications KPI Scorecard in Google Sheets — Track telecom operations KPIs with the same scorecard framework.
🔹 Water Supply KPI Scorecard in Excel — Monitor water production, quality compliance, and distribution efficiency.
🔹 Social Services KPI Scorecard in Excel — Track NGO and social welfare program outcomes with MTD/YTD analysis.
🔹 Browse all Google Sheets KPI Scorecards for templates across 50+ industries and departments.
Frequently Asked Questions
👉 Click here to Purchase the Public Health KPI Scorecard in Google Sheets
What KPIs does the Public Health KPI Scorecard in Google Sheets track?
The Public Health KPI Scorecard in Google Sheets tracks 10+ customizable health indicators including vaccination coverage rate, disease incidence rate, maternal mortality ratio, patient satisfaction score, bed occupancy rate, average length of stay, and more. All KPIs are fully editable to match your department’s priorities.
How long does setup take?
Setup takes under 10 minutes. Click the Google Sheets copy link from the PDF guide, enter your KPI definitions and monthly data, and the entire scorecard populates automatically with charts, indicators, and calculations.
Can multiple team members use this scorecard simultaneously?
Yes. Google Sheets supports real-time collaboration. Multiple users can view and edit the scorecard at the same time using Google’s built-in sharing controls at no additional cost.
How does this compare to Athenahealth or Kareo?
The Public Health KPI Scorecard in Google Sheets costs $8.99 one-time compared to $25–150 per user per month for SaaS platforms like Athenahealth. For departments that need KPI monitoring without EHR integration, this scorecard delivers equivalent visual reporting at 99% lower cost.
Does this work on mobile devices?
Yes. Google Sheets runs on any device with a web browser, including smartphones and tablets via the Google Sheets mobile app. Field officers can update data from remote health centers.
Can I customize the KPIs for my specific health program?
Absolutely. The KPI Definition sheet lets you add, remove, or modify any KPI with name, group, unit, formula, and definition. The scorecard adapts automatically to your changes.
Is there an Excel version available?
Yes. The Public Health KPI Scorecard in Excel offers the same 4-sheet structure with automated calculations for users who prefer Microsoft Excel over Google Sheets.
About the Author
Built by PK — Microsoft Certified Professional with 15+ years of Excel, Google Sheets, and Power BI experience. Founder of NextGenTemplates, reaching 300K+ subscribers across YouTube channels. Every template is hand-built and tested before release.
Conclusion
The Public Health KPI Scorecard in Google Sheets gives health departments, hospitals, and NGOs a structured, automated, and collaborative way to monitor performance across all key health indicators. With 4 interactive worksheets, traffic-light indicators, and MTD/YTD trend analysis — your team can move from scattered data to actionable insights in under 10 minutes.
👉 Click here to Purchase the Public Health KPI Scorecard in Google Sheets
✅ Instant download · One-time payment · No subscription
🎥 Visit our YouTube channel: Youtube.com/@NeoTechNavigators