Healthcare Insurance KPI Scorecard In Google Sheets
Healthcare insurance teams manage a wide range of operational, financial, service, and quality metrics. Claims performance, denial rates, cost ratios, member satisfaction, service turnaround time, compliance measures, and provider network indicators all need consistent review. When these numbers sit across different files or manual reports, it becomes difficult to see what is improving and what needs action.
In this article we have created Healthcare Insurance KPI Scorecard In Google Sheets. This is a ready to use Scorecard template for insurance operations teams, analysts, managers, consultants, and healthcare performance leaders who want a simple way to track KPI performance in Google Sheets.
The template is designed to help you review MTD and YTD performance, compare actual values against targets, study KPI trends, and maintain clear KPI definitions. Because it is built in Google Sheets, it can be copied into your Google Drive, edited as needed, and shared with your team using familiar spreadsheet controls. For general help with sharing and editing Google files, you can also refer to the Google Docs Editors Help center.
Click here to purchase: Healthcare Insurance KPI Scorecard In Google Sheets.
Why Healthcare Insurance KPI Tracking Matters
Healthcare insurance performance is not measured by one metric alone. A team may need to understand claim processing speed, approval rate, denial rate, appeal turnaround time, member service quality, cost per claim, provider dispute resolution, retention, and utilization patterns. Each metric tells part of the story, but the real value comes from reviewing them together in a consistent scorecard.
A structured scorecard helps leaders identify weak spots before they become larger problems. For example, a rising denial rate may point to documentation issues, provider billing problems, or policy interpretation gaps. A longer claim turnaround time may affect member satisfaction and operational cost. A lower customer satisfaction score may indicate service issues that need investigation. With a scorecard, these signals are easier to review during monthly performance meetings.
Key Features Of This KPI Scorecard
Below are the key features of this KPI Scorecard:
- Ready-to-use Google Sheets structure: Start with a working scorecard instead of building one from scratch.
- MTD and YTD tracking: Review Month-to-Date and Year-to-Date performance from the main scorecard.
- Actual vs target comparison: Compare each KPI against planned targets and spot performance gaps quickly.
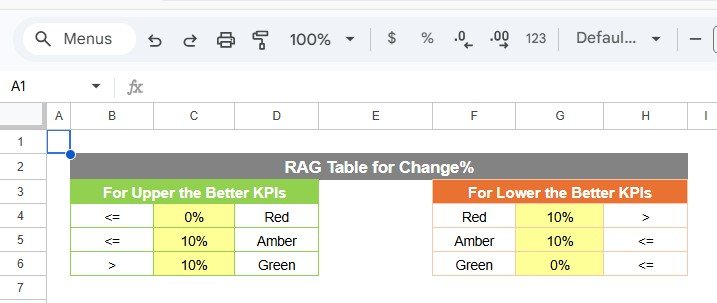
- Visual indicators: Use color-coded status cues and conditional formatting to understand KPI status at a glance.
- KPI trend view: Select a KPI and review trend charts for Actual, Target, and PY values.
- Input data sheet: Enter monthly actuals, targets, and prior-year numbers in one structured place.
- KPI definition sheet: Maintain KPI names, groups, units, formulas, types, and definitions for consistent reporting.
- Editable template: Customize the KPI list, definitions, formulas, and reporting structure to match your organization.
What Is Included In The Template?
In this template, we have 4 worksheets:
- Scorecard Sheet
- KPI Trend Sheet
- Input Data Sheet
- KPI Definition Sheet
Each sheet has a specific role, so the file remains practical for both data entry and management review.
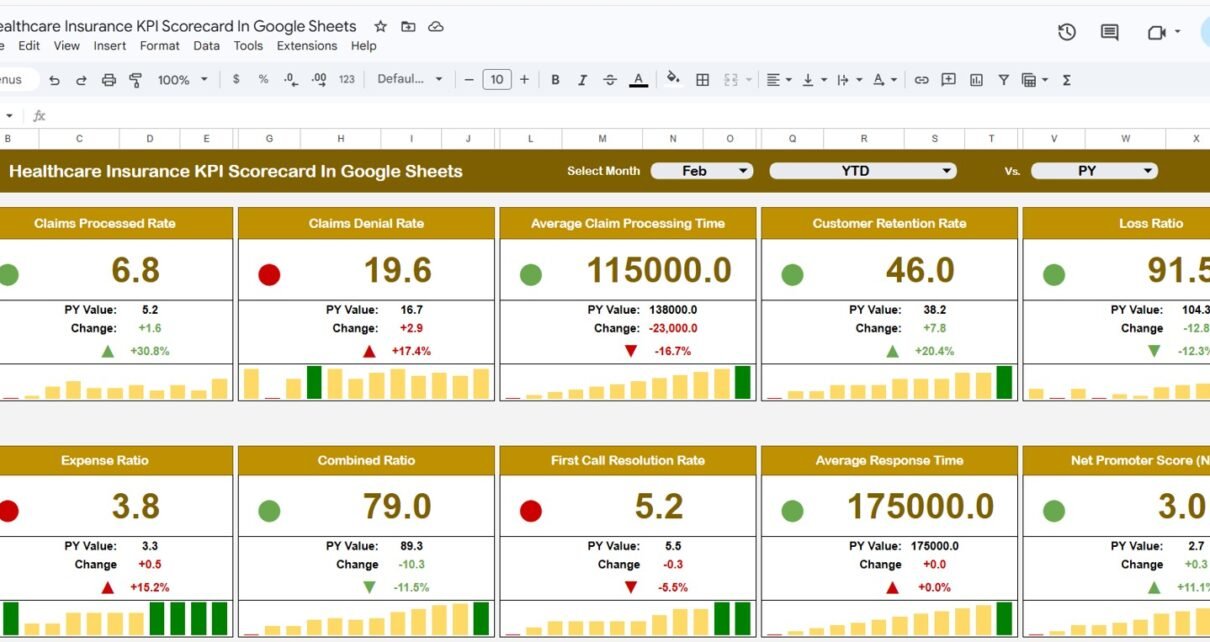
1. Scorecard Sheet
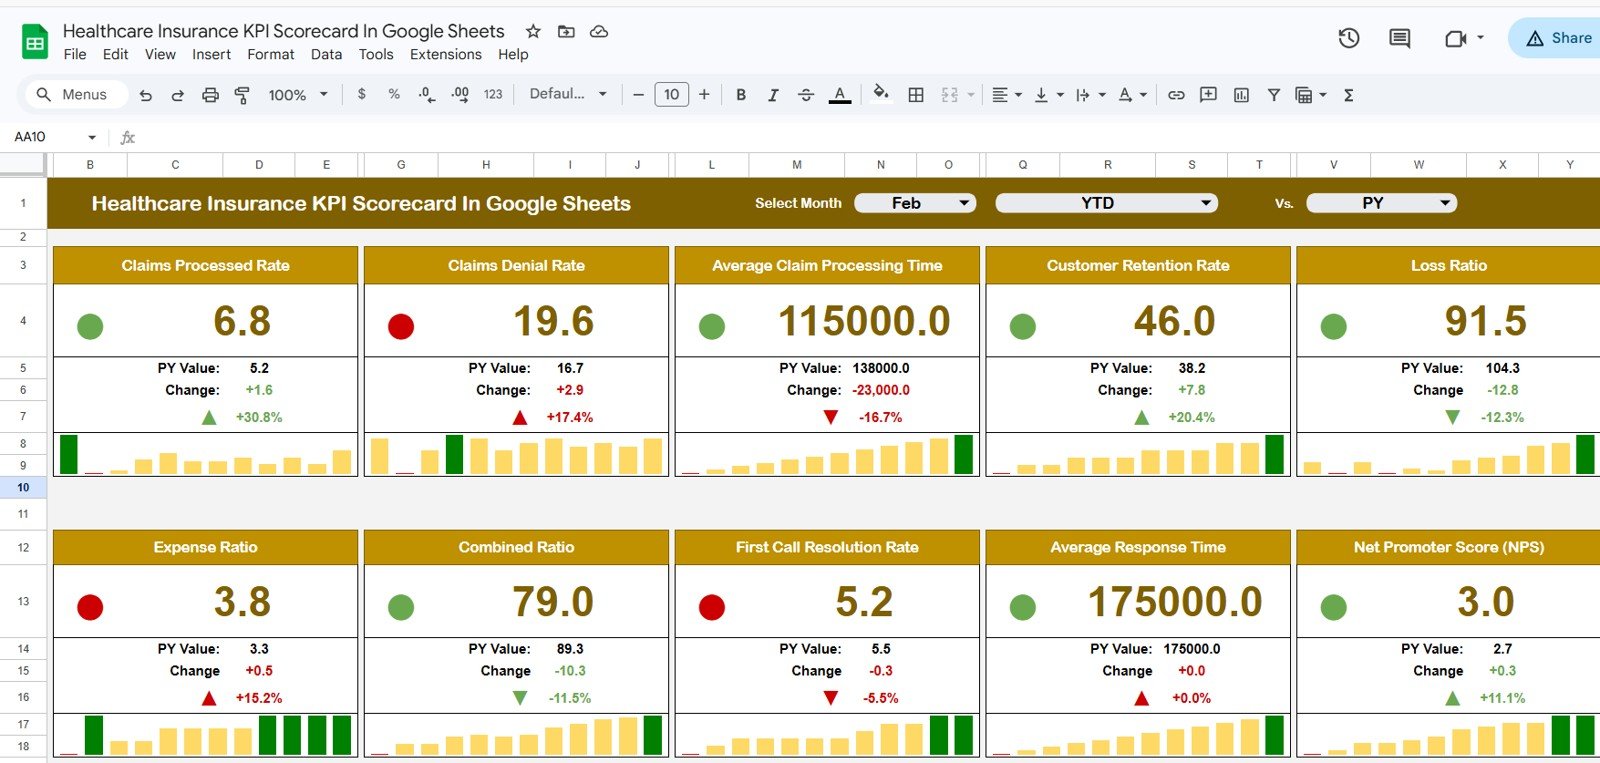
The Scorecard sheet is the main interface where you can view KPI performance. It is designed for quick review, so managers and analysts can see the current status without digging through raw data.
Key features include:Healthcare Insurance KPI Scorecard In Google Sheets
- Dropdown Menus: Select the month, MTD, or YTD for performance analysis.
- Actual vs Target Values: Compare actual performance against targets for each KPI.
- Visual Indicators: Quickly see performance status using color-coded visuals or conditional formatting.
- Comprehensive KPI Overview: Display all relevant information about KPIs, including MTD and YTD comparisons.
This sheet can support monthly business reviews, department meetings, claims operations reporting, member services discussions, and executive updates. Instead of reading line-by-line spreadsheet data, users can focus on performance status, target variance, and action areas.Healthcare Insurance KPI Scorecard In Google Sheets
2. KPI Trend Sheet Tab
Here you can select the KPI name from the drop down available on range C3. We have displayed the KPI Group, Unit of KPI, Type of KPI, Formula of the KPI and Definition of the KPI.
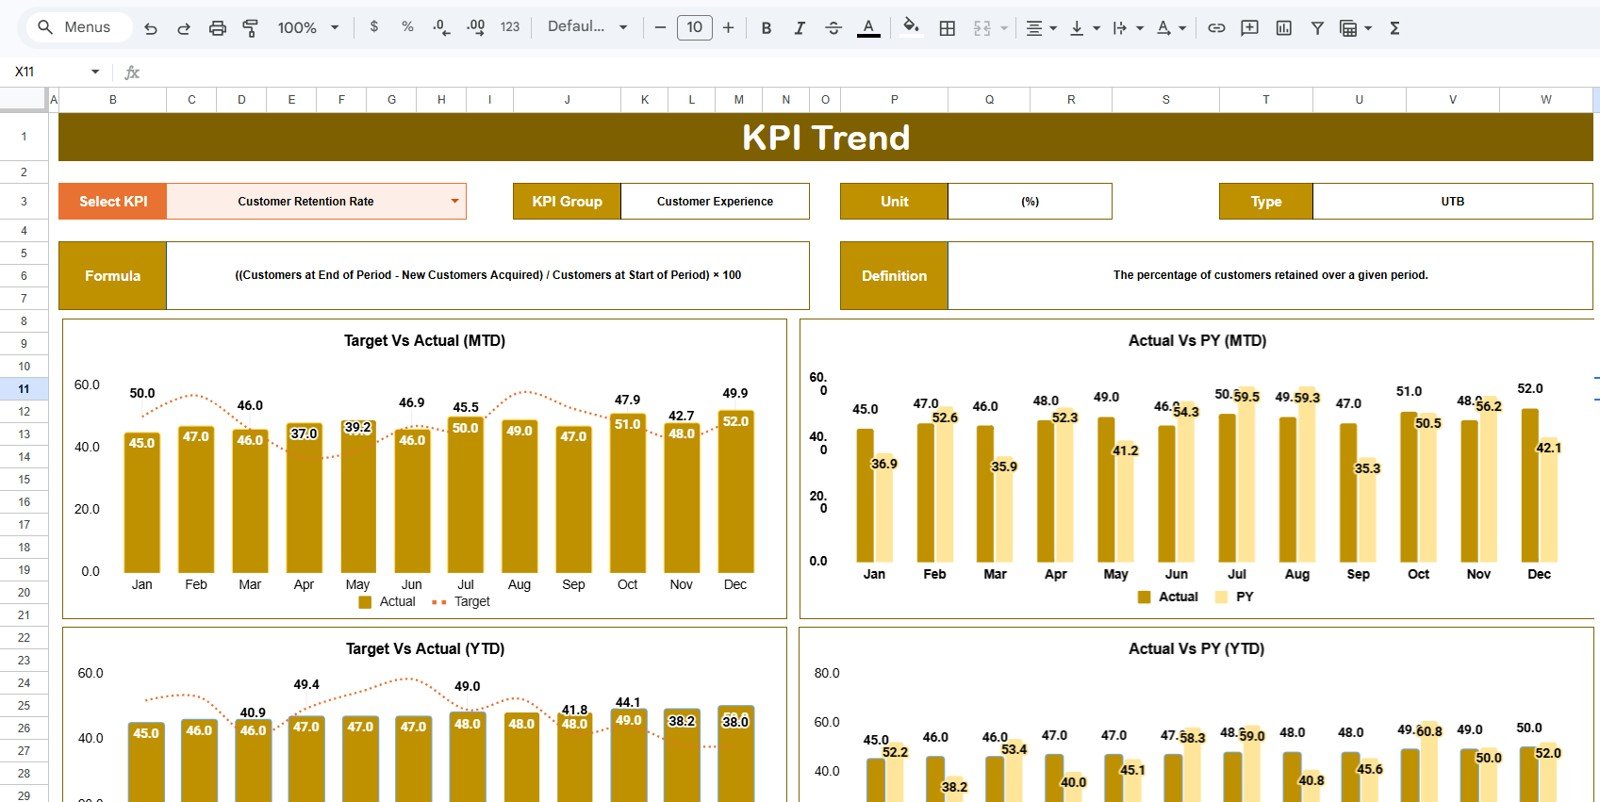
We are also showing the MTD and YTD trend chart for Actual, Target and PY numbers. This is useful when you want to understand whether a KPI is improving, declining, or simply moving through a normal seasonal pattern.
For example, if claim turnaround time is above target for the current month, the trend sheet can help you review whether this is a one-month issue or a longer pattern. If member complaint rate is improving but still above target, the trend chart gives context for the conversation. The trend sheet is especially helpful when leaders need more than a single current-month number.
3. Input Data Sheet
The Input Data sheet is where you enter all KPI data.
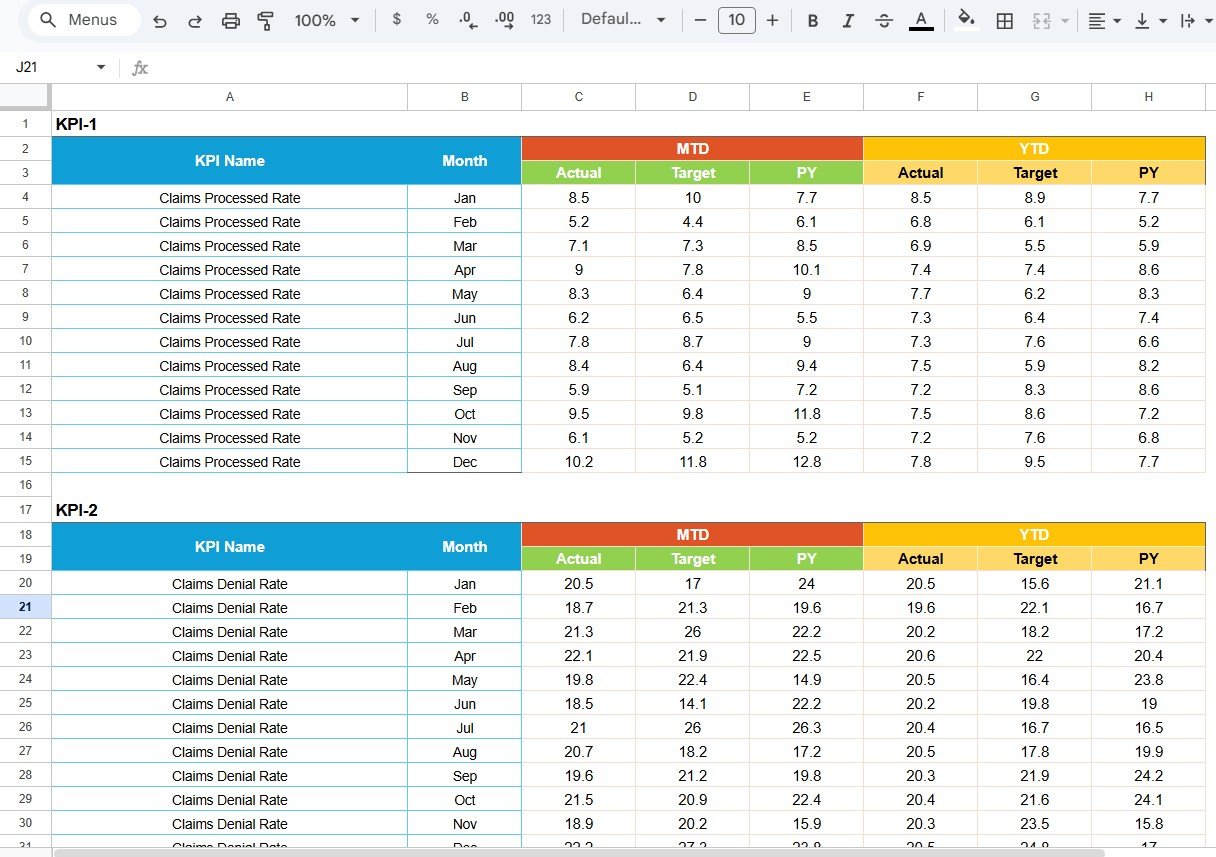
- Data Entry: Record actual values, targets, prior-year values, and other KPI metrics.
- Flexibility: Easily update data as new results become available, ensuring the scorecard remains current.
- Monthly Tracking: Maintain a clean reporting history across months.
- Reliable Reporting: Keep the data structure consistent so the scorecard and trend views continue to work correctly.
For best results, assign one reporting owner to maintain this sheet. This helps reduce version issues and keeps the monthly reporting process organized. Teams can also protect formula areas or keep a backup copy before making major customization changes.
4. KPI Definition Sheet Tab
In this sheet tab, you have to enter the KPI Name, KPI Group, Unit, Formula and KPI definition.
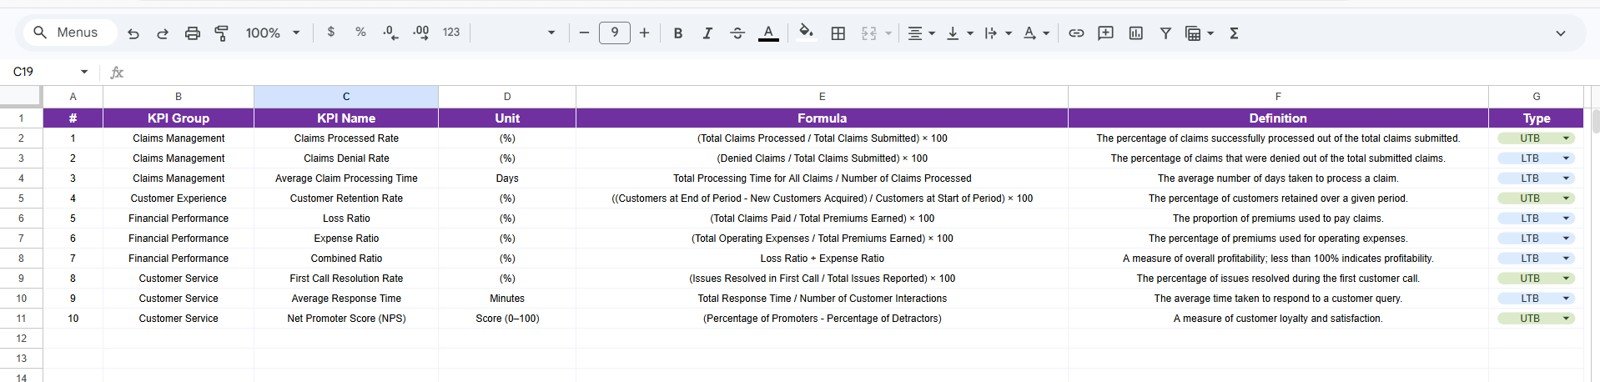
The KPI Definition sheet is important because healthcare insurance KPIs can be interpreted differently across teams. One department may define claim approval rate in one way, while another may use a slightly different denominator. One team may treat appeals turnaround time as calendar days, while another uses business days. Documenting definitions reduces confusion and supports better reporting discipline.
This sheet also supports KPI grouping. You can group KPIs by claims, member services, finance, provider network, compliance, quality, operations, or any other structure that fits your organization.
Example Healthcare Insurance KPIs You Can Track
The template can be customized for many healthcare insurance metrics, including:
- Claims processed
- Average claim turnaround time
- Claim approval rate
- Claim denial rate
- Appeal resolution time
- Cost per claim
- Medical loss ratio
- Member satisfaction score
- Complaint resolution time
- Call abandonment rate
- Provider dispute turnaround time
- Member retention rate
- Policy renewal rate
- Utilization review completion rate
You can use the scorecard with the existing KPI structure or adapt it to match your internal reporting process.
Google Sheets Scorecard Vs Manual Spreadsheet Vs BI Tool
| Option | Best For | Advantages | Limitations |
|---|---|---|---|
| Google Sheets KPI Scorecard | Teams that need a simple, shareable, low-cost KPI reporting file | Fast setup, cloud access, editable structure, easy collaboration | Manual data updates unless connected to automation |
| Manual Spreadsheet From Scratch | Teams with time to build their own reporting structure | Fully flexible and custom | Takes longer to design, test, format, and maintain |
| BI or SaaS Reporting Tool | Large organizations with system integrations and enterprise needs | Automation, permissions, advanced reporting, database connections | Higher cost, longer implementation, less flexible for quick edits |
Who Should Use This Template?
- Healthcare insurance operations managers
- Claims processing teams
- Member service and customer experience teams
- Insurance analysts and reporting specialists
- Healthcare consultants
- Provider network managers
- Compliance and quality improvement teams
- Small and mid-sized insurance teams that prefer Google Sheets
Real-World Use Cases
A claims manager can use the scorecard to review claim volume, turnaround time, approval rate, denial rate, and backlog. A member services team can track complaint resolution, call response, satisfaction, and retention. A finance team can review cost per claim, medical loss ratio, and budget-related KPIs. A quality team can track compliance, dispute resolution, and process reliability.
The template can also be useful for consultants. If you build performance reports for healthcare insurance clients, this scorecard gives you a professional starting point that can be customized for each engagement.
Template Preview
The template is built to be practical rather than complicated. The main scorecard supports management review, the trend page supports deeper analysis, the input sheet keeps the data organized, and the definition sheet keeps reporting logic documented.
Best Practices For Using The Scorecard
- Update the input data on a fixed monthly schedule.
- Assign one owner for KPI definitions and formula changes.
- Use the trend sheet before making decisions from one month of data.
- Review off-target KPIs during management meetings.
- Keep KPI names short and definitions clear.
- Create a backup copy before large customization changes.
- Use MTD and YTD views together for a balanced performance review.
Explore Related Templates
If you are building a broader healthcare reporting system, these related templates may also help:
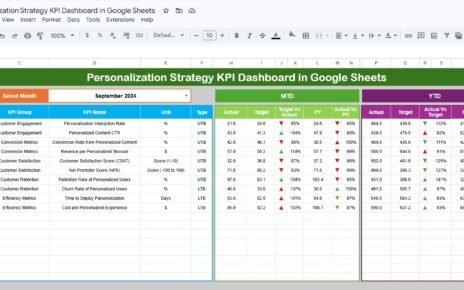
- Healthcare Insurance KPI Dashboard in Google Sheets
- Underwriting Efficiency KPI Dashboard in Google Sheets
- Medical Practice Dashboard in Google Sheets
- Telehealth KPI Scorecard in Google Sheets
You can also read our related article on the Healthcare Insurance KPI Dashboard in Google Sheets and the Telehealth KPI Scorecard in Google Sheets.
Frequently Asked Questions
Is this Healthcare Insurance KPI Scorecard ready to use?
Yes. The scorecard is designed as a ready-to-use Google Sheets template. You can update the input data and customize KPI definitions based on your reporting needs.
Can I change the KPI names and formulas?
Yes. The KPI Definition sheet allows you to edit KPI names, groups, units, formulas, KPI types, and definitions.
Does the template support MTD and YTD tracking?
Yes. The scorecard supports Month-to-Date and Year-to-Date views, with actual vs target comparisons.
Can this be used outside healthcare insurance?
The template is designed for healthcare insurance, but you can adapt the KPI definitions and input data structure for other insurance or healthcare reporting use cases.
Do I need advanced Google Sheets skills?
No. Basic spreadsheet editing is enough for normal use. Advanced users can customize formulas, charts, and formatting further.
About The Creator
Built by PK – Microsoft Certified Professional with 15+ years of Excel, Google Sheets, and Power BI experience. Founder of NextGenTemplates, reaching 300K+ subscribers across YouTube channels. Every template is hand-built and tested before release.
Conclusion
The Healthcare Insurance KPI Scorecard In Google Sheets gives healthcare insurance teams a practical way to track KPI performance, compare actuals against targets, review MTD and YTD results, and study KPI trends. With 4 worksheets covering the scorecard, KPI trend view, input data, and KPI definitions, the file provides a clean structure for ongoing performance reporting.
Instead of building a scorecard from the beginning, you can start with a ready-to-use template and customize it for your organization. Visit the product page here: Healthcare Insurance KPI Scorecard In Google Sheets.