Marinas juggle a surprising amount of data — slip bookings, berth occupancy, vessel types, membership tiers, and two separate revenue streams from slips and add-on services. The Marina Management Dashboard in Google Sheets pulls all of it into one shareable workbook: 4 headline KPIs, 16 charts across 4 analysis tabs, a Search tab, and a single Data tab you edit. Everything updates automatically the moment you add a booking row.
This guide walks through every tab of the Marina Management Dashboard in Google Sheets, how it compares to Excel and marina SaaS, who it suits, and how to get the most from it. Because it runs entirely in Google Sheets, you can share a live link with dock staff, accountants, or board members on any device — no software to install and no monthly subscription.
Key Features of the Marina Management Dashboard in Google Sheets
- 4 KPI cards — Total Revenue, Total Bookings, Active Berths, and Average Stay (Nights) sit at the top of the Overview tab and recalculate instantly.
- 16 pre-built charts across Overview, Revenue, Vessels & Berths, and Membership tabs — four charts on each page.
- Slicer-style filtering by vessel type, dock, membership, slip type, and status so you can isolate any segment in seconds.
- A built-in Search tab that returns every detail of any Booking ID from a single dropdown.
- One Data tab to edit — paste your bookings and the whole dashboard refreshes with no formulas to break.
The dashboard ships with sample marina data, so every chart and KPI is fully populated before you plug in your own bookings.
Dashboard Tabs Explained
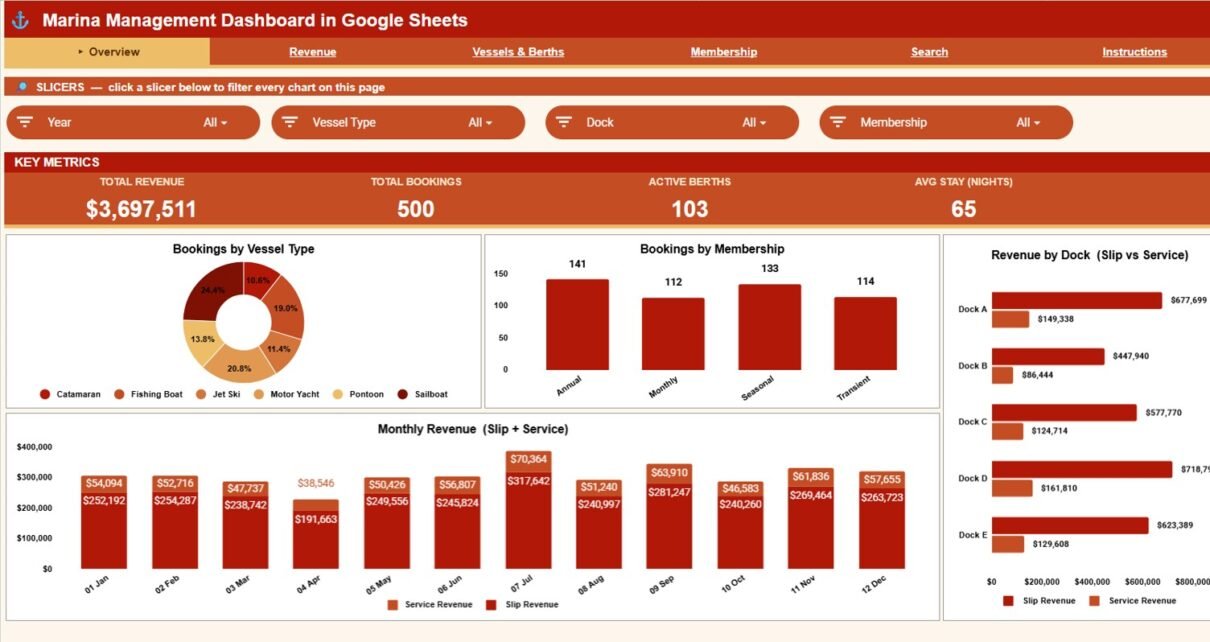
Overview Page
The Overview tab gives a high-level snapshot of the whole marina. Four KPI cards show Total Revenue, Total Bookings, Active Berths, and Average Stay (Nights), with slicers above to filter the page. The four charts are Bookings by Vessel Type, Bookings by Membership, Revenue by Dock, and Monthly Revenue — together they show your booking mix, member split, top-earning docks, and seasonal revenue cycle at a glance.
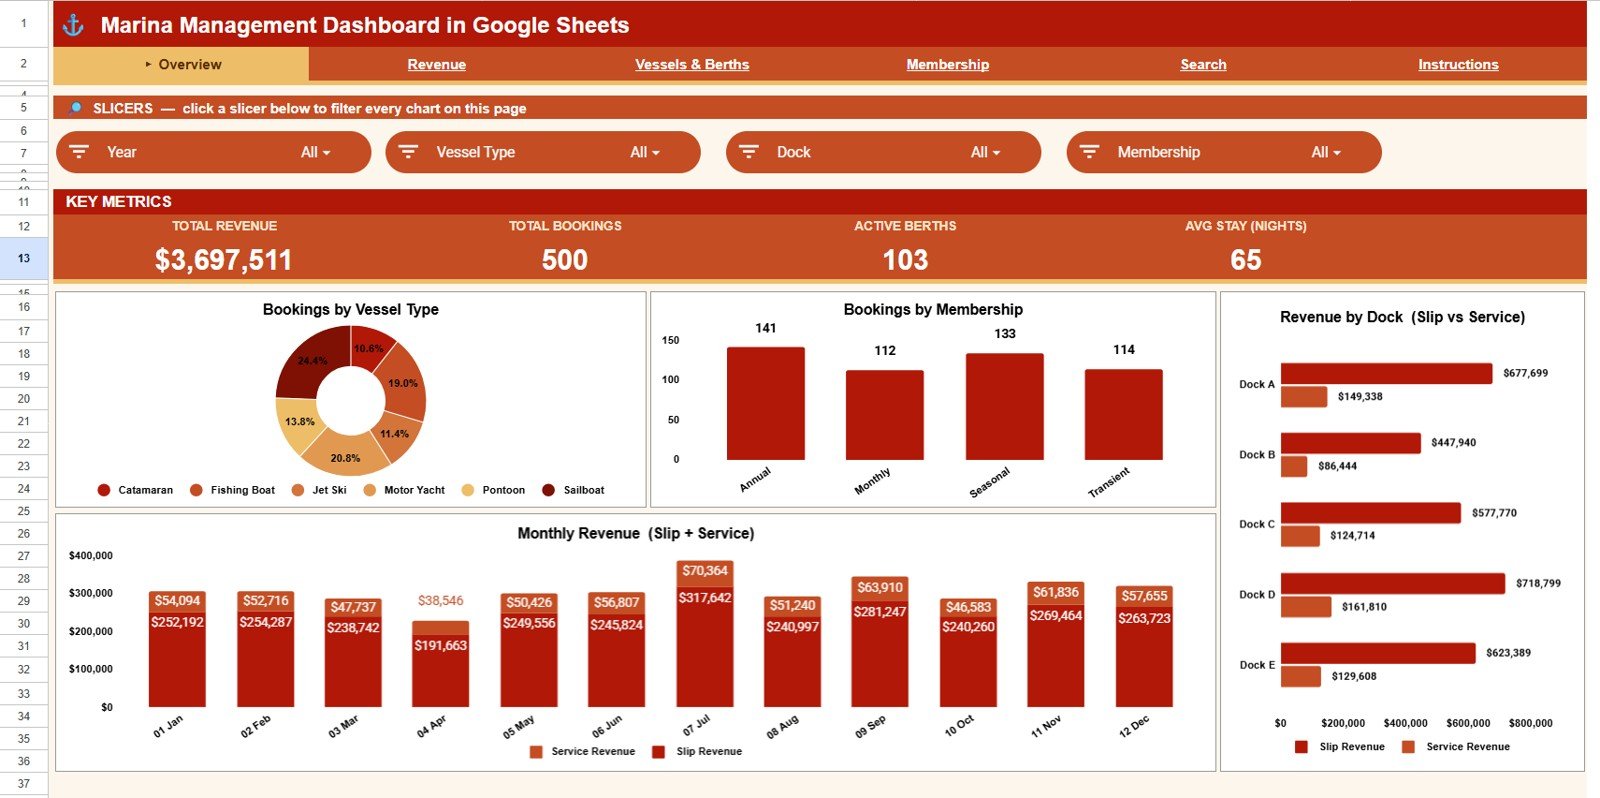
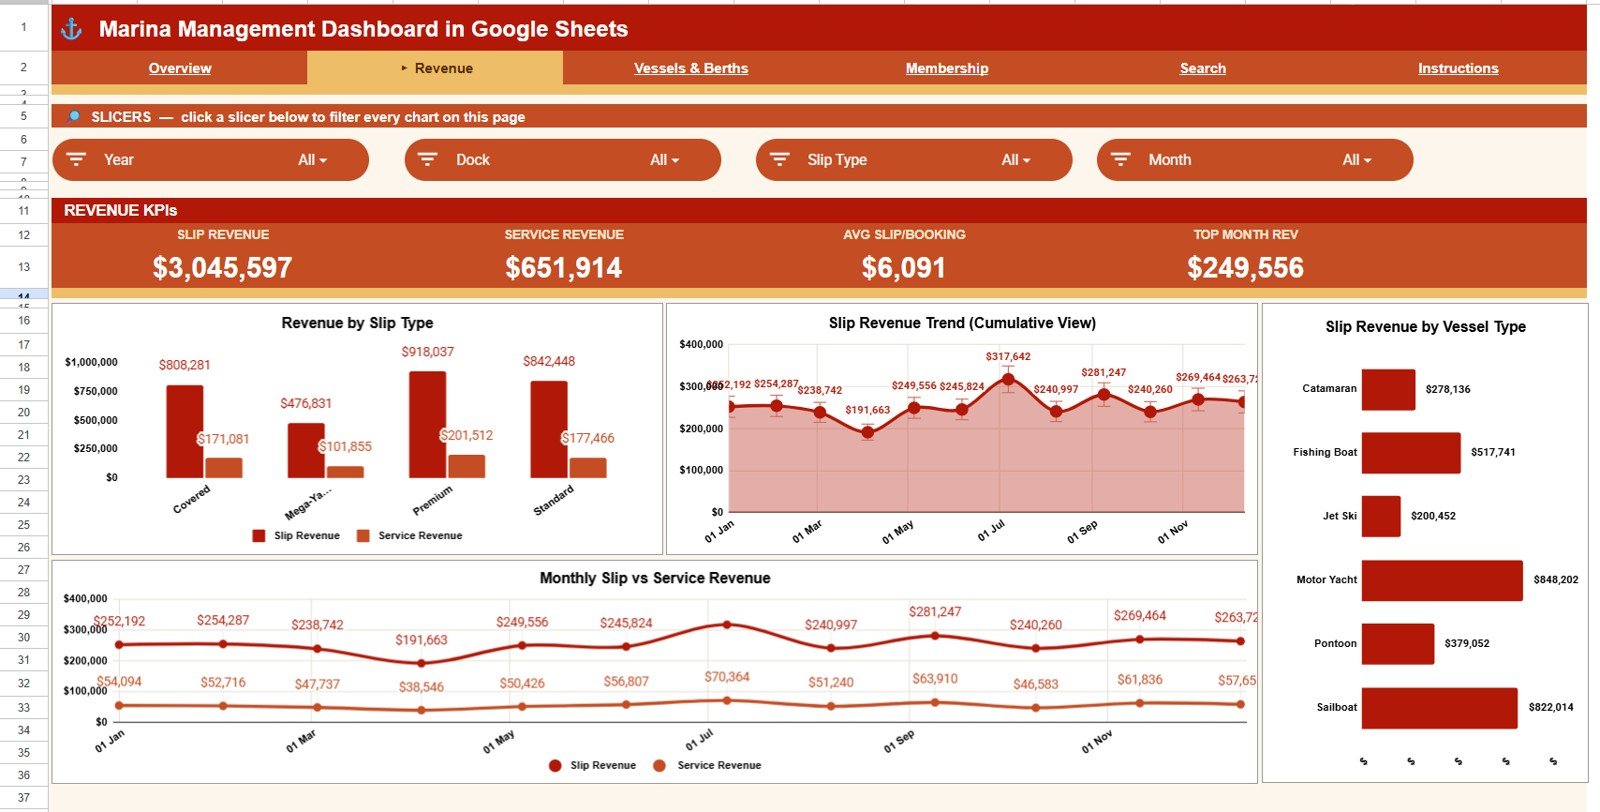
Revenue
The Revenue tab breaks down where the money comes from. Revenue by Slip Type compares earnings across slip categories; Slip Revenue Trend by Month tracks slip income across the season; Slip Revenue by Vessel Type shows which vessel classes drive slip earnings; and Slip vs Service Revenue by Month separates berth income from add-on service income so you can read your true revenue mix month by month.
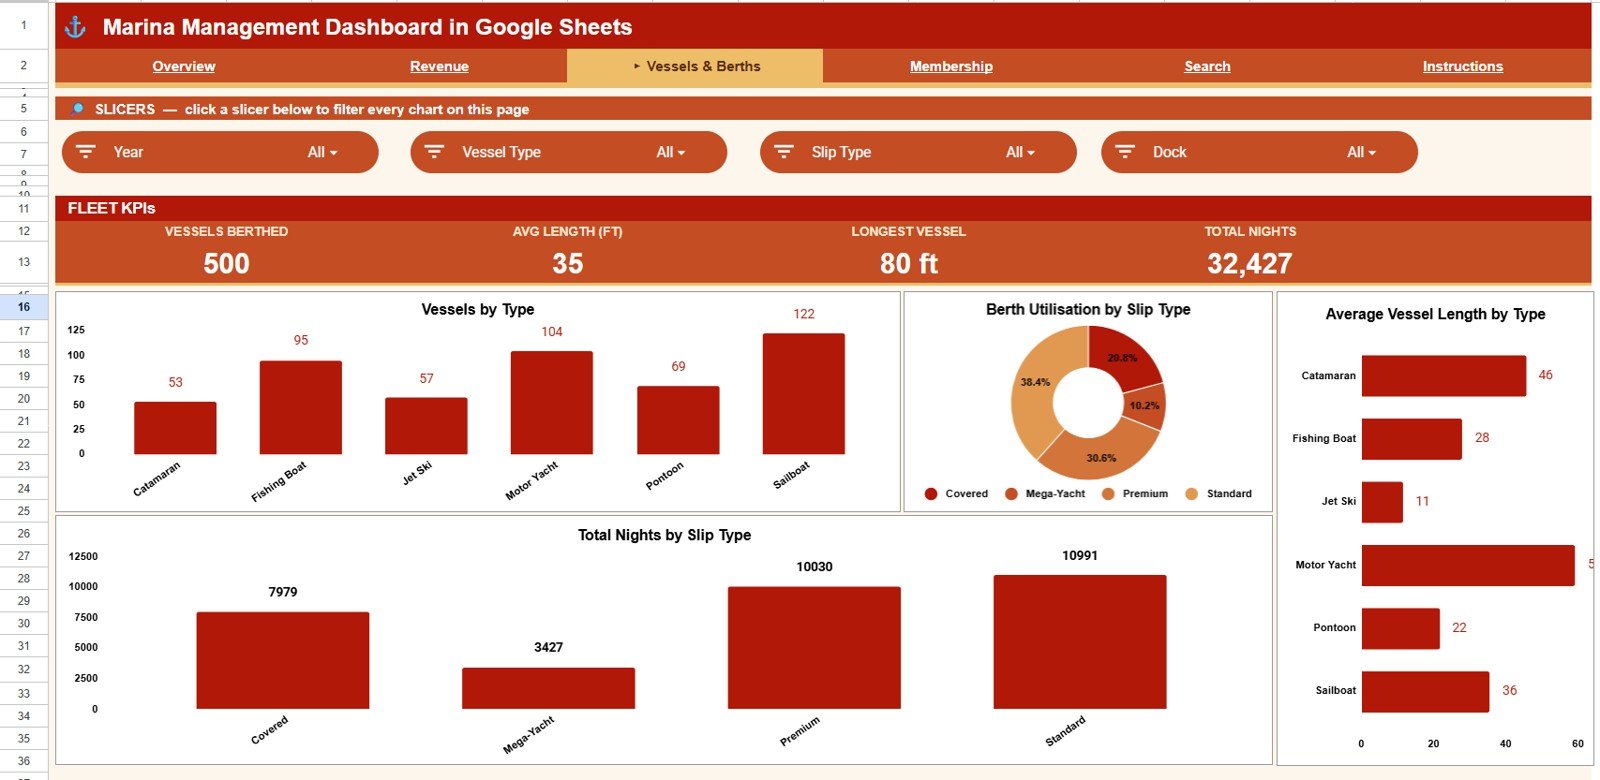
Vessels & Berths
The Vessels & Berths tab profiles the fleet and dock capacity. Vessels by Type shows the composition of boats; Berth Utilisation by Slip Type reveals which slip categories run at capacity; Average Vessel Length by Type compares boat sizes; and Total Nights by Slip Type measures how long vessels stay in each category — useful for capacity planning and slip-rate decisions.
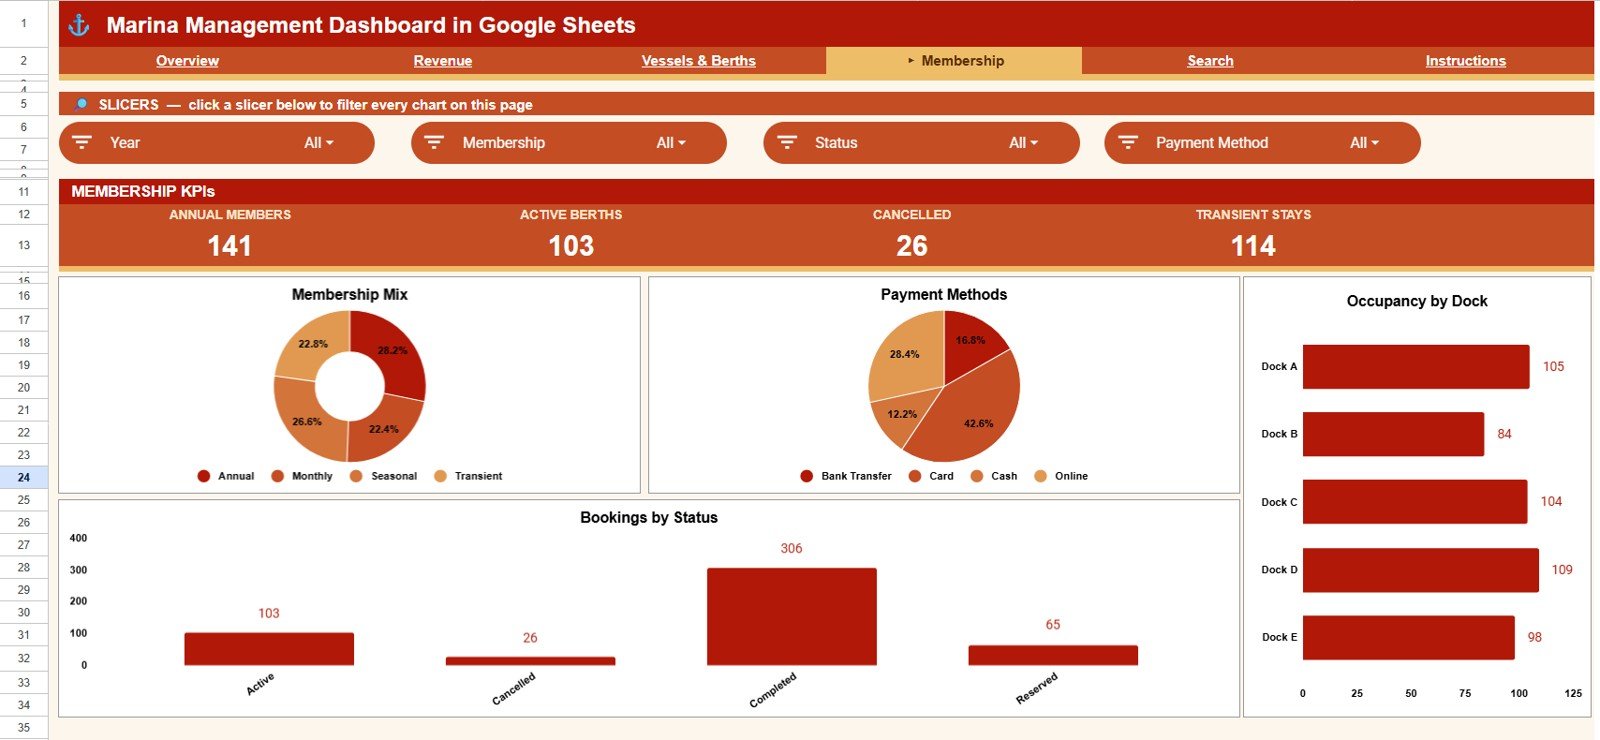
Membership
The Membership tab profiles your customer base and booking behaviour. Membership Mix by Type shows the split across membership tiers; Bookings by Payment Method reveals how customers pay; Occupancy by Dock highlights which docks fill up; and Bookings by Status separates confirmed, cancelled, and pending bookings so you can spot churn and no-show patterns.
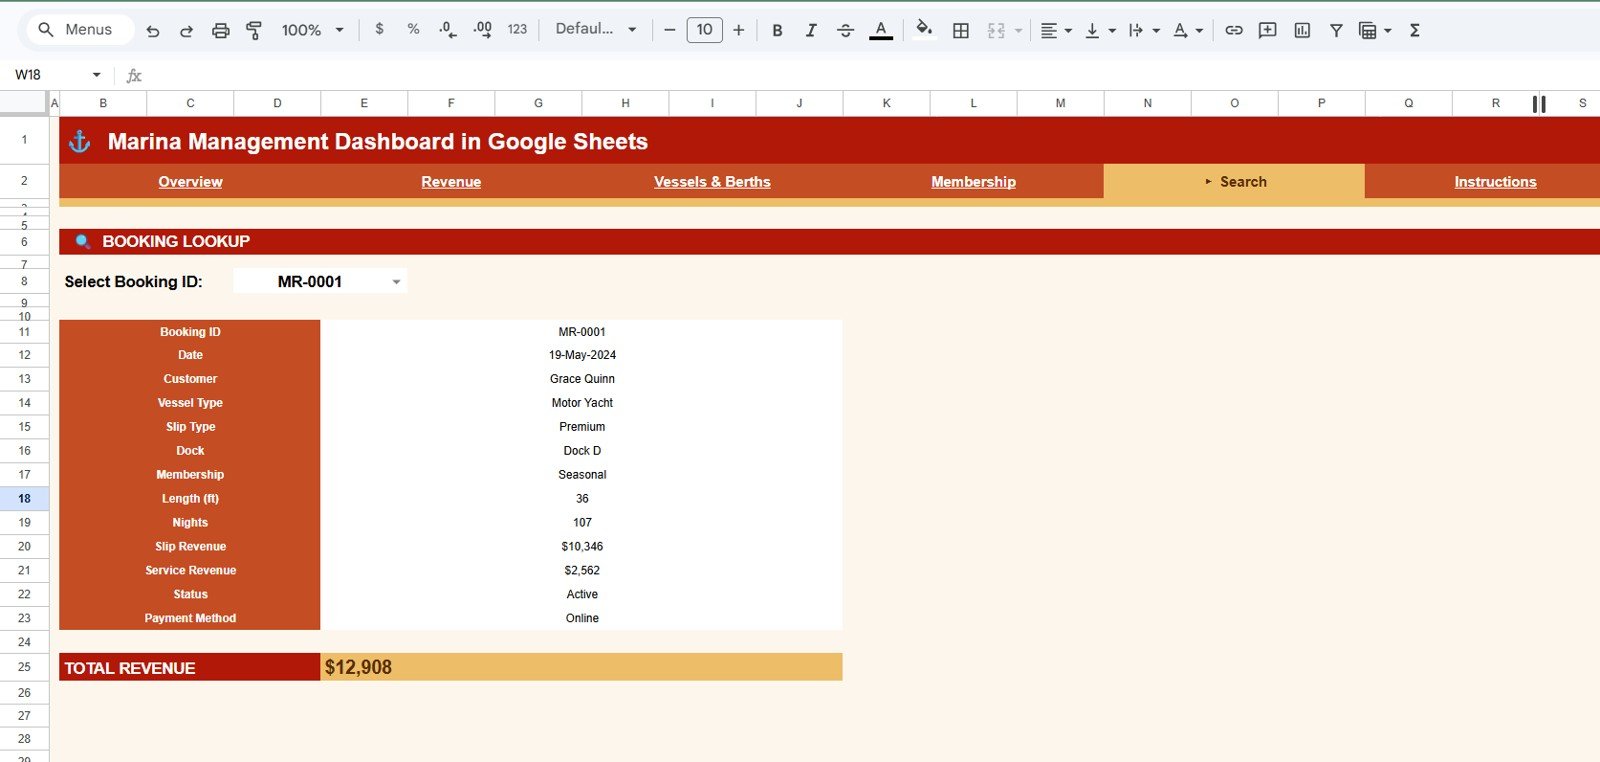
Search Sheet
The Search tab lets you look up any booking in seconds. Select a Booking ID from the dropdown and every detail appears at once — date, customer, vessel type, slip type, dock, membership, length, nights, slip revenue, service revenue, status, payment method, and total revenue.
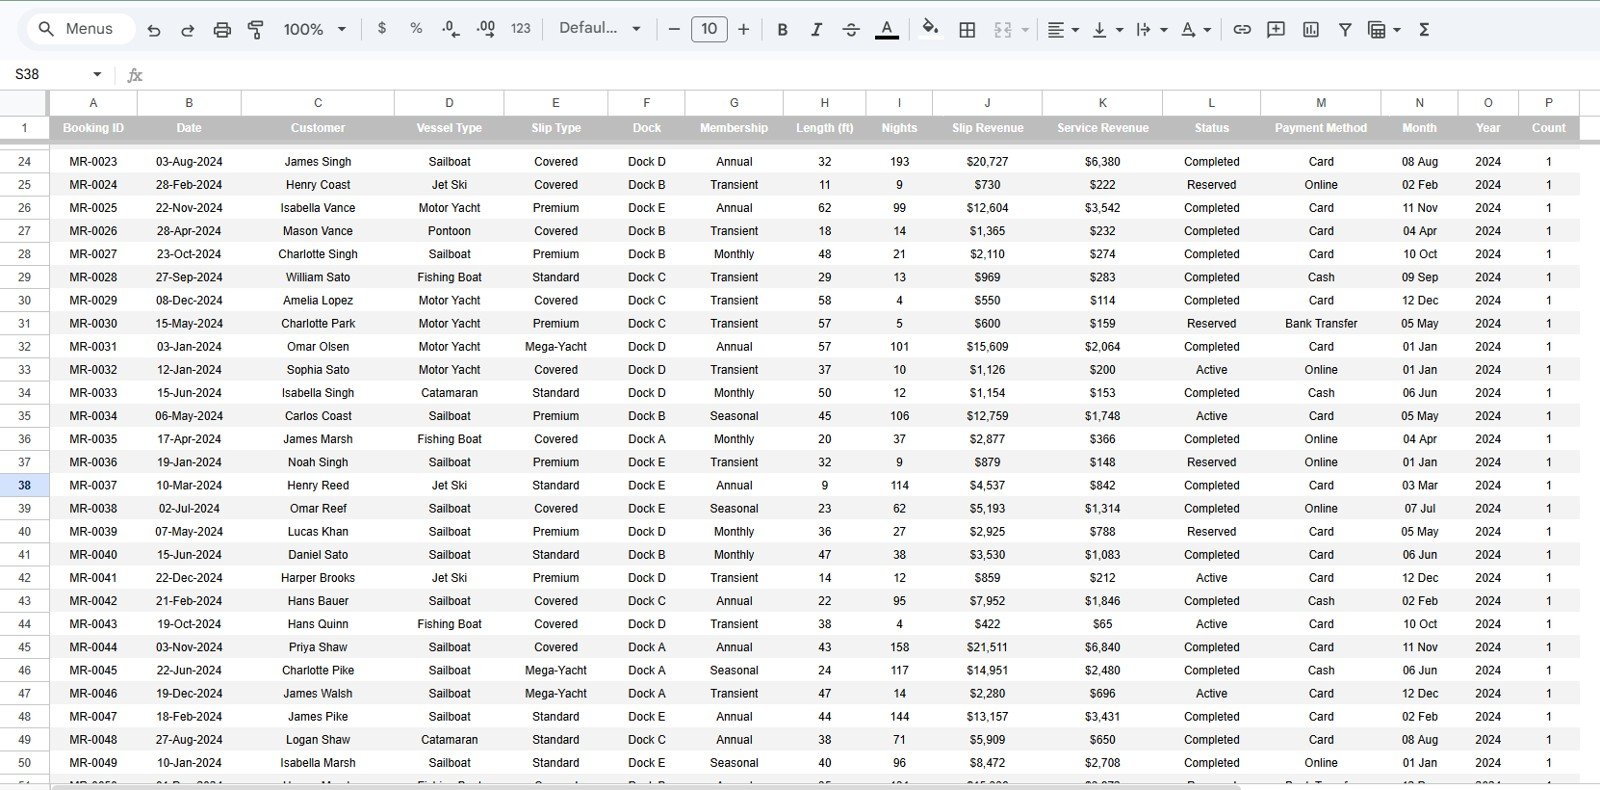
Data Sheet
The Data tab is the single source you edit. Add or paste your booking records in the same column format and every KPI, chart, and the Search tab update automatically. Keep the headers intact and the dashboard scales as your data grows.
Marina Management Dashboard in Google Sheets vs. Excel vs. DockMaster / Molo SaaS — Feature Comparison
| Feature | Marina Dashboard in Google Sheets | Microsoft Excel Dashboard | DockMaster / Molo / MarinaOffice SaaS |
|---|---|---|---|
| Cost | $9.99 one-time | $17.99 one-time | $99 – $499 / month + setup |
| Platform | Google Sheets (browser, any device) | Microsoft Excel (Win + Mac) | Cloud SaaS (browser + mobile app) |
| Setup time | Under 10 minutes | Under 10 minutes | 1 – 4 weeks onboarding |
| Real-time team collaboration | ✅ Native multi-user editing | Via OneDrive co-authoring | ✅ Native |
| Mobile access | ✅ Google Sheets app | ✅ Excel app | ✅ Native app |
| Share with link | ✅ One-click share | File send / OneDrive link | ✅ Account-based |
| Customizable charts and KPIs | ✅ Fully editable | ✅ Fully editable | ❌ Vendor-controlled |
| Year-1 cost at 5 users | $9.99 total | $17.99 total | $1,188 – $5,988 |
| Reservations / payment integration | ❌ Manual data import | ❌ Manual | ✅ Built-in |
For marina operators who want shareable, browser-based booking and revenue analytics without a SaaS subscription, the Marina Management Dashboard in Google Sheets sits in the sweet spot.
Who Should Use This Template
Perfect for:
- Independent marina owners and harbor masters managing 30 – 500 slips
- Yacht club managers preparing monthly board reports in Google Sheets
- Boat-yard operators tracking slip revenue against add-on service income
- Teams that want to share a live dashboard with a link across phone, tablet, and laptop
- Hospitality consultants delivering Google Sheets dashboards to marina clients
Not a fit if:
- You run a large commercial port needing real-time AIS vessel tracking and customs integration
- You require built-in credit-card processing or a payment gateway
- You want a mobile-first dock-staff app for reservations and check-ins (use Molo or DockMaster)
- You need a fully offline desktop file — choose the Excel version instead
Real-World Use Cases
Marcus runs a 120-slip marina on the Chesapeake Bay. Each month he pastes his booking log into the Data tab, opens the Overview and Revenue tabs, and shares a view-only link with his lender. He used to pay $249 per month for a marina dashboard he barely used — now he pays $9.99 once and spends five minutes a month on reporting.
Helena manages a yacht-club group across three sites in Florida. She copies the dashboard for each location and reads Occupancy by Dock and Berth Utilisation by Slip Type to decide which site gets the next dock-renovation budget — all from her phone between site visits.
Diego is a fractional consultant for small marinas. He uses the Membership tab to coach owners on shifting their booking mix toward annual members with higher lifetime value, and the Search tab to pull up any disputed booking instantly during a client call.
Advantages of the Marina Management Dashboard in Google Sheets
The biggest advantage is cost and accessibility. A $9.99 one-time purchase replaces marina SaaS that can run $1,188 to $5,988 a year, and because it lives in Google Sheets, every stakeholder opens the same live link instead of passing files around. Setup takes under 10 minutes, the Search tab turns booking lookups into a one-click task, and the single Data tab keeps maintenance simple — you never touch a formula.
It also slots neatly into a wider toolkit. If you already track operations elsewhere, this dashboard becomes the reporting layer that turns raw bookings into board-ready charts. For broader analytics inspiration, see our Bakery Executive Dashboard in Google Sheets and the Brand Influencer Analytics Dashboard in Google Sheets, which use the same KPI-plus-charts approach.
Opportunities for Improvement
This template is an analytics layer, not a booking engine. It does not take reservations, process payments, or sync with dock cameras — you import booking data rather than capture it live. Very large operations with hundreds of thousands of rows may prefer a database-backed tool, and marinas that need automated check-ins should pair it with a dedicated SaaS. Used as a reporting and decision dashboard, though, it does its job well and stays easy to maintain.
Best Practices
- Keep the Data tab headers unchanged — the charts, KPIs, and Search tab all reference them.
- Paste new bookings as plain values to avoid breaking formatting, then let the charts refresh automatically.
- Use the slicers before exporting a view so board reports show exactly the segment you want.
- Share view-only links for reporting and edit access only for your core team to protect data integrity. The official Google Sheets sharing guide explains the permission levels.
Explore Relevant Templates
Browse more from our Google Sheets Dashboards collection:
- Hotel Hospitality Revenue Dashboard in Google Sheets — broader hotel and resort revenue analytics.
- Bed and Breakfast Dashboard in Google Sheets — small-property hospitality analytics.
- Hospitality & Guest Booking Performance Dashboard in Google Sheets — guest booking and occupancy performance.
- Also available as: Marina Dashboard in Excel and Marina Dashboard in Power BI.
Frequently Asked Questions
What KPIs does the Marina Management Dashboard in Google Sheets track?
The Marina Management Dashboard in Google Sheets tracks 4 headline KPIs — Total Revenue, Total Bookings, Active Berths, and Average Stay (Nights) — plus 16 charts across Overview, Revenue, Vessels & Berths, and Membership tabs. Every metric updates automatically when you add rows to the Data tab.
How does it compare to DockMaster or Molo?
DockMaster and Molo are full marina-management SaaS platforms costing $99 to $499 per month with built-in reservations and payments. The Marina Management Dashboard in Google Sheets is a $9.99 one-time analytics layer for operators who handle bookings elsewhere and just need a shareable performance dashboard without a subscription.
How long does setup take?
Setup takes under 10 minutes. Open the PDF guide, click the copy link to create your own Google Sheet, paste your bookings into the Data tab matching the column headers, and the dashboard is live. There are no formulas to write and nothing to install.
Do I need a paid account to use this Google Sheets dashboard?
No. The Marina Management Dashboard in Google Sheets runs on any free Google account and works on Windows, Mac, Chromebook, iOS, and Android through the Google Sheets app.
Can I add my own charts, slicers, and KPIs?
Yes, the Marina Management Dashboard in Google Sheets is fully editable. Add charts, adjust slicers, restyle colours, or add columns to the Data tab — new fields become available to the existing charts and the Search tab automatically.
Is it a one-time purchase?
Yes — $9.99 one-time, no subscription and no per-user fees. You receive instant download, lifetime use rights, and free updates to the same template version.
About the Author
Built by PK — Microsoft Certified Professional with 15+ years of Excel, Google Sheets, and Power BI experience. Founder of NextGenTemplates, reaching 300K+ subscribers across YouTube channels. Every template is hand-built and tested before release.
Conclusion
The Marina Management Dashboard in Google Sheets gives marina operators board-ready booking and revenue analytics for a one-time $9.99 — no subscription, no install, and shareable with a link. With 4 KPIs, 16 charts, a Search tab, and a single Data tab, it turns raw bookings into clear decisions in minutes.
👉 Click here to purchase the Marina Management Dashboard in Google Sheets
Instant download · One-time payment · No subscription
🎥 For step-by-step video tutorials, visit YouTube.com/@NeoTechNavigators.
Last updated: June 2026