Ask most fencing contractors how last month went and you get a story: a wet fortnight, a customer who kept moving the line, a crew that lost two days to a rock seam. Ask for the numbers and you usually get a job-costing file, a bank balance and a shrug. The Fencing Contractor KPI Scorecard in Google Sheets replaces the shrug with one screen: 10 fencing KPIs in 5 groups, each carrying a value, a target, a change, a direction-aware traffic light and a 12-month sparkline. Eight tabs, 120 month-rows of worked sample data, formulas only – no Apps Script, no macros, no add-ons – and it opens in a browser on a free Google account.Fencing Contractor KPI Scorecard in Google Sheets
One thing to settle before anything else, because three product lines carry near-identical names. This is the KPI Scorecard line. A scorecard takes a fixed set of measures and tells you, month by month, whether each one is good or bad and by how much. The KPI Dashboard line is a different template with a different job, and the analytical Dashboard line is different again – slicers, breakdowns, drill-through. They are complements, not duplicates, and picking the wrong one is the most common mistake buyers make.Fencing Contractor KPI Scorecard in Google Sheets
Key Features of the Fencing Contractor KPI Scorecard in Google Sheets
- Ten KPIs written for fencing work, not adapted from a generic template: Fence Footage Installed per Crew Day, Job Completion On-Time Rate, Post-Set Rework Rate, 90-Day Callback Rate, Estimate-to-Contract Conversion Rate, Estimate Turnaround Time, Crew Utilization Rate, Recordable Safety Incident Rate, Gross Margin per Job and Material Waste Rate.Fencing Contractor KPI Scorecard in Google Sheets
- Five groups with two KPIs each – Field Production, Quality & Rework, Sales & Estimating, Crew & Safety, Financial – so the page reads as a balanced set rather than ten unrelated numbers.Fencing Contractor KPI Scorecard in Google Sheets
- Direction-aware traffic lights. Five KPIs are Upper-the-Better and five are Lower-the-Better. Material Waste Rate going up is red; Fence Footage per Crew Day going up is green. The arrow colour on each card follows the same rule.
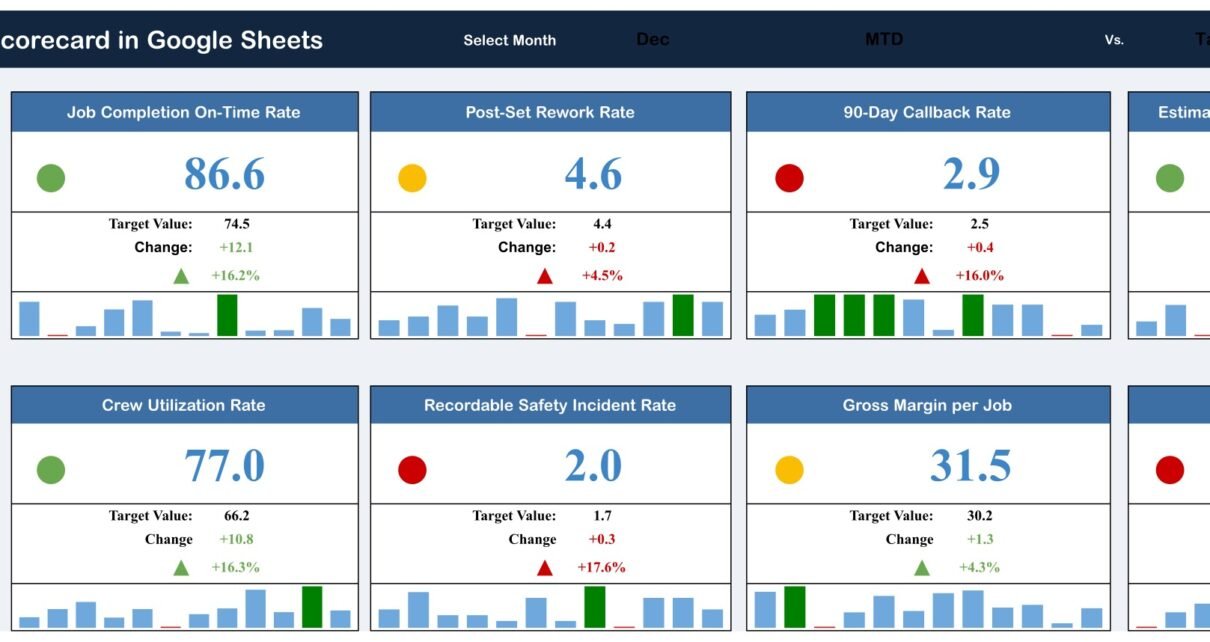
- Three header controls – Select Month, an MTD/YTD switch and a Vs. Target/PY switch – that drive all ten cards together.Fencing Contractor KPI Scorecard in Google Sheets
- A 12-month sparkline on every card, with the selected month picked out, so you get the level and the trajectory in the same glance.Fencing Contractor KPI Scorecard in Google Sheets
- A dedicated KPI Trend page with a KPI selector, the formula and definition in full, and two combo charts covering Jan to Dec.
- A KPI Definition sheet that actually drives the model – rename a KPI there and the cards, the trend selector and the lookups all follow.
- Native formulas end to end: SUMIFS over six named ranges, VLOOKUP and INDEX/MATCH for the definition lookups. Nothing to authorise, nothing to install.Fencing Contractor KPI Scorecard in Google Sheets
Inside the Scorecard – a Tab-by-Tab Walkthrough
Scorecard – the page you actually live on
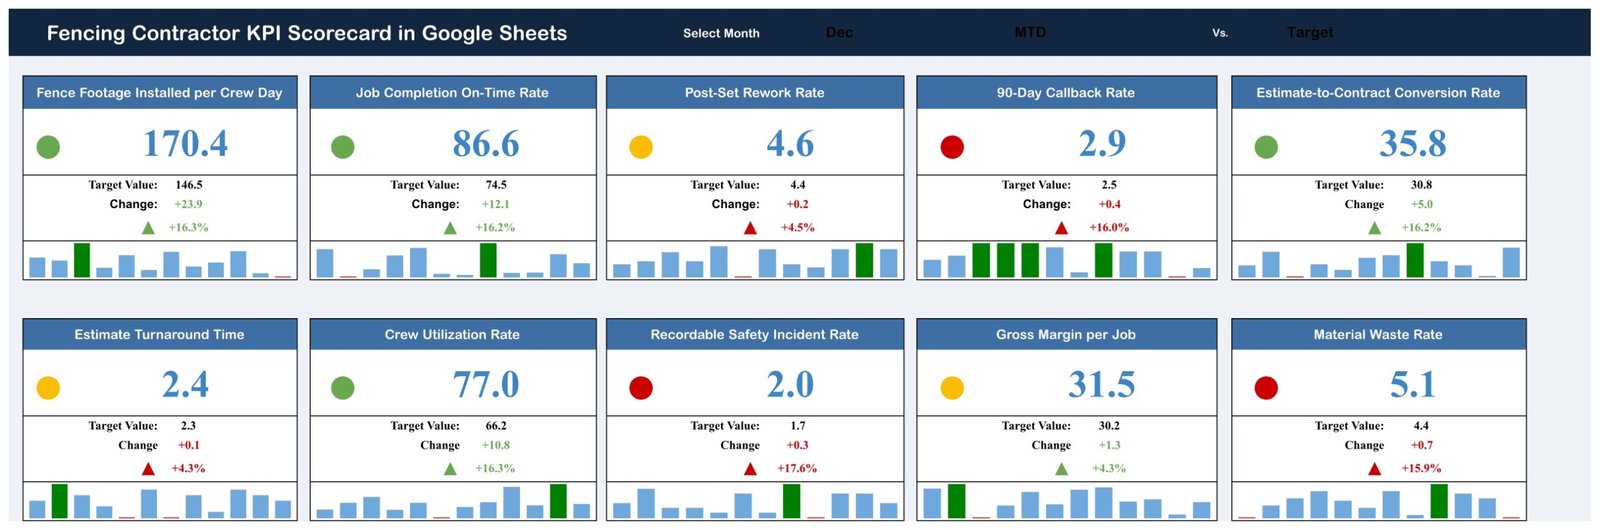
Ten cards, two rows of five. Every card carries the KPI name in a blue banner, the current value in large type, a red, amber or green dot, the Target Value (the label switches to PY Value when you flip the comparison), the absolute Change, an up or down arrow and the Change %. In the shipped sample for December the split is four green, three amber and three red – which is what a real month looks like, not a demo where everything is green.Fencing Contractor KPI Scorecard in Google Sheets
Worth reading the reds properly. In the sample, 90-Day Callback Rate is 2.9% against a 2.5% target and Material Waste Rate is 5.1% against 4.4%, both Lower-the-Better, so being above target is the bad outcome and the card is correctly red even though the arrow points up. That is the whole point of building direction into the model rather than colouring cells by hand.Fencing Contractor KPI Scorecard in Google Sheets
KPI Trend – one KPI, twelve months, two charts
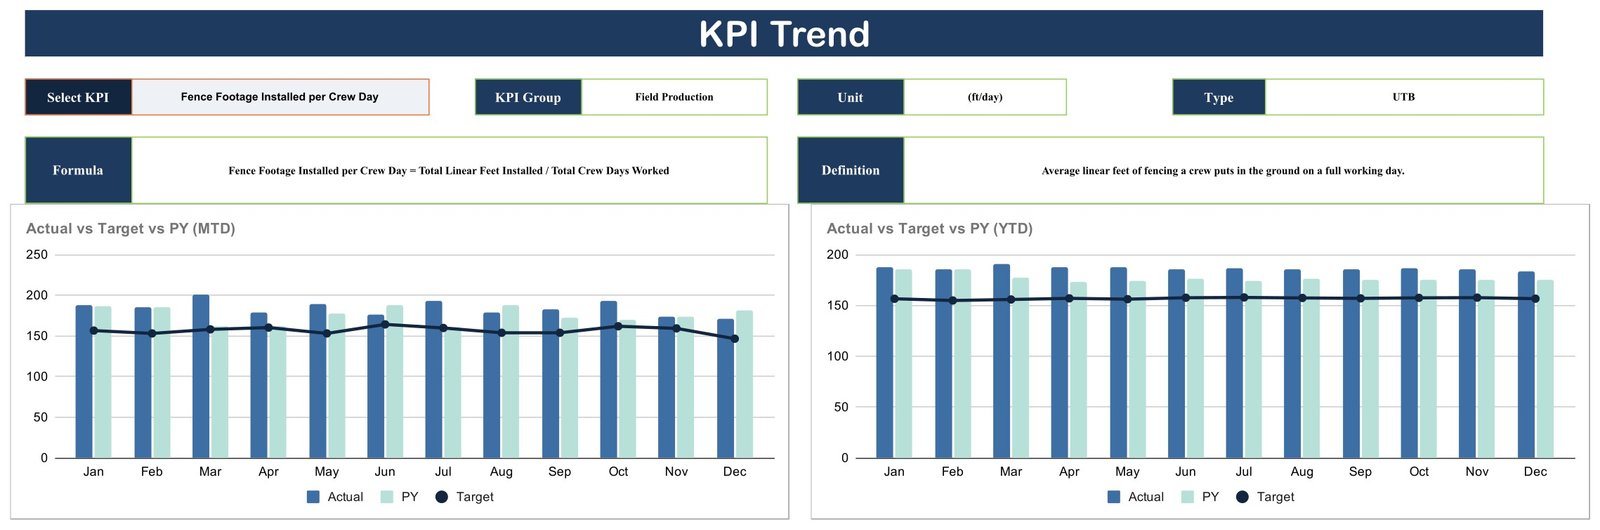
Choose a KPI from the drop-down and the page rebuilds around it: KPI Group, Unit, Type (UTB or LTB), the formula spelled out in words, and the plain-English definition. Underneath sit two combo charts – “Actual vs Target vs PY (MTD)” and “Actual vs Target vs PY (YTD)”. Actual and Prior Year are bars, Target is the line across the top. The MTD chart is the noisy one that shows month-to-month swing; the YTD chart is the smooth one that shows whether the year is actually going anywhere.

KPI Definition – the sheet that decides everything
Seven columns: number, KPI Group, KPI Name, Unit, Formula, Definition and Type. The formulas are written out so nobody has to guess what the number means – for instance Post-Set Rework Rate = Fence Posts Reset or Realigned / Total Fence Posts Set x 100, and Recordable Safety Incident Rate = Recordable Injuries x 200,000 / Total Field Hours Worked. The Type column is the one to get right: it is what tells the scorecard whether up is good.Fencing Contractor KPI Scorecard in Google Sheets
Input Data – the only tab you type in
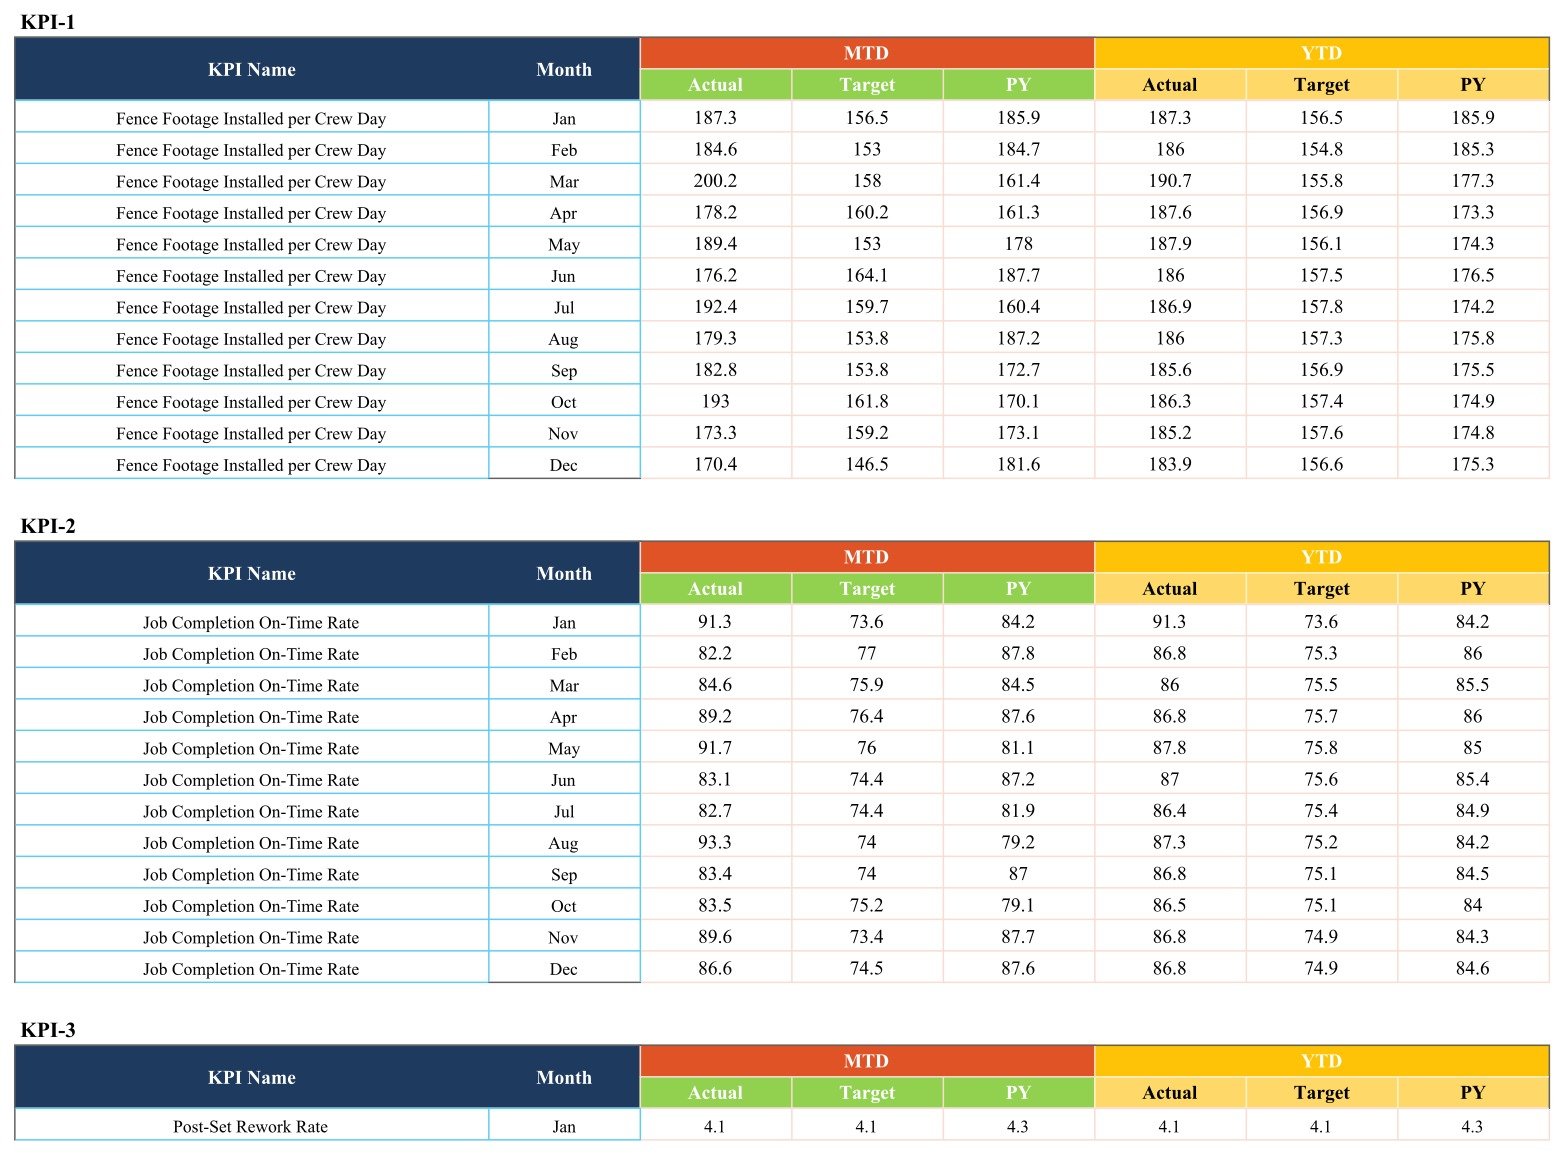
Ten blocks, headed KPI-1 to KPI-10, twelve month rows each. Six value columns per row: MTD Actual, MTD Target, MTD PY, then YTD Actual, YTD Target, YTD PY. The Scorecard and both trend charts read straight out of here through named ranges, so as long as you replace values in place rather than inserting rows, everything downstream keeps working.
The four supporting tabs
Color Settings writes out the RAG rule as a variance-percentage table for both directions. Support is the engine: it resolves the selected month, pulls the MTD or YTD figure, and calculates Change, Change %, arrow colour and light colour per KPI – and it holds the live amber and red thresholds. Trend_Support assembles the twelve-month series behind the two charts. Read Me ships blank, ready for your own notes.
Google Sheets vs. Excel vs. Paid Field-Service SaaS – Feature Comparison
| This scorecard (Google Sheets) | Excel KPI scorecard | Paid field-service SaaS | |
|---|---|---|---|
| Cost | 8.99 one-off | 9.99 one-off | 49-300+ per user per month |
| Platform | Any browser, free Google account | Excel 2016 or later | Web plus mobile apps |
| Setup time | About 20 minutes | About 20 minutes | Days to weeks, often with onboarding fees |
| Real-time collaboration | Yes – native | Only through OneDrive co-authoring | Yes |
| Mobile access | Yes | Limited | Yes |
| Customisable KPIs | Yes – all ten, on one tab | Yes | Only the fields the vendor exposes |
| Share with a link | Yes | No – you send the file | Seat-based invitations |
| Year-1 cost, 5 users | 8.99 | 9.99 | 3,000-18,000 |
| Direction-aware RAG | Yes – per KPI | Yes | Varies; often up-is-good only |
| Scheduling and invoicing | No | No | Yes |
The comparison is not really scorecard against SaaS. Most contractors who buy this already run a scheduling tool and still have nowhere to see callback rate sitting next to gross margin. The scorecard fills that gap; it does not replace the software that dispatches your crews.
Who Should Use This Template
It suits owner-operators and small-to-mid fencing companies running roughly 2 to 20 crews, operations managers who owe somebody a monthly number, and estimators who would rather track conversion rate and turnaround time than argue about them. If your team is already in Google Workspace it drops straight in, because it is a sheet and nothing more.
It is the wrong tool if you want dispatch, invoicing or a customer portal. It is also not a safety or OSHA recordkeeping system: Recordable Safety Incident Rate is a single monthly summary figure you enter yourself, and the sheet has no incident log, no investigation records and no regulatory output. And if the question you keep asking is “which crew” or “which fence type”, that is a breakdown question – the KPI Dashboard line answers it, a scorecard does not.
Real-World Use Cases
The residential installer with six crews. The owner suspected jobs were running late but could not size it. Two months of data put Job Completion On-Time Rate in amber and Estimate Turnaround Time in red at the same time – quotes going out late were pushing every downstream date. Fixing the estimating bottleneck moved both cards, which is exactly the kind of causal pair a grouped scorecard makes visible.
The commercial contractor reporting to a board. The monthly pack used to be four spreadsheets stitched together the night before. Now the Scorecard tab is the pack. The KPI that changed behaviour was Post-Set Rework Rate: a number a little over target, costing crew days that had never appeared on any report.
The estimator who became part-owner. He watches Estimate-to-Contract Conversion Rate and Gross Margin per Job on the same screen. Conversion above target while margin drifts amber has an obvious reading: work is being won on price. Seeing the two together is what makes it obvious.
Advantages of the Fencing Contractor KPI Scorecard in Google Sheets
- You can audit every number. Click a card and follow the formula through Support to Input Data. Nothing is hidden in a script or a data model.
- Direction is modelled, not painted. The UTB/LTB flag drives both the light and the arrow colour, so a bad number cannot accidentally look good.
- MTD and YTD from the same input. One switch reframes the whole page without touching a formula.
- It travels. A link works on a phone in a truck as well as it works on the office monitor.
- The sample year teaches the model. Twelve populated months across all ten KPIs means you can experiment with the switches before your own data goes anywhere near it.
- No lock-in. File to Download gives you an .xlsx copy any time you want one.
Opportunities for Improvement
Being straight about the limits is more useful than a feature list, so:
- Ten KPIs is the practical ceiling. The Scorecard page has ten card frames and Input Data has ten blocks. An eleventh means extending both layouts by hand.
- Data entry is manual. There is no connector to accounting or job-costing software. Twelve rows per KPI, typed or pasted, once a month.
- There is no KPI Analysis page. The companion Excel edition ships one – group achievement, RAG counts, Top 5 and Bottom 5 – and this Google Sheets edition does not. If that summary view matters to you, that is a real reason to choose the Excel edition instead.
- Comparison is Target or Prior Year only. No prior-month option on this edition.
- The Read Me tab is empty. It is a placeholder for your own conventions, not a built-in manual.
- The Color Settings tab is documentation. It states the RAG rule clearly, but the thresholds the sheet reads at run time sit on the Support tab, so that is where you change them.
Best Practices
- Set the Type column before you set anything else. UTB versus LTB is the single field that decides whether your traffic lights tell the truth.
- Fill both MTD and YTD columns. The switch is only useful if both sides have numbers; a half-filled YTD block reads as a blank card, not as an error.
- Define the KPI in writing. Use the Definition column so “on-time” means the same thing to the estimator and the crew lead six months from now.
- Set targets once a year and leave them alone. A target you move whenever you miss it is not a target.
- Review monthly, act on two KPIs. Ten reds fixes nothing. Pick the two with the worst variance and work those.
- Keep the master view-only. Share the link widely, hand out edit rights narrowly, and use version history when someone types over a formula. Google’s own guide to version history in Google Sheets covers the recovery steps.
- Take a fresh copy each year rather than overwriting last year’s numbers, so you keep a comparable record.
Explore Relevant Templates
The same scorecard built for other trades: Concrete Contractor KPI Scorecard in Google Sheets, Drywall Contractor KPI Scorecard in Google Sheets, Roofing Contractor KPI Scorecard in Google Sheets and Masonry Contractor KPI Scorecard in Google Sheets. For breakdowns and filters rather than a fixed card set, the KPI Dashboard line is the one to look at. Everything else lives under Google Sheets templates.
Frequently Asked Questions
Is this identical to the Fencing Contractor KPI Scorecard in Excel?
No. They are companion editions built on different templates, not one file exported twice. The Excel edition has eleven sheets, twenty KPI slots, a KPI Analysis page, four charts per KPI on its trend page and a Prior Month comparison. This Google Sheets edition has eight tabs, ten filled KPIs, one trend page with two charts, and Target or PY comparison. The KPI mix differs as well: this edition is five Upper-the-Better against five Lower-the-Better and includes a Recordable Safety Incident Rate that the Excel edition does not carry. Choose on where your team works, not on assuming they are the same file.
What do I actually download?
A PDF. It previews the scorecard and carries the “Make a copy” link to the live Google Sheet – that link is the product. There is no .xlsx or .zip in the download.
Do I need a paid Google account?
No. A free personal Google account is enough, and there is nothing to install.
Can I rename the KPIs?
Yes – rewrite the KPI Definition tab. Update the matching names on the Input Data tab too, so the SUMIFS lookups still resolve.
How are red, amber and green decided?
By variance percentage and KPI direction. For Upper-the-Better, at or below 0% variance is red, up to +10% is amber, above +10% is green. For Lower-the-Better the rule is mirrored, so coming in under target is what earns the green.
Will it work on a phone?
Yes, in the Google Sheets app or a mobile browser. The Scorecard page is a wide layout, so it is more comfortable on a tablet or in landscape.
Does it handle safety compliance?
No. It reports Recordable Safety Incident Rate per 200,000 field hours as a monthly summary you type in. It is not an incident log and it is not an OSHA recordkeeping system.
About the Author
Built by PK – Microsoft Certified Professional with 15+ years of Excel, Google Sheets, and Power BI experience. Founder of NextGenTemplates, reaching 300K+ subscribers across YouTube channels. Every template is hand-built and tested before release.
Conclusion
Fencing is a trade where the money leaks in places the P&L never names: posts reset after the concrete cured, a crew idling because the estimate went out late, a pallet of pickets nobody costed. Ten KPIs across five groups, with direction built into every light and twelve months of history under every card, put those leaks on one screen where they are hard to ignore. It will not schedule a job or raise an invoice, and it is not a safety recordkeeping system – but as the monthly number that tells you where to look, it earns its 8.99 in the first review.
Get the Fencing Contractor KPI Scorecard in Google Sheets – 8.99 instead of 13.99, instant download, lifetime access, 30-day money-back guarantee.
For more Google Sheets walkthroughs and template tutorials, subscribe to
youtube.com/@NeoTechNavigators.