In the maritime industry, key performance indicators (KPIs) are essential for monitoring and improving various business operations. KPIs provide valuable insights into areas such as fleet management, fuel efficiency, cargo handling, and safety. A well-designed KPI dashboard can help maritime businesses track these metrics and make data-driven decisions.
In this article, we will explore the Maritime KPI Dashboard in Google Sheets—a ready-to-use template designed to help maritime businesses efficiently track essential KPIs. This guide will cover the KPIs, their definitions, formulas, and whether they should be “lower the better” or “upper the better.”
Key Features of the Maritime KPI Dashboard in Google Sheets
Before diving into the specifics of the KPIs, let’s first understand the key features of this dashboard template:
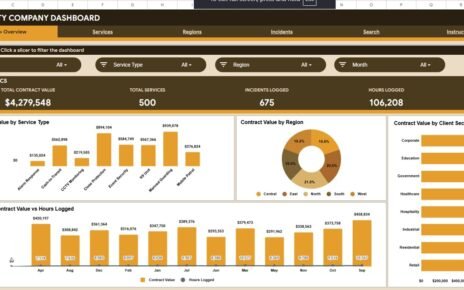
Dashboard Sheet Tab
The main sheet displaying all KPI information.
Month Selection: Select the month from the drop-down menu in Range D3, and the entire dashboard will update accordingly.
MTD (Month-to-Date): Displays actual values, targets, and comparisons with previous year data using conditional formatting (up or down arrows).
YTD (Year-to-Date): Shows cumulative performance with comparisons to targets and previous year data.

Click to buy Maritime KPI Dashboard in Google Sheets
KPI Trend Sheet Tab
Allows you to select KPIs from the dropdown in Range C3.
Displays the KPI group, unit of measure, type (Lower the Better or Upper the Better), formula, and definition.

Click to buy Maritime KPI Dashboard in Google Sheets
Actual Number Sheet Tab
Enter actual numbers for both YTD and MTD for a particular month.
Change the month from Range E1 by inputting the first month of the year.

Target Sheet Tab
Enter target values for each KPI for MTD and YTD.
Helps track performance against set goals.

Click to buy Maritime KPI Dashboard in Google Sheets
Previous Year Number Sheet Tab
Enter data for the previous year, mirroring the format of the current year’s data for accurate year-over-year comparison.

KPI Definition Sheet Tab
Provides detailed information for each KPI, including:
KPI Name
KPI Group
Unit of Measure
Formula used to calculate the KPI
Definition explaining the KPI

Click to buy Maritime KPI Dashboard in Google Sheets
Advantages of Using the Maritime KPI Dashboard in Google Sheets
An Electronics KPI Dashboard in Google Sheets offers several benefits to businesses in the maritime industry. Here are the key advantages:
-
Real-Time Monitoring: Monitor KPIs in real-time for quick decision-making.
-
Customizable Templates: Google Sheets’ flexibility allows you to add/remove KPIs and adjust formulas as needed.
-
Cost-Effective: Free to use, making it an affordable option for businesses.
-
Cloud-Based Collaboration: Enables team members to collaborate in real-time, regardless of location.
-
Accessibility: Accessible from any device with an internet connection.
Opportunities for Improvement in the Maritime KPI Dashboard
While the Maritime KPI Dashboard in Google Sheets is already a powerful tool, there are opportunities for improvement:
Automating Data Entry:
- Current Challenge: Manual data entry can be time-consuming and error-prone.
- Opportunity: Integrate with external systems (e.g., ERP, fleet management) to automate data entry and reduce errors.
Advanced Visualizations:
- Current Challenge: Basic visualizations may not be visually engaging enough.
- Opportunity: Adding advanced visualizations like sparklines, pie charts, and heatmaps can enhance data interpretation.
Customizable Reporting:
- Current Challenge: Reporting features are basic.
- Opportunity: Add customizable report generation options, such as PDF exports or automated email summaries.
Best Practices for Using the Maritime KPI Dashboard
Click to buy Maritime KPI Dashboard in Google Sheets
To maximize the utility of the Maritime KPI Dashboard in Google Sheets, consider these best practices:
-
Update Data Regularly: Ensure monthly updates to maintain accuracy and relevance.
-
Use Consistent Naming Conventions: Maintain clear and consistent naming for KPIs, units, and formulas to avoid confusion.
-
Set Realistic Targets: Ensure targets are achievable and based on historical data.
-
Encourage Collaboration: Share the dashboard with relevant stakeholders to keep everyone aligned.
-
Utilize Conditional Formatting: Use color codes or arrows for instant visual cues on performance trends.
Conclusion
The Maritime KPI Dashboard in Google Sheets is a robust tool for tracking key performance metrics in the maritime industry. By using this dashboard, businesses can gain valuable insights into fleet performance, operational efficiency, and safety, enabling them to make informed decisions that drive growth and improve operations.
Frequently Asked Questions (FAQs)
Click to buy Maritime KPI Dashboard in Google Sheets
What is a KPI in the maritime industry?
A KPI (Key Performance Indicator) is a measurable value that indicates how effectively a maritime business is achieving its operational goals. Common maritime KPIs include fuel efficiency, on-time delivery, and safety incident rates.
How do I customize my Maritime KPI Dashboard?
You can easily customize the dashboard by adding or removing KPIs, adjusting formulas, and changing data sources based on your specific needs.
How do I enter data into the Maritime KPI Dashboard?
Simply enter data for KPIs such as actual numbers and targets into the appropriate tabs (Actual Numbers Sheet, Target Sheet, Previous Year Numbers Sheet) for each month.
Can I automate the data entry process?
Yes, by integrating the dashboard with other systems like ERP or fleet management software, you can automate data entry and reduce manual input errors.
Which KPIs should I track in my maritime business?
Essential KPIs for the maritime industry include fuel efficiency, on-time delivery, fleet utilization, maintenance cost, and customer satisfaction.
Visit our YouTube channel to learn step-by-step video tutorials
Youtube.com/@NeotechNavigators
Watch the step-by-step video Demo: