The AR-VR Industry KPI Dashboard in Google Sheets is an essential tool for businesses in the augmented reality (AR) and virtual reality (VR) industries. It provides a powerful way to track key performance indicators (KPIs) that measure business success across various aspects of AR and VR development and operations.
In this article, we’ll walk you through the key features of the AR-VR Industry KPI Dashboard, explain the KPIs it tracks, and show how it can help businesses in this industry optimize their performance.
What is the AR-VR Industry KPI Dashboard in Google Sheets?
The AR-VR Industry KPI Dashboard in Google Sheets is a customizable, ready-to-use template that allows you to track and analyze key metrics relevant to the AR and VR industries. By monitoring these KPIs, you can make data-driven decisions that improve business performance, enhance product development, and boost customer satisfaction.
The dashboard is designed to track various aspects of AR and VR development, from user engagement and content creation to financial performance and operational efficiency.
Key Features of the AR-VR Industry KPI Dashboard in Google Sheets
The AR-VR Industry KPI Dashboard contains six key worksheets that allow you to track different aspects of AR and VR performance. Each worksheet provides specific insights that help you manage your business efficiently.
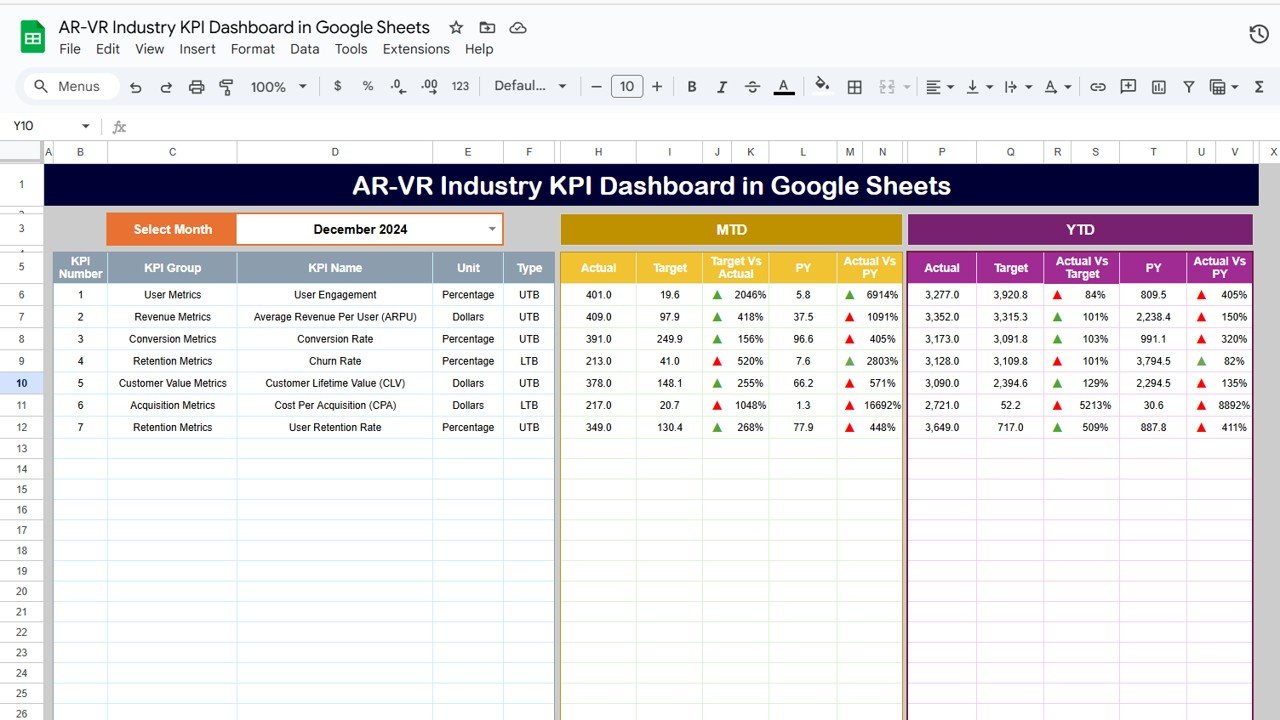
1. Dashboard Sheet Tab
The Dashboard Sheet is the main overview tab where you can see all your KPIs at a glance.
Month Selection (D3): Choose the month to update the entire dashboard with relevant data.
Key Metrics:
- MTD Actual, Target, Previous Year Data: Track actual performance for the current month and compare it with targets and previous year’s data.
- YTD Actual, Target, Previous Year Data: Monitor year-to-date performance and compare it with targets and past performance.
-
Conditional Formatting: Indicators (up and down arrows) display whether the KPIs are on track or not, providing an instant view of performance against targets.
Click to buy AR-VR Industry KPI Dashboard in Google Sheets
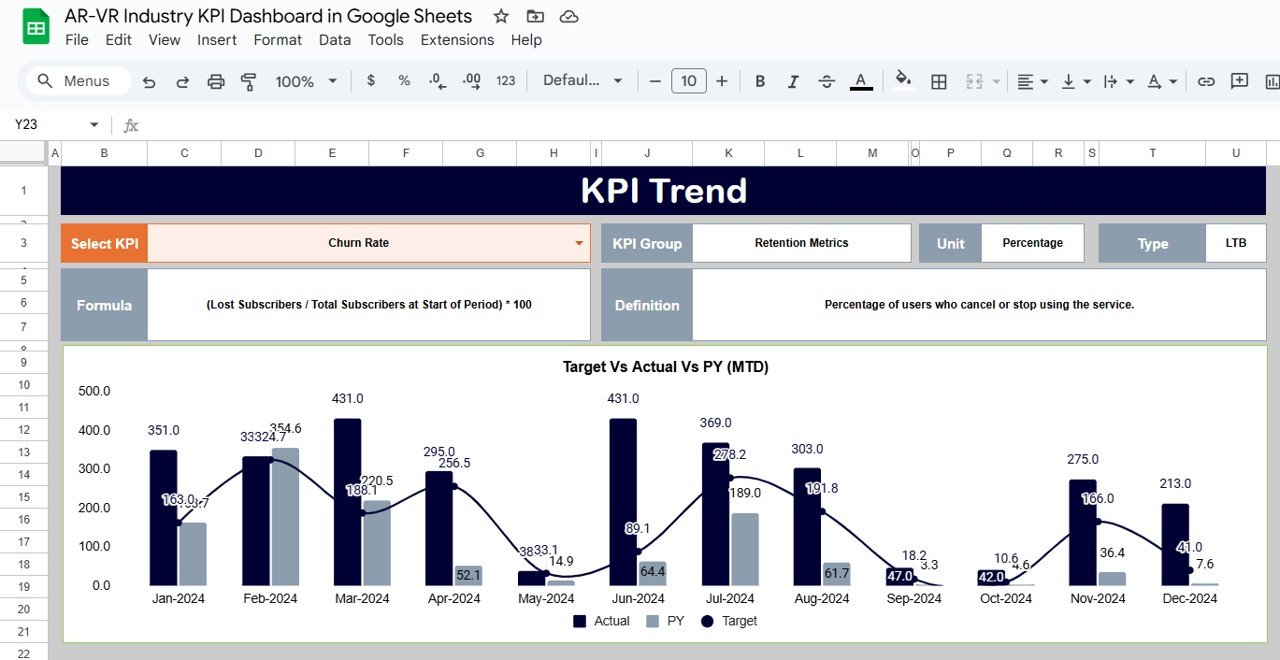
2. KPI Trend Sheet Tab
The KPI Trend Sheet helps you visualize performance trends over time.
-
KPI Selection (C3): Select a KPI from the dropdown to view its trend over the last few months.
-
KPI Group, Unit, and Type: The KPI’s group (e.g., user engagement, financials), unit of measurement (e.g., percentage, revenue), and whether it’s a “Lower the Better” (LTB) or “Upper the Better” (UTB) KPI.
-
Formula and Definition: This section explains how each KPI is calculated and its significance.
Click to buy AR-VR Industry KPI Dashboard in Google Sheets
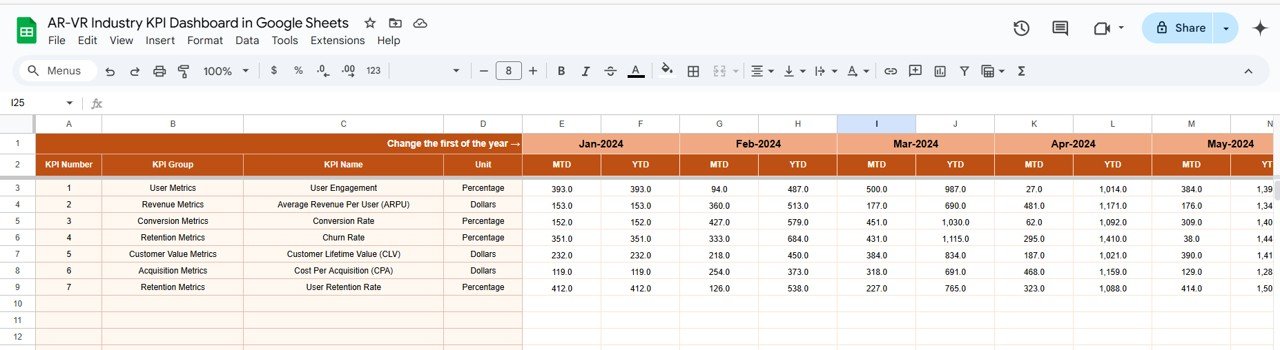
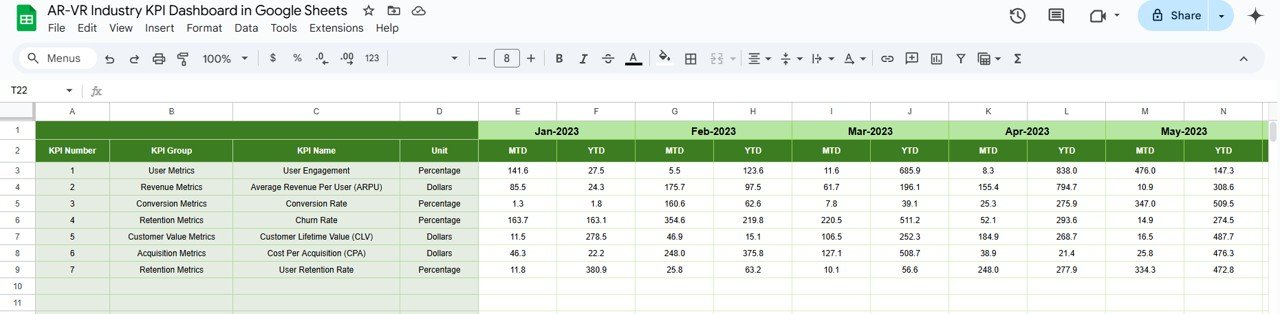
3. Actual Numbers Sheet Tab
This sheet allows you to input the actual performance data for each KPI:
-
MTD and YTD Data: Enter the actual values for the month-to-date and year-to-date figures, which will update the dashboard automatically.
-
Month Selection (E1): Select the starting month of the year, and the data for the entire dashboard will adjust accordingly.
4. Target Sheet Tab
The Target Sheet is where you input the target values for each KPI:
-
Monthly and YTD Targets: Enter the target values for each KPI, both for the current month and year-to-date.
Click to buy AR-VR Industry KPI Dashboard in Google Sheets
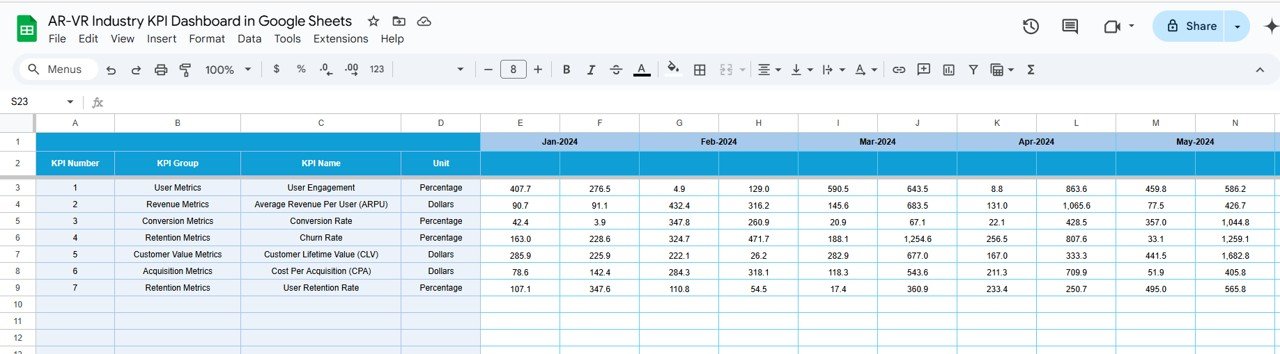
5. Previous Year Number Sheet Tab
This sheet tracks the performance of the previous year:
-
Historical Data: Enter last year’s data to allow for comparison with current performance, enabling trend analysis and progress evaluation.
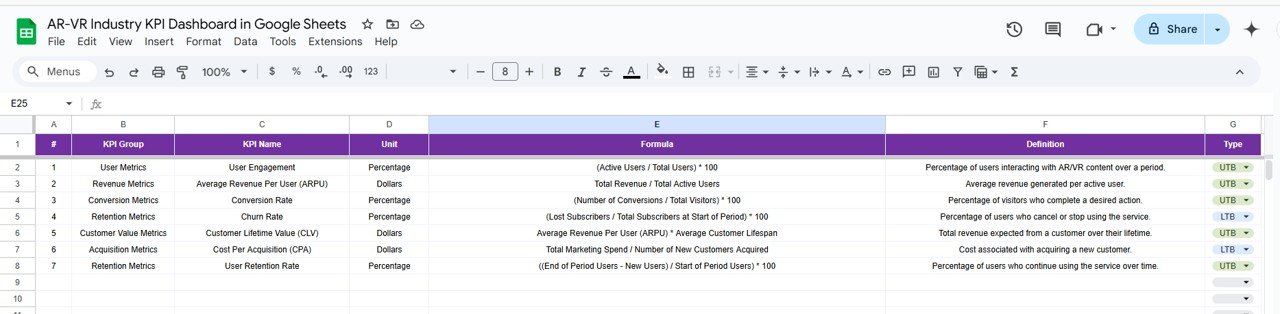
6. KPI Definition Sheet Tab
This sheet provides a detailed breakdown of each KPI:
-
KPI Name, Group, Unit: The name, group (e.g., marketing, financial), and unit of each KPI.
-
Formula and Definition: Provides clarity on how each KPI is calculated and its relevance in the AR-VR industry.
Click to buy AR-VR Industry KPI Dashboard in Google Sheets
Advantages of Using the AR-VR Industry KPI Dashboard
The AR-VR Industry KPI Dashboard offers several key benefits:
-
Comprehensive Tracking: Track all essential performance metrics for your AR and VR operations in one place.
-
Real-Time Insights: With real-time data updates, you can monitor performance and make adjustments as needed.
-
Better Decision-Making: By comparing actual performance to targets and historical data, you can make informed decisions to improve operations.
-
Cost Optimization: Monitor metrics like Cost per Acquisition and Operational Cost per User to optimize your marketing spend and operational efficiency.
-
Improved Customer Satisfaction: Track metrics like Customer Satisfaction Score and User Retention Rate to ensure your products are meeting customer expectations.
Opportunity for Improvement in the AR-VR Industry KPI Dashboard
Click to buy AR-VR Industry KPI Dashboard in Google Sheets
While the AR-VR Industry KPI Dashboard is an excellent tool, there are several opportunities for improvement:
-
Automation: Automating data import from your CRM or AR/VR system would reduce manual data entry and ensure up-to-date tracking.
-
Integration with Financial Tools: Integrating the dashboard with financial software could allow for seamless tracking of revenue and cost data.
-
Mobile Version: Creating a mobile-friendly version of the dashboard would allow you to access it on the go.
-
Predictive Analytics: Using AI to predict future trends based on current and historical data would be a valuable addition.
Best Practices for Using the AR-VR Industry KPI Dashboard
To get the most out of the AR-VR Industry KPI Dashboard, consider the following best practices:
-
Regular Data Updates: Ensure the dashboard is updated regularly with accurate data to monitor real-time performance.
-
Set Achievable Targets: Establish realistic KPIs and targets to guide your AR/VR business towards success.
-
Analyze Trends: Regularly review the trends and adjust strategies based on insights from the dashboard.
-
Collaborate Across Teams: Share the dashboard with team members from different departments (e.g., marketing, development) to align efforts and improve overall performance.
-
Use Visual Insights: Take advantage of charts and visual indicators to easily interpret performance and make quick decisions.
Conclusion
Click to buy AR-VR Industry KPI Dashboard in Google Sheets
The AR-VR Industry KPI Dashboard in Google Sheets is a powerful tool that provides valuable insights into the performance of AR and VR businesses. By tracking critical KPIs such as user engagement, revenue, customer satisfaction, and operational costs, businesses can make informed decisions to optimize their operations, enhance user experiences, and increase profitability.
Frequently Asked Questions (FAQs)
1. What KPIs does the AR-VR Industry KPI Dashboard track?
The dashboard tracks KPIs such as Total Users, Revenue from Sales, Customer Satisfaction Score, and more.
2. Can I customize the AR-VR Industry KPI Dashboard?
Yes, the dashboard is fully customizable. You can add new KPIs, adjust formulas, and modify the layout to suit your business needs.
3. How do I update the AR-VR Industry KPI Dashboard?
Simply input your actual performance data in the Actual Numbers Sheet and set targets in the Target Sheet to keep the dashboard updated.
4. Can I integrate the AR-VR Industry KPI Dashboard with other software?
Yes, you can integrate the dashboard with CRM or financial tools to automate data entry and ensure real-time performance tracking.
5. How often should I update the AR-VR Industry KPI Dashboard?
It’s recommended to update the dashboard regularly, especially during key reporting periods, to keep track of your AR/VR business performance.
Visit our YouTube channel to learn step-by-step video tutorials
Youtube.com/@NeotechNavigators
Watch the step-by-step video Demo:

