In this article, we introduce the Biotechnology KPI Dashboard in Google Sheets—a ready-to-use template designed to help biotechnology companies track essential KPIs. This dashboard allows businesses to monitor performance in real-time, compare actual data with targets, and make data-driven decisions for process improvements.
Key Features of the Biotechnology KPI Dashboard in Google Sheets
Before diving into the specifics of the KPIs, let’s first understand the key features of this dashboard template:
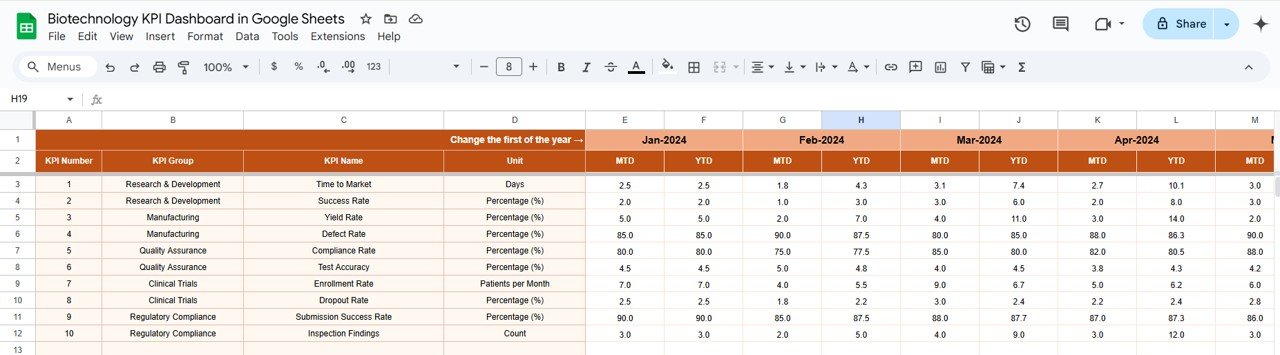
1. Dashboard Sheet Tab
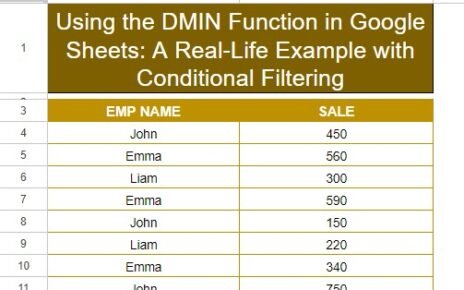
This is the main sheet where all the KPI data is displayed. Key features include:
-
MTD (Month-to-Date) Actual vs Target: Displays the current month’s data against the target.
-
YTD (Year-to-Date) Actual vs Target: Shows a cumulative view of the year’s performance.
-
Previous Year Comparison: Compares the current year’s data with the same period in the previous year, using conditional formatting (up or down arrows) for easy visual interpretation.
-
Dynamic Month Selection: Use the drop-down menu (in Range D3) to select the month, and the data in the dashboard will automatically update.
Click to buy Biotechnology KPI Dashboard in Google Sheets
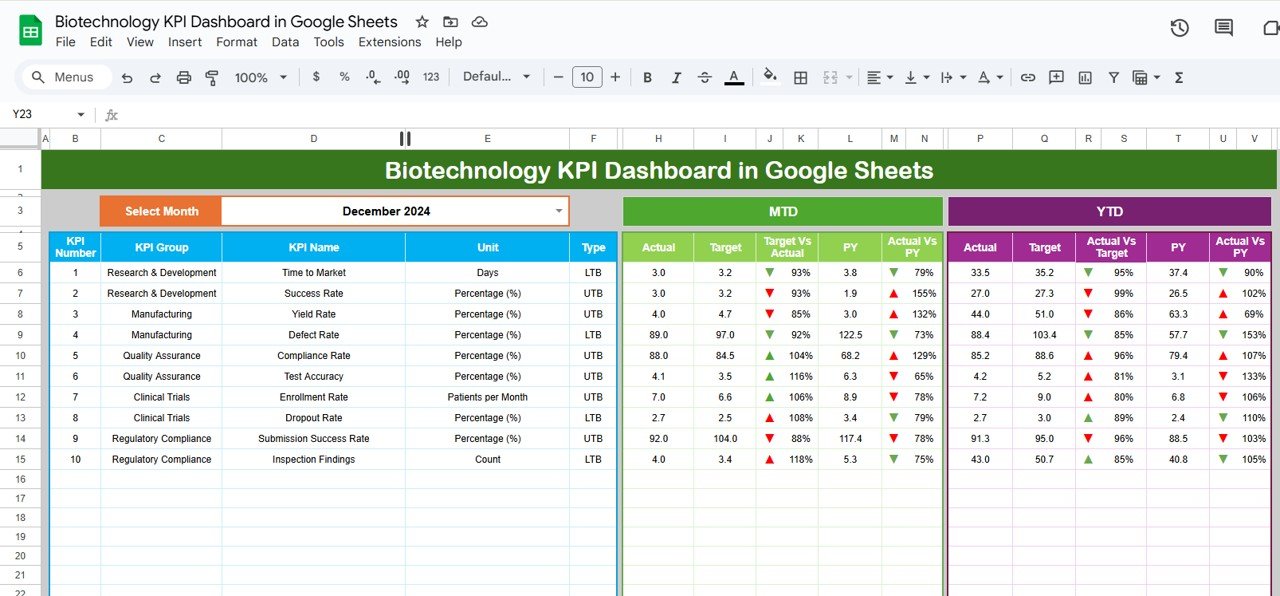
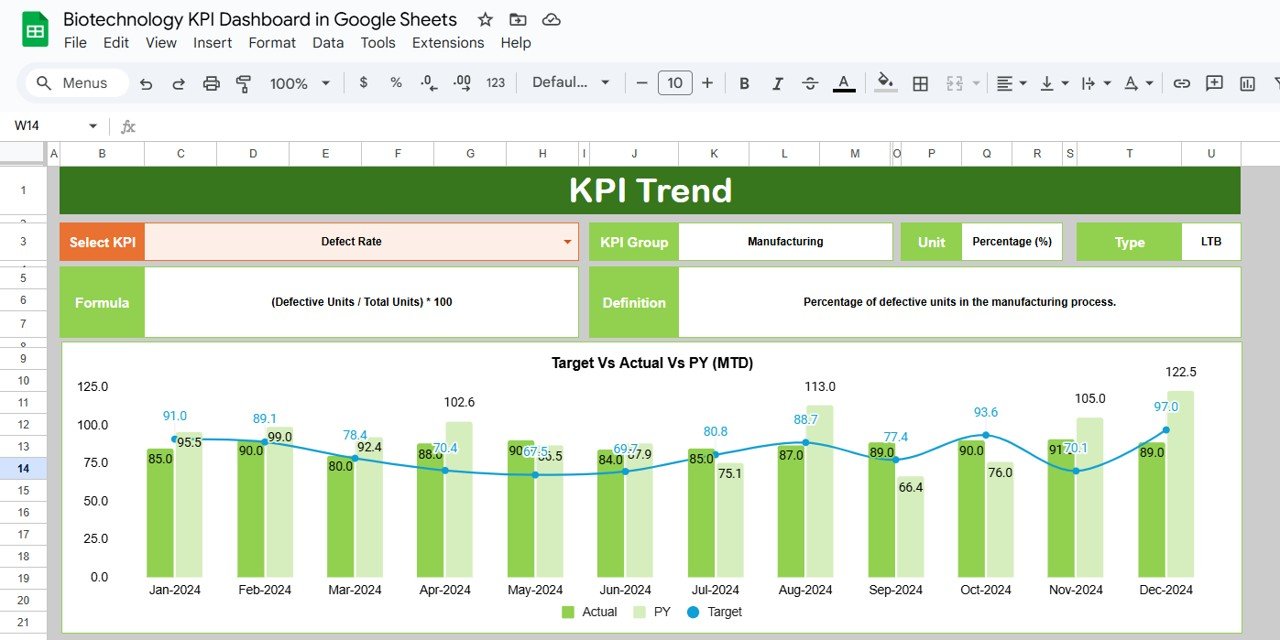
2. KPI Trend Sheet Tab
In this tab, you can select a KPI name from the drop-down list (available in Range C3). Each KPI is displayed with the following details:
-
KPI Group
-
Unit of Measure
-
KPI Type (Lower the Better or Upper the Better)
-
Formula to Calculate the KPI
-
KPI Definition
Click to buy Biotechnology KPI Dashboard in Google Sheets
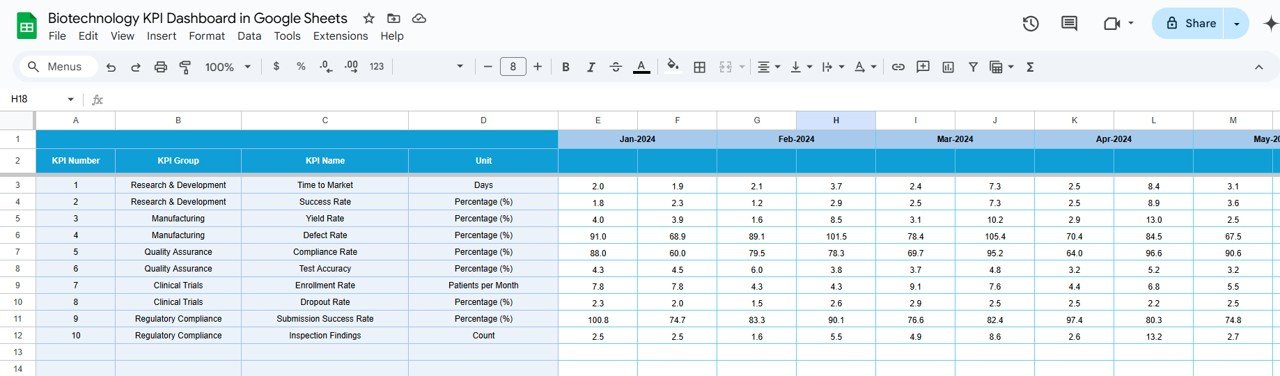
3. Actual Numbers Sheet Tab
Here, you can enter the actual numbers for MTD and YTD. Select the month from the drop-down menu (Range E1) and input the numbers for that month. The data will automatically adjust.
4. Target Sheet Tab
In this tab, you enter the target values for each KPI for both MTD and YTD. This helps track performance against goals.
Click to buy Biotechnology KPI Dashboard in Google Sheets
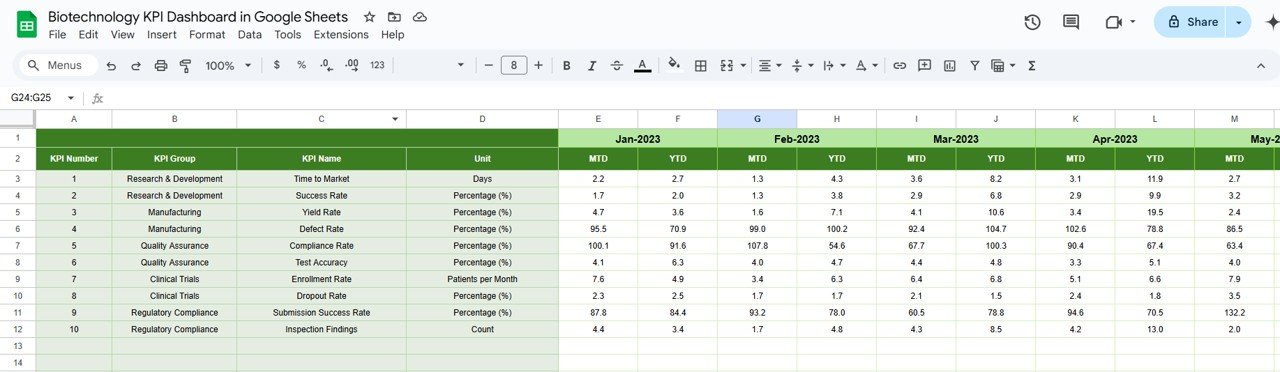
5. Previous Year Numbers Sheet Tab
This tab holds the previous year’s data, allowing for year-over-year comparisons. Enter the same type of data as the current year for accurate analysis.
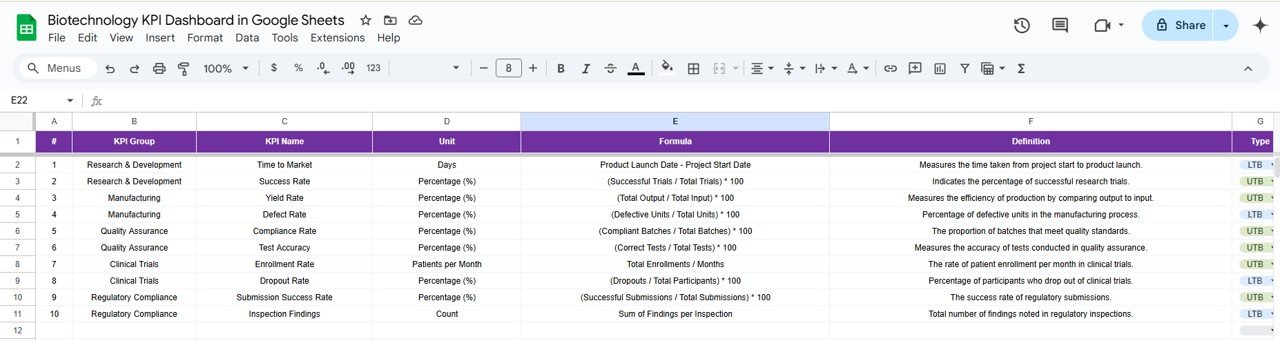
6. KPI Definition Sheet Tab
In this sheet, you define each KPI with the following details:
-
KPI Name
-
KPI Group
-
Unit of Measure
-
Formula Used to Calculate the KPI
-
KPI Definition
Click to buy Biotechnology KPI Dashboard in Google Sheets
Advantages of Using the Biotechnology KPI Dashboard in Google Sheets
The Biotechnology KPI Dashboard in Google Sheets offers several advantages for businesses in the biotechnology industry:
-
Real-Time Data Tracking: Monitor key performance indicators in real time, enabling quicker decision-making and efficient management.
-
Comprehensive Overview: The dashboard consolidates all essential KPIs in one place, providing a comprehensive view of production, quality, and compliance.
-
Customizable Template: You can easily adjust the KPIs, formulas, and targets based on your specific business needs.
-
Cost-Effective: Google Sheets is free to use, making this solution affordable for businesses of any size.
-
Collaboration Features: Google Sheets allows for easy sharing and collaboration, making it easier to keep everyone updated on performance.
Opportunities for Improvement in the Biotechnology KPI Dashboard
Click to buy Biotechnology KPI Dashboard in Google Sheets
While the Biotechnology KPI Dashboard in Google Sheets is a powerful tool, there are always opportunities to improve its functionality:
Automated Data Entry
-
Current Challenge: Manual data entry can be time-consuming and prone to error.
-
Opportunity: Integrate the dashboard with other systems like ERP or laboratory information management systems (LIMS) to automate data collection and entry.
Enhanced Visualizations
-
Current Challenge: The current dashboard may not be visually engaging for all users.
-
Opportunity: Add advanced visualizations like sparklines, bar charts, and pie charts to make the data more visually appealing and easy to interpret.
Advanced Reporting Features
-
Current Challenge: The dashboard provides basic reporting options.
-
Opportunity: Implement advanced reporting features such as automated report generation, customizable templates, and export to PDF or email.
Best Practices for Using the Biotechnology KPI Dashboard
Click to buy Biotechnology KPI Dashboard in Google Sheets
To maximize the effectiveness of the Biotechnology KPI Dashboard in Google Sheets, consider these best practices:
-
Update Data Regularly: Ensure the dashboard is updated frequently to reflect the latest production and performance data.
-
Use Consistent Naming Conventions: Maintain consistency in naming KPIs, units, and formulas to avoid confusion and ensure clarity in reporting.
-
Set Realistic Targets: Set achievable targets based on historical performance data to drive improvements without overwhelming the team.
-
Encourage Collaboration: Share the dashboard with relevant team members to foster collaboration and ensure everyone is aligned on performance goals.
-
Leverage Conditional Formatting: Use color coding and conditional formatting to visually highlight performance trends and make data interpretation easier.
Conclusion
The Biotechnology KPI Dashboard in Google Sheets is an essential tool for tracking performance in the biotechnology industry. By using this template, businesses can efficiently monitor key metrics such as production efficiency, recovery rates, and regulatory compliance, leading to better decision-making and improved performance.
Frequently Asked Questions (FAQs)
Click to buy Biotechnology KPI Dashboard in Google Sheets
What is a KPI in the biotechnology industry?
A KPI (Key Performance Indicator) is a measurable value that demonstrates how effectively a company is achieving its business objectives. In biotechnology, KPIs could include production efficiency, recovery rate, and regulatory compliance.
How can I customize my Biotechnology KPI Dashboard?
You can easily customize the dashboard by adding or removing KPIs, adjusting formulas, and changing data sources based on your specific needs.
How do I enter data into the Biotechnology KPI Dashboard?
Data for actual numbers (MTD, YTD), targets, and previous year comparisons can be entered into the relevant tabs. Simply update the data for each month to keep the dashboard up to date.
Can I automate data entry in the dashboard?
Yes, you can integrate Google Sheets with other systems like ERP or laboratory management software to automate data entry and reduce manual effort.
What KPIs should I track in the biotechnology industry?
Key KPIs in the biotechnology industry include production efficiency, recovery rate, regulatory compliance, time to market, and cost of goods sold (COGS).
Visit our YouTube channel to learn step-by-step video tutorials
Youtube.com/@NeotechNavigators
Watch the step-by-step video Demo: