Introduction
The Call Abandonment Rate KPI Dashboard in Google Sheets is a comprehensive and ready-to-use template designed to help businesses monitor, analyze, and improve their call handling efficiency. Call abandonment rate is a vital Key Performance Indicator (KPI) that measures the percentage of calls that are terminated by the customer before reaching a service agent. Keeping track of this KPI is essential to ensure customer satisfaction and operational efficiency.Call Abandonment Rate KPI Dashboard in Google Sheets
Key Features of Call Abandonment Rate KPI Dashboard in Google Sheets
- Easy month selection with dynamic data update.
- Displays both Month-To-Date (MTD) and Year-To-Date (YTD) actuals, targets, and previous year values.
- Conditional formatting with up/down arrows to visually track performance compared to targets and previous year.
- Comprehensive trend analysis for KPIs through interactive charts.
- Intuitive input sheets for easy data entry of actuals, targets, and previous year’s performance.
- Detailed KPI definitions including formula and type (Lower the Better or Upper the Better) for clarity.
Dashboard Pages Explanation
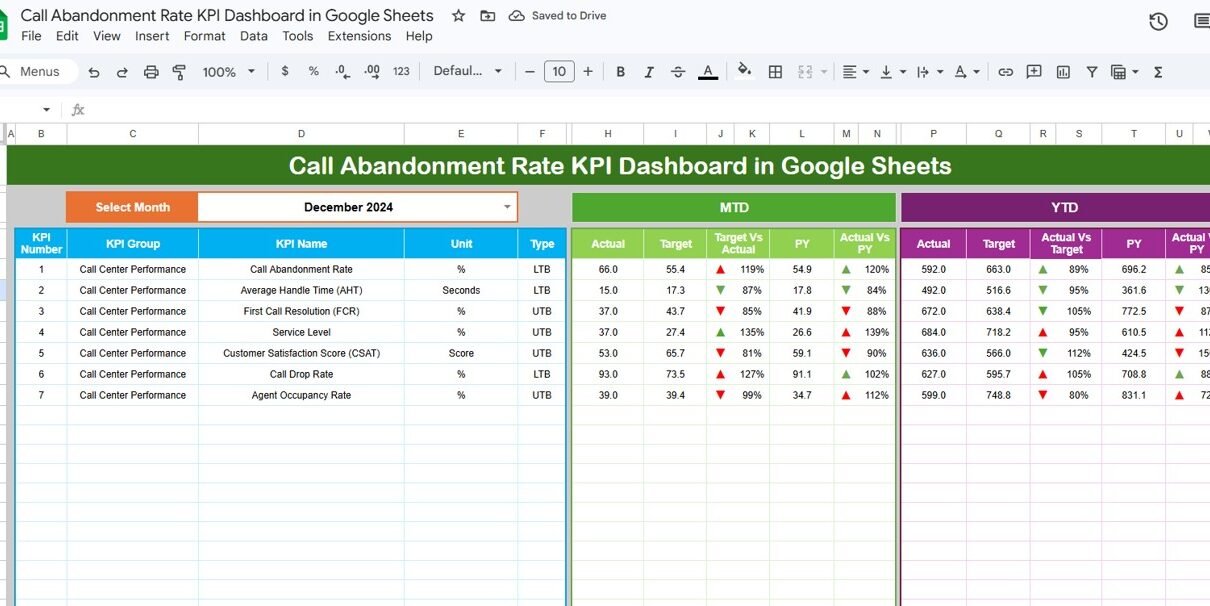
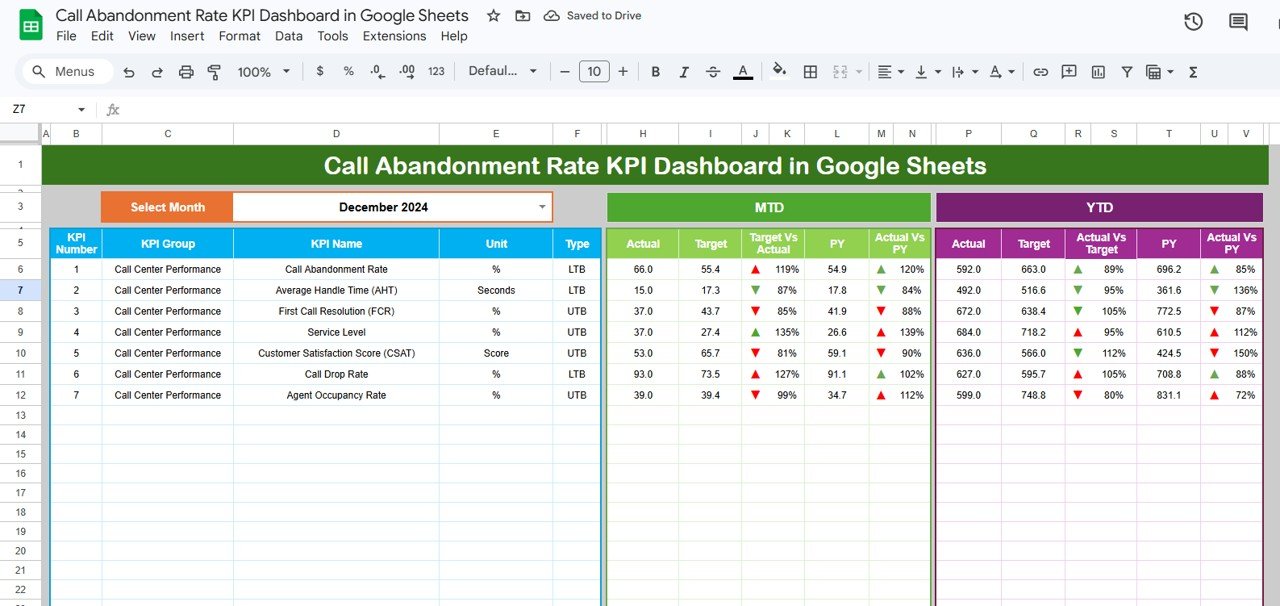
1. Dashboard Sheet Tab
This tab acts as the heart of the dashboard where all key metrics and comparisons are shown beautifully. You can select the month via a drop-down at cell D3, and the entire dashboard updates accordingly. The sheet displays:
- MTD Actual, Target, Previous Year data.
- Comparisons of Target vs Actual and PY vs Actual using conditional formatting and up/down arrows.
- YTD Actual, Target, Previous Year data with similar comparative visuals.
Click to Buy Call Abandonment Rate KPI Dashboard in Google Sheets
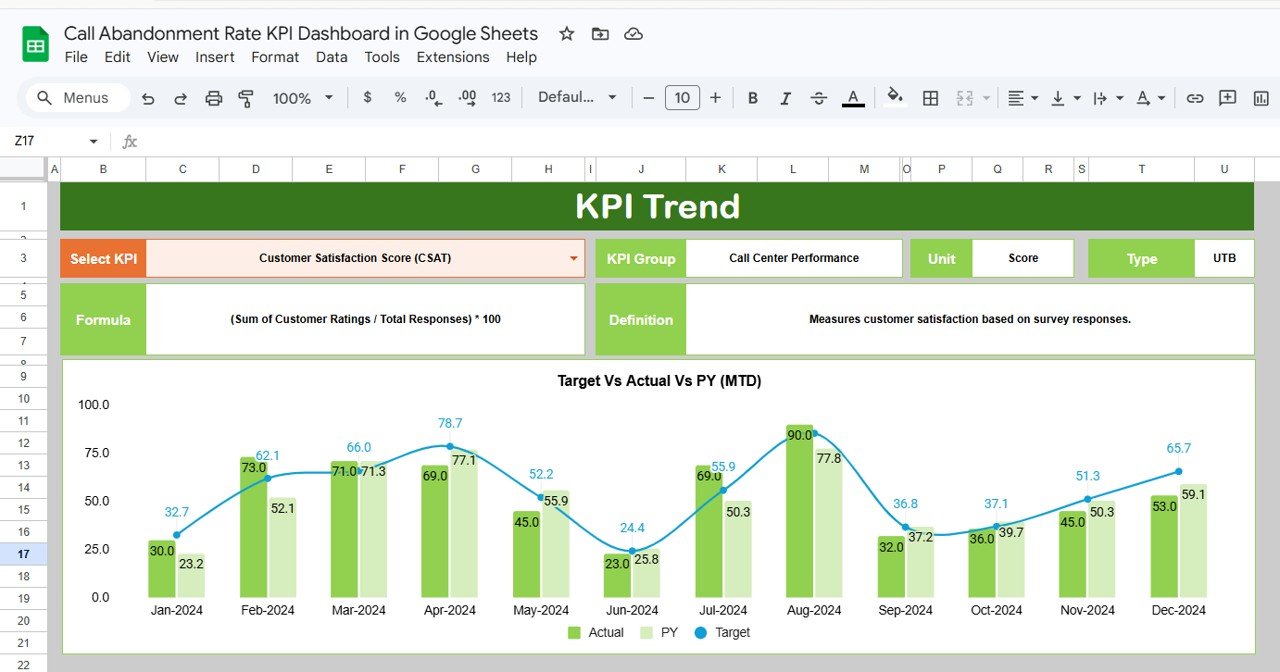
2. KPI Trend Sheet Tab
This sheet lets you analyze the trends of any KPI you select from the dropdown located at cell C3. It includes:Call Abandonment Rate KPI Dashboard in Google Sheets
- KPI Group classification.
- Unit of measurement.
- Type of KPI – whether lower values are better (LTB) or upper values are better (UTB).
- Formula used to calculate the KPI.
- Detailed KPI definition.
- MTD and YTD trend charts showcasing Actual, Target, and Previous Year values for insightful visual tracking.
Click to Buy Call Abandonment Rate KPI Dashboard in Google Sheets
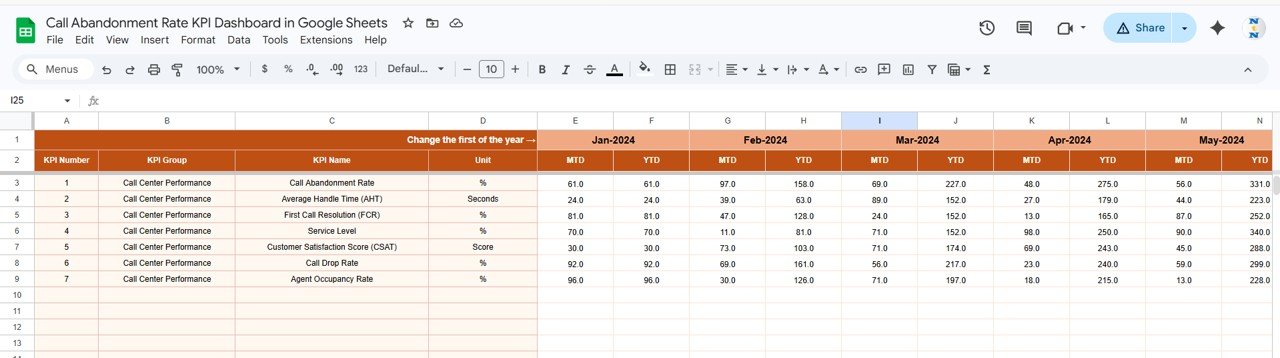
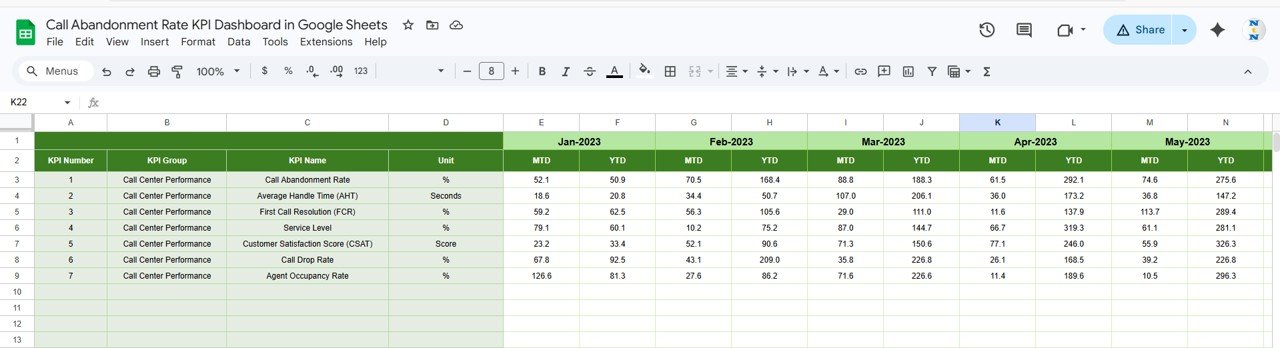
3. Actual Numbers Input Sheet
This sheet is dedicated to inputting actual performance numbers for both MTD and YTD for selected months. You can modify the starting month by changing the value in cell E1. This dynamic entry system helps keep the dashboard always current with the data you have collected.
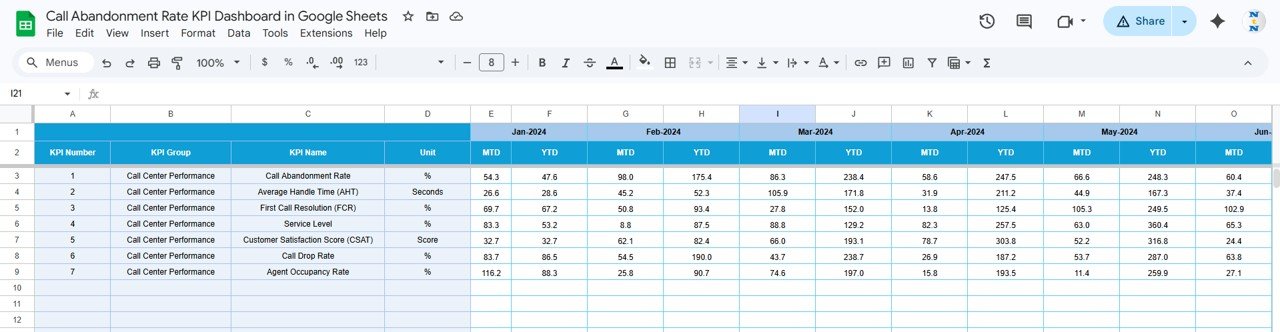
4. Target Number Input Sheet
Targets can be set for each KPI on a monthly basis here for both MTD and YTD. This sheet helps in defining your expected performance benchmarks. These inputs are used throughout the dashboard for comparison purposes.
Click to Buy Call Abandonment Rate KPI Dashboard in Google Sheets
5. Previous Year Number Sheet Tab
To establish year-over-year comparisons, this sheet stores previous year’s actual data for each KPI monthly. Enter your previous year’s data similarly as you do for the current year to enable comparative insights.
6. KPI Definition Sheet Tab
This tab captures fundamental details of each KPI including:
- KPI Name
- KPI Group
- Measurement Unit
- KPI Formula
- KPI Definition
- KPI type indicating if lower or upper values are more favorable (LTB or UTB)

Click to Buy Call Abandonment Rate KPI Dashboard in Google Sheets
Advantages of Call Abandonment Rate KPI Dashboard in Google Sheets
- Real-Time Analysis: Easily track monthly and yearly trends instantly by adjusting dropdowns.
- User-Friendly Interface: Intuitive layouts with dropdown selections and pre-configured formulas eliminate manual calculations.
- Accessibility: Cloud-based Google Sheets enables remote access and collaboration across teams.
- Visual Insights: Conditional formatting and charts enhance quick understanding of performance gaps and successes.
- Comprehensive Data Management: Separate sheets for actuals, targets, and definitions maintain data integrity and clarity.
Opportunities for Improvement
Click to Buy Call Abandonment Rate KPI Dashboard in Google Sheets
- Incorporate automated alerts or notifications when KPIs fall below a critical threshold.
- Integrate with VOIP or call center software for automatic data pulls, reducing manual input.
- Add comparative visualizations such as heatmaps or KPI distribution for advanced insights.
- Provide customizable dashboards per department or agent level for more granular tracking.
- Expand KPI definitions with links to external resources or embedded video tutorials.
Best Practices
Click to Buy Call Abandonment Rate KPI Dashboard in Google Sheets
- Update actual numbers regularly to maintain data accuracy.
- Set achievable and realistic target numbers to motivate better performance.
- Use trend analysis sheets to identify seasonal or operational fluctuations.
- Document changes in KPI calculation or business processes within the KPI definition sheet to preserve clarity.
- Leverage conditional formatting wisely to avoid overwhelming users with too many visual cues.
FAQs
What is the Call Abandonment Rate KPI Dashboard?
It is a Google Sheets template designed to monitor metrics related to calls abandoned before being answered, providing insights into call center performance.
Can I customize the dashboard for other KPIs?
Yes, the template is structured to allow adding and modifying KPIs, their definitions, and formulas.
How frequently should I update the data?
Ideally, update the actual and target numbers monthly or as soon as new data becomes available for accurate tracking.
Does this dashboard require advanced Excel or Sheets skills?
No, it is designed to be user friendly with dropdowns and automated calculations, requiring minimal technical expertise.
Is this dashboard shareable with my team?
Yes, since it is built on Google Sheets, you can easily share and collaborate with your team members online.
Conclusion
Click to Buy Call Abandonment Rate KPI Dashboard in Google Sheets
The Call Abandonment Rate KPI Dashboard in Google Sheets is an essential tool for businesses looking to improve their call center efficiency by tracking and analyzing call abandonment rates dynamically. With its intuitive design, comprehensive analytical features, and visually rich interface, organizations can drive targeted improvements and enhance customer satisfaction. This dashboard combines ease of use with powerful data insights, making it a must-have for call management professionals.
For more dynamic tools and templates, you can explore Google Sheets Support for official resources.
Visit our YouTube channel to watch the demo.
Click to Buy Call Abandonment Rate KPI Dashboard in Google Sheets