
In the construction industry, tracking and managing performance metrics is crucial to ensuring successful project completion. A Construction KPI Dashboard in Google Sheets can streamline the process, providing a centralized, real-time view of key metrics. By using such a dashboard, project managers can monitor project performance, optimize resources, and ensure that deadlines and budget constraints are met. This article explores the Construction KPI Dashboard in Google Sheets, its features, the benefits it provides, and best practices for its usage.
Table of Contents
ToggleWhat is a Construction KPI Dashboard in Google Sheets?
A Construction KPI Dashboard in Google Sheets is a template designed to track and visualize key performance indicators (KPIs) for construction projects. This dashboard provides insights into various aspects of construction operations, such as cost management, time management, quality, and safety. With Google Sheets’ cloud-based capabilities, this dashboard allows project stakeholders to collaborate in real time, making it easier to track and analyze project performance from anywhere.
Key Features of the Construction KPI Dashboard in Google Sheets
The Construction KPI Dashboard in Google Sheets comes with six different worksheets, each serving a distinct purpose to manage the data for KPIs. Let’s go over the features of each sheet and how they contribute to the dashboard’s functionality.
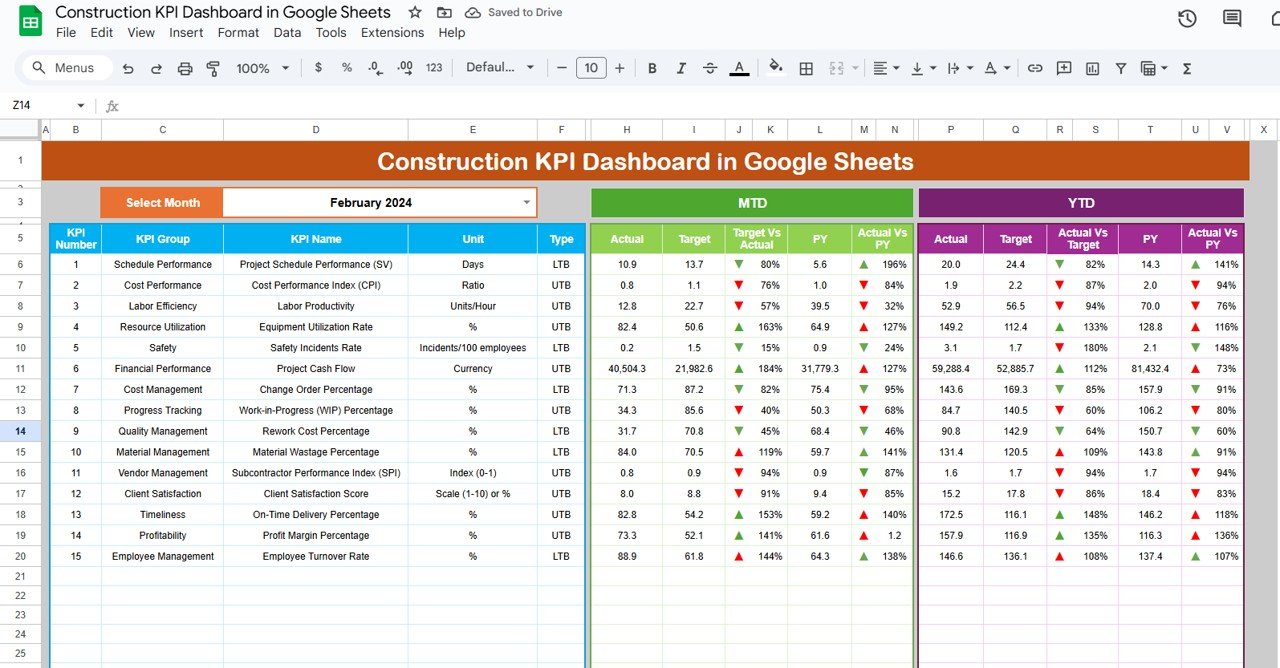
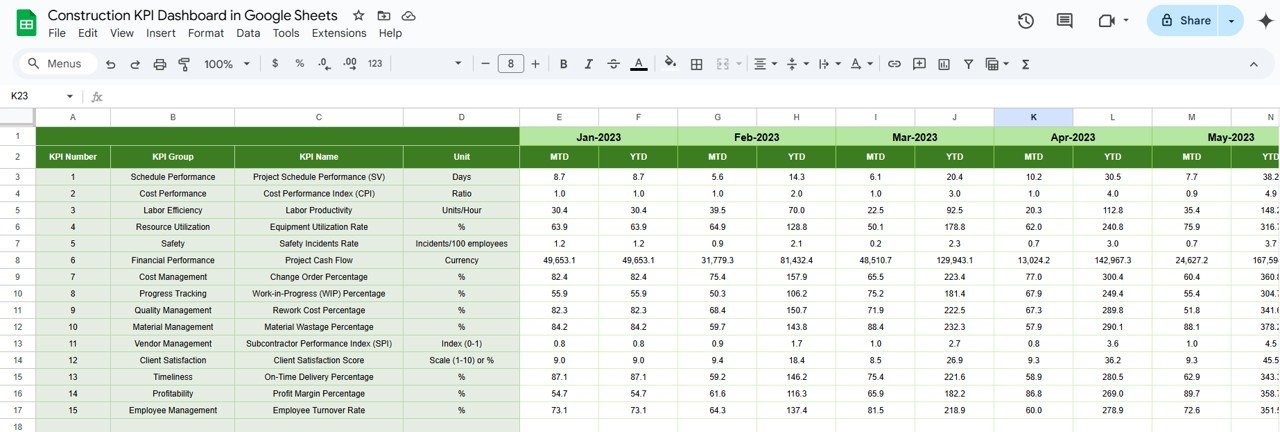
1. Dashboard Sheet Tab: Centralized KPI Overview
The Dashboard Sheet serves as the main sheet where all the KPI information is displayed. This sheet provides an at-a-glance overview of the project’s performance for a specific month.
Click to buy Construction KPI Dashboard in Google Sheets
Key Features:
- Month Selector: On cell D3, you can select the month from a dropdown. The entire dashboard will automatically update to reflect the data for that month.
- MTD (Month-To-Date) and YTD (Year-To-Date) Data: The dashboard displays MTD and YTD data, including actual values, targets, and previous year data.
- Target vs. Actual Comparison: Conditional formatting is used to display up and down arrows to show whether the current performance is above or below the target.
- PY (Previous Year) vs. Actual: This section compares the current year’s data with the previous year’s data, providing insights into year-over-year performance.

Click to buy Construction KPI Dashboard in Google Sheets
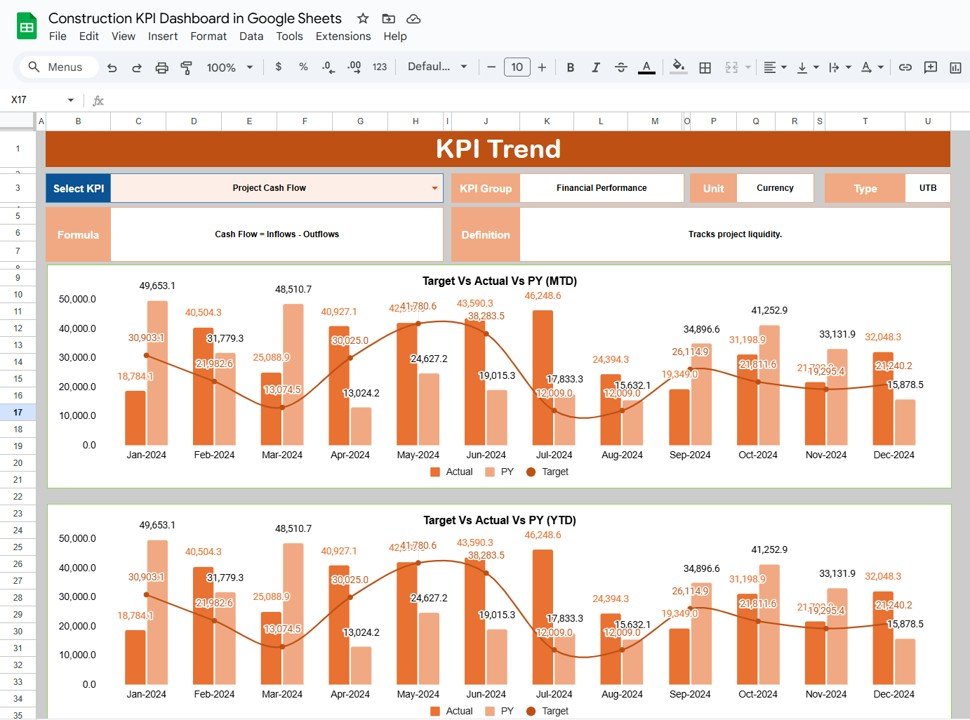
2. KPI Trend Sheet Tab: Tracking Performance Over Time
The KPI Trend Sheet allows users to track the performance of specific KPIs over time.
Key Features:
- KPI Selection: You can select a KPI name from the dropdown menu in C3.
- KPI Group: The sheet displays the group/category of the selected KPI (e.g., safety, time, cost).
- KPI Unit and Type: Each KPI is associated with a specific unit of measurement and a type (e.g., “Lower the Better” or “Upper the Better”).
- KPI Formula and Definition: The sheet also provides the formula used to calculate the KPI and a definition to ensure everyone understands its meaning.

Click to buy Construction KPI Dashboard in Google Sheets
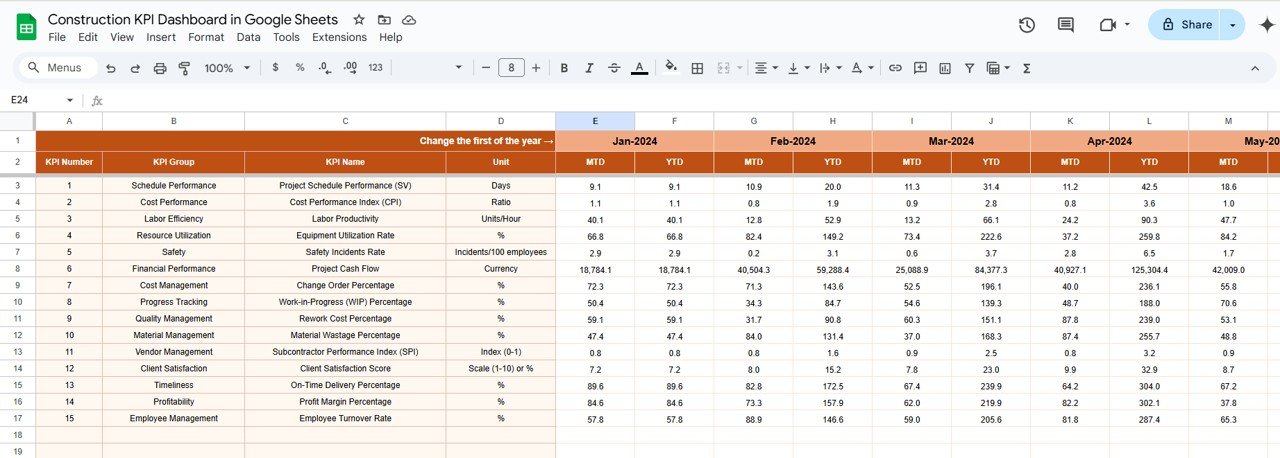
3. Actual Numbers Sheet Tab: Enter Actual Data
The Actual Numbers Sheet is where you enter the actual performance data for both MTD and YTD, for a specific month.
Key Features:
- Month Selector: The month can be adjusted in E1, which then updates the data for the selected month.
- MTD and YTD Data: The sheet captures actual performance data for both MTD and YTD values, allowing for real-time tracking of the project’s progress.

Click to buy Construction KPI Dashboard in Google Sheets
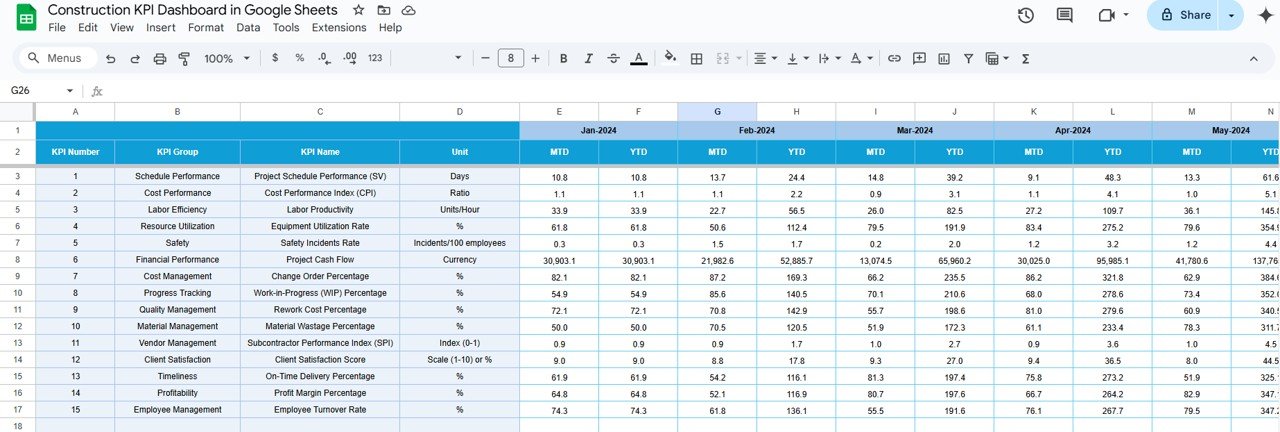
4. Target Sheet Tab: Enter Target Data
In the Target Sheet, you can enter the target values for each KPI.
Key Features:
- KPI Targets: Enter target values for each KPI, both for MTD and YTD.
- Month Selector: Like the actual numbers sheet, this sheet allows you to choose the month and update the target values accordingly.

Click to buy Construction KPI Dashboard in Google Sheets
5. Previous Year Numbers Sheet Tab: Historical Data Comparison
The Previous Year Numbers Sheet allows you to enter the same data for the previous year to facilitate comparison.
Key Features:
- Comparison with Current Year: By entering the previous year’s values for MTD and YTD, you can compare the current year’s performance against historical data.
Click to buy Construction KPI Dashboard in Google Sheets
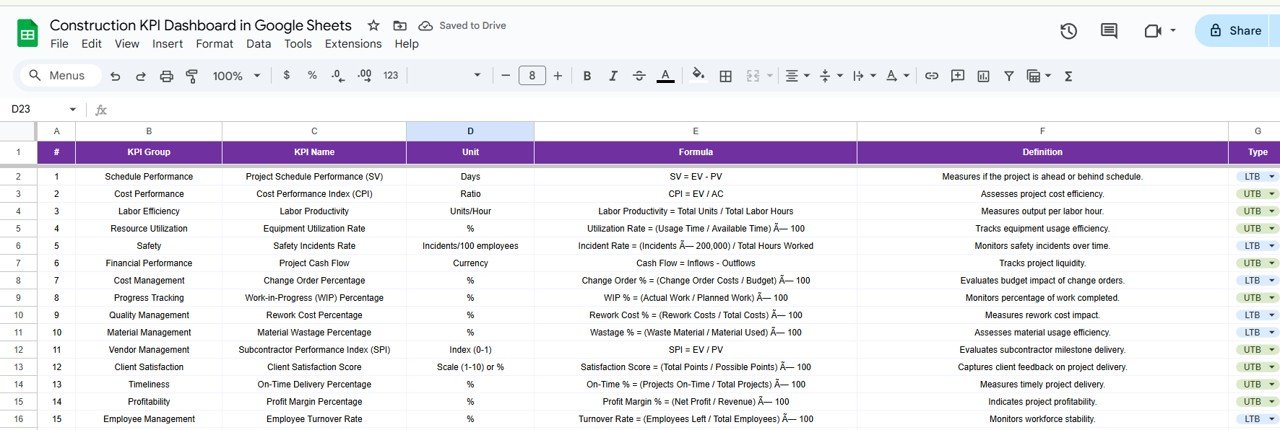
6. KPI Definition Sheet Tab: Detailed KPI Information
The KPI Definition Sheet holds detailed information about each KPI.
Key Features:
- KPI Name, Group, Unit, and Formula: This sheet contains columns for each KPI’s name, group/category, unit of measurement, and the formula used to calculate it.
- KPI Definition: It also provides a clear definition of each KPI to ensure proper understanding and usage.

Click to buy Construction KPI Dashboard in Google Sheets
Advantages of Using a Construction KPI Dashboard in Google Sheets
A Construction KPI Dashboard in Google Sheets offers several significant advantages for construction managers, project stakeholders, and other involved parties.
- Real-Time Monitoring and Analysis: Google Sheets allows real-time collaboration, which means all project team members can input, view, and analyze KPI data simultaneously. This helps in tracking performance live and allows for quick decision-making.
- Improved Collaboration: Since Google Sheets is cloud-based, all project stakeholders can access the dashboard from anywhere. This makes it easy for teams, including project managers, contractors, and clients, to stay updated on the project’s progress.
- Easy Customization: The dashboard is highly customizable. You can add or remove KPIs, adjust formulas, and modify the layout to suit your project’s needs. Whether you’re managing a small project or a large-scale construction effort, this dashboard can be tailored to fit.
- Cost-Effective Solution: Since Google Sheets is free to use and easily accessible, it provides a cost-effective solution for managing KPIs. There’s no need for expensive software or subscriptions to track and monitor project performance.
- Accessibility: The dashboard can be accessed from any device with an internet connection, making it convenient for on-site teams to update data directly from the construction site.
Opportunity for Improvement in the Construction KPI Dashboard
While the Construction KPI Dashboard in Google Sheets offers valuable features, there are several opportunities for improvement that could enhance its functionality and usefulness:
- Mobile App Integration: Integrating the dashboard with a mobile app could provide even easier access for construction teams on the go. This would allow real-time data entry and monitoring from smartphones or tablets, further improving collaboration.
- Enhanced Reporting Features: Adding features like automated report generation and export options would streamline the process of sharing performance updates with stakeholders. Users could generate monthly or quarterly reports with just a few clicks.
- Data Visualization Enhancements: While Google Sheets offers basic data visualizations, integrating more advanced charts and graphs (like interactive Gantt charts or 3D pie charts) could provide better visual context and easier analysis of KPI performance.
- Automated Alerts: Introducing an automated alert system that notifies stakeholders when a KPI falls outside of the target range could help ensure immediate corrective action is taken. This would improve response time to performance issues.
Best Practices for Using the Construction KPI Dashboard
Click to buy Construction KPI Dashboard in Google Sheets
To maximize the effectiveness of your Construction KPI Dashboard, here are some best practices to follow:
- Regular Data Updates: It’s important to update the dashboard regularly with accurate data to ensure that the KPIs reflect the most current performance. Make it a habit to update the data weekly or bi-weekly, depending on the project timeline.
- Focus on Relevant KPIs: Not all KPIs are equally important for every project. Choose the KPIs that best reflect the specific needs and objectives of your project. This will allow you to focus on the metrics that matter most.
- Engage Stakeholders: Make sure all stakeholders are aware of the dashboard and understand how to use it. Training sessions can ensure that everyone is aligned on how to interpret and act on the data presented in the dashboard.
- Monitor Trends: Don’t just focus on individual data points. Track the trends over time to identify patterns that may indicate potential issues or improvements. Historical comparisons (e.g., current year vs. previous year) are a great way to spot these trends.
- Customize the Dashboard for Different Users: Different users may need different views of the data. Customize the dashboard for various roles (e.g., project managers, contractors, clients) so that each user has the information they need at a glance.
Conclusion
A Construction KPI Dashboard in Google Sheets is an invaluable tool for project managers and teams looking to track and improve the performance of their construction projects. By centralizing key metrics and providing real-time access, it enhances collaboration and decision-making across all stages of the project. With easy customization, real-time monitoring, and accessibility from anywhere, this dashboard is an ideal solution for improving the efficiency and effectiveness of construction projects.
Click to buy Construction KPI Dashboard in Google Sheets
Frequently Asked Questions (FAQ)
What KPIs should I include in my Construction KPI Dashboard?
Common KPIs include cost performance index (CPI), schedule performance index (SPI), labor productivity, safety incident rates, and project completion time.
Can I integrate the Construction KPI Dashboard with other software?
Yes, you can integrate the dashboard with other tools like project management software or time-tracking applications to enhance its functionality.
Is the Construction KPI Dashboard in Google Sheets free to use?
Yes, Google Sheets is a free tool, and the KPI dashboard template can be customized and used without additional cost.
Can the dashboard be accessed on mobile devices?
Yes, since Google Sheets is cloud-based, the dashboard can be accessed and updated on mobile devices with an internet connection.
How often should I update the data in the dashboard?
You should update the data at least once a week to keep the dashboard accurate and relevant. This ensures that you’re always working with the latest performance data
Visit our YouTube channel to learn step-by-step video tutorials
Youtube.com/@NeotechNavigators
Click to buy Construction KPI Dashboard in Google Sheets
Watch the step-by-step video Demo:
