In the fast-paced world of fashion, tracking performance using key performance indicators (KPIs) is essential for understanding business trends, improving decision-making, and driving growth. Whether you’re running a boutique, a fashion brand, or an online store, having a clear and accessible overview of how your business is performing is crucial. That’s where a Fashion KPI Dashboard in Google Sheets comes into play.
This article will take you through the process of setting up a Fashion KPI Dashboard in Google Sheets, detailing the key features, KPIs, and best practices for maximizing the effectiveness of your dashboard. We will cover various aspects, including the advantages, opportunities for improvement, and the best practices you should adopt for this tool. Finally, we will answer some frequently asked questions to ensure you get the most out of your Fashion KPI Dashboard.
Key Features of the Fashion KPI Dashboard in Google Sheets
The Fashion KPI Dashboard is a dynamic tool that offers real-time tracking of various KPIs crucial for any fashion business. The dashboard is composed of several worksheets designed to keep all your data organized, while allowing you to track and analyze your business performance efficiently.
1. Dashboard Sheet Tab
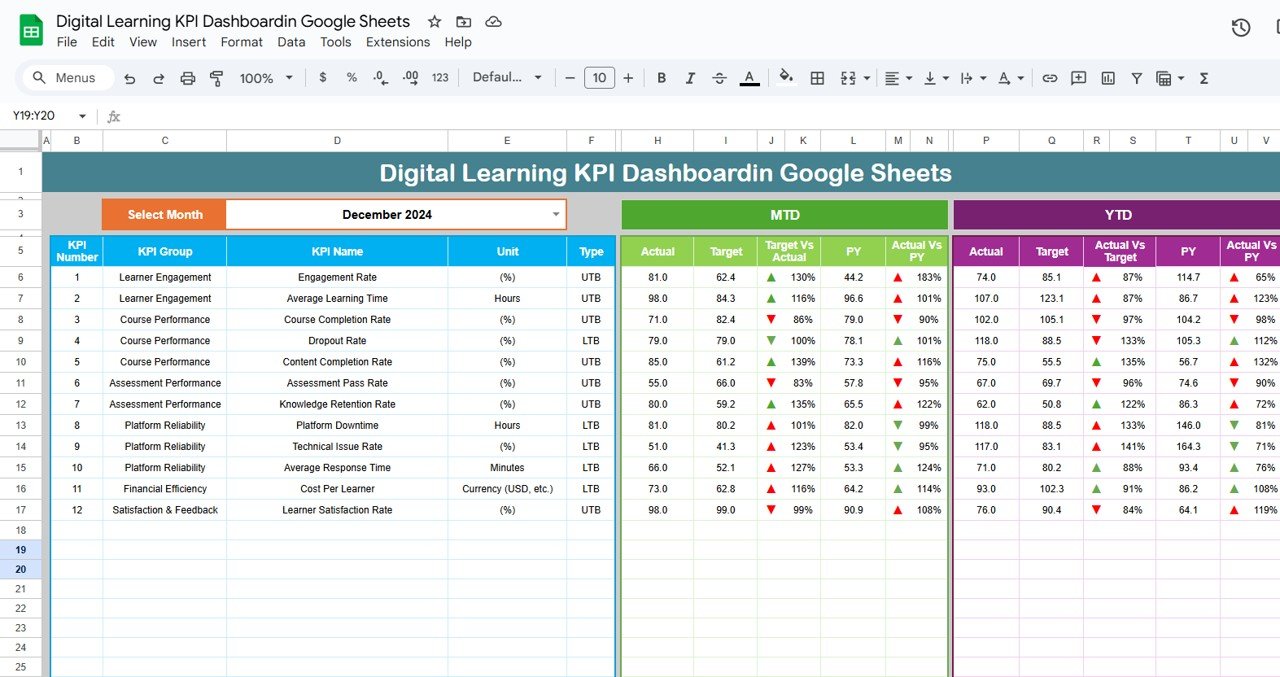
This is the main sheet of the Fashion KPI Dashboard. It acts as the central hub where all the KPIs are displayed. On this sheet, you will find:
-
Month Selector (D3): This dropdown allows you to select the month you’re tracking. All the dashboard data updates automatically to reflect the selected month’s KPIs.
-
KPIs Display: The sheet showcases Key Performance Indicators such as MTD (Month-to-Date), YTD (Year-to-Date), Actual, Target, and Previous Year data.
-
Conditional Formatting: It uses color-coded arrows to compare Actual vs. Target and Previous Year vs. Actual data. If your actual performance is above the target, you’ll see an up arrow (green), and if it’s below, a down arrow (red).

2. KPI Trend Sheet Tab
The KPI Trend Sheet allows you to track the progress of individual KPIs over time. Key features include:
-
KPI Selection (C3): From a dropdown list, you can select any KPI to monitor its performance trends.
-
KPI Information: Displays the KPI Group, Unit, Type (whether it’s ‘Lower the Better’ or ‘Upper the Better’), the formula used to calculate the KPI, and its definition. This helps clarify what each KPI means and how it is calculated.

3. Actual Numbers Sheet Tab
Here, you input the actual performance numbers for the KPIs, both for MTD and YTD. This data is essential for tracking real-time performance and updating the dashboard with the latest metrics. You can also select the specific month for data entry (E1) to ensure that the figures you input are aligned with the selected time frame.

4. Target Sheet Tab
This tab allows you to set your Target Numbers for each KPI for the month (MTD) and year (YTD). Entering your targets here ensures that you have a clear comparison between your goals and actual performance.

5. Previous Year Numbers Sheet Tab
Here, you can input the performance data from the previous year for comparison. Having this historical data allows you to perform a Year-over-Year (YoY) comparison, which is vital for understanding long-term trends and patterns.

6. KPI Definition Sheet Tab
This sheet serves as the detailed glossary for all the KPIs used in your dashboard. It includes the following columns:
-
KPI Name
-
KPI Group
-
Unit
-
Formula
-
Definition
This sheet acts as a reference guide, making it easy for anyone reviewing the dashboard to understand the metrics and their significance.

Advantages of the Fashion KPI Dashboard in Google Sheets
A Fashion KPI Dashboard brings many benefits to businesses in the fashion industry, including:
- Centralized Data Access: All relevant KPIs are available in one centralized location, reducing the time spent searching for data. This is particularly beneficial when tracking multiple stores, sales channels, or product categories.
- Real-Time Data Updates: Since the dashboard is linked with your data sheets, it automatically updates when new data is entered. This allows you to monitor performance in real-time, ensuring that your decisions are based on the most current information.
- Improved Decision-Making: With all KPIs visible in one place, managers and stakeholders can make informed decisions quickly. Whether it’s adjusting sales strategies or optimizing inventory, the dashboard provides all the insights needed for smarter decisions.
- Historical Performance Comparison: The inclusion of Previous Year Numbers allows businesses to track performance year-over-year, providing valuable insights into trends, growth patterns, and areas that need improvement.
Opportunities for Improvement in the Fashion KPI Dashboard
While the Fashion KPI Dashboard is a powerful tool, there are several areas where improvements can be made:
- Customizing KPIs for Specific Business Needs: The dashboard comes with predefined KPIs, but you may need to customize it to fit your specific business. This might include adding KPIs relevant to your fashion business model (e.g., eCommerce metrics, brand awareness, etc.).
- Automating Data Entry: Manually entering data into the dashboard can be time-consuming. Automating data entry through Google Forms or Google Scripts can save time and reduce errors.
- Integrating with Other Tools
Integrating your Google Sheets dashboard with other tools such as Google Analytics, Shopify, or Salesforce can bring even more depth to your analysis by automatically pulling in data from various platforms.
- Advanced Visualizations
While the dashboard currently uses basic color-coded arrows and tables, incorporating more advanced visualizations like graphs, heatmaps, or trendlines could enhance data interpretation and make the dashboard even more insightful.
Best Practices for Using a Fashion KPI Dashboard
To get the most out of your Fashion KPI Dashboard, follow these best practices:
1. Regularly Update the Data
Ensure that the data for both actual numbers and targets is updated regularly to maintain accuracy and relevance. Set up reminders to update your KPIs on a monthly basis.
2. Customize for Specific Needs
Don’t hesitate to modify the dashboard according to your specific fashion business needs. Add new KPIs, tweak formulas, or adjust the visualizations to match your goals.
3. Train Your Team
Ensure your team is familiar with how to use the dashboard and understand each KPI’s significance. Regular training ensures that the dashboard is used effectively for data-driven decision-making.
4. Analyze Trends, Not Just Data
Look for trends in your data rather than just reviewing the numbers. For instance, if your Return Rate is increasing, dig deeper to understand the root causes and take corrective actions.
5. Use It for Goal Setting
The Fashion KPI Dashboard should be used not just for tracking performance but also for setting clear and achievable business goals. Review your targets regularly to ensure alignment with your business objectives.
Frequently Asked Questions (FAQs)
1. What is a Fashion KPI Dashboard in Google Sheets?
A Fashion KPI Dashboard in Google Sheets is a template that helps businesses in the fashion industry track and visualize key performance indicators (KPIs). It’s a comprehensive tool that displays metrics related to sales, inventory, customer satisfaction, and more.
2. What KPIs should be tracked in the Fashion KPI Dashboard?
Common KPIs include Sales Growth, Average Order Value, Inventory Turnover Rate, Return Rate, Customer Retention Rate, and Gross Margin. These KPIs give businesses a clear view of their financial health, customer behavior, and inventory performance.
3. Can the Fashion KPI Dashboard be customized?
Yes, the dashboard can be fully customized to meet the unique needs of your fashion business. You can add new KPIs, change formulas, and modify the design to fit your specific goals.
4. How often should the data in the Fashion KPI Dashboard be updated?
To ensure accuracy, data should be updated regularly—preferably on a monthly basis—so that the dashboard reflects the most current performance metrics.
5. Can I integrate other tools with the Fashion KPI Dashboard?
Yes, you can integrate the dashboard with other tools like Google Analytics, Shopify, or Salesforce for a more comprehensive analysis.
Conclusion
The Fashion KPI Dashboard in Google Sheets is an essential tool for businesses in the fashion industry looking to streamline their performance tracking and make data-driven decisions. By monitoring key metrics such as Sales Growth, Customer Satisfaction, and Inventory Turnover, you gain valuable insights that can help guide your business strategies and improve overall performance. Whether you’re a fashion retailer, a boutique owner, or a brand manager, having a reliable and customizable dashboard can significantly enhance your decision-making process.
Watch the step-by-step video Demo:
Visit our YouTube channel to learn step-by-step video tutorials