Managing a fleet of vehicles requires continuous monitoring of fuel consumption, maintenance expenses, mileage performance, and vehicle utilization. However, many organizations still rely on scattered spreadsheets or manual reports to track fleet operations. As a result, fleet managers often struggle to analyze vehicle performance and operational costs effectively.
Therefore, organizations increasingly adopt data-driven fleet management dashboards to monitor fleet performance and reduce operational expenses. One powerful solution is the Fleet Management Dashboard in Google Sheets.
The Fleet Management Dashboard in Google Sheets is a ready-to-use analytics solution that helps organizations track vehicle activity, fuel costs, maintenance expenses, mileage trends, and fleet utilization in one centralized reporting system.
Because the dashboard uses interactive charts, slicers, and automated calculations, fleet managers can quickly identify operational issues and make better decisions.
In this article, you will learn everything about the Fleet Management Dashboard in Google Sheets, including its structure, features, advantages, best practices, and frequently asked questions.
What Is a Fleet Management Dashboard in Google Sheets?
A Fleet Management Dashboard in Google Sheets is an interactive reporting system designed to monitor fleet operations using data visualization and automated analytics.
The dashboard collects vehicle-related data such as:
- Vehicle ID
- Vehicle Type
- Fuel Type
- Department
- Region
- Maintenance Status
- Fuel Cost
- Maintenance Cost
- Mileage (Km)
- Fuel Efficiency
- Trips Completed
Once the data is entered, the dashboard automatically generates charts and KPIs to help managers analyze fleet performance.
As a result, organizations can track vehicle usage, control fuel expenses, and improve fleet efficiency.
Why Do Organizations Need a Fleet Management Dashboard?
Click to Buy Fleet Management Dashboard in Google Sheets
Fleet operations involve many variables such as fuel consumption, maintenance schedules, regional vehicle distribution, and operational costs.
Without proper monitoring, companies may face:
- High fuel expenses
- Unexpected maintenance costs
- Poor vehicle utilization
- Inefficient route planning
- Limited operational visibility
However, a fleet dashboard solves these problems by transforming raw data into clear visual insights.
Key Benefits
- Centralized fleet monitoring
- Cost control and expense tracking
- Improved operational efficiency
- Better maintenance planning
- Data-driven fleet decisions
Therefore, companies can optimize fleet performance and reduce operational risks.
Key Features of the Fleet Management Dashboard in Google Sheets
The Fleet Management Dashboard includes several interactive features that help users analyze fleet operations easily.
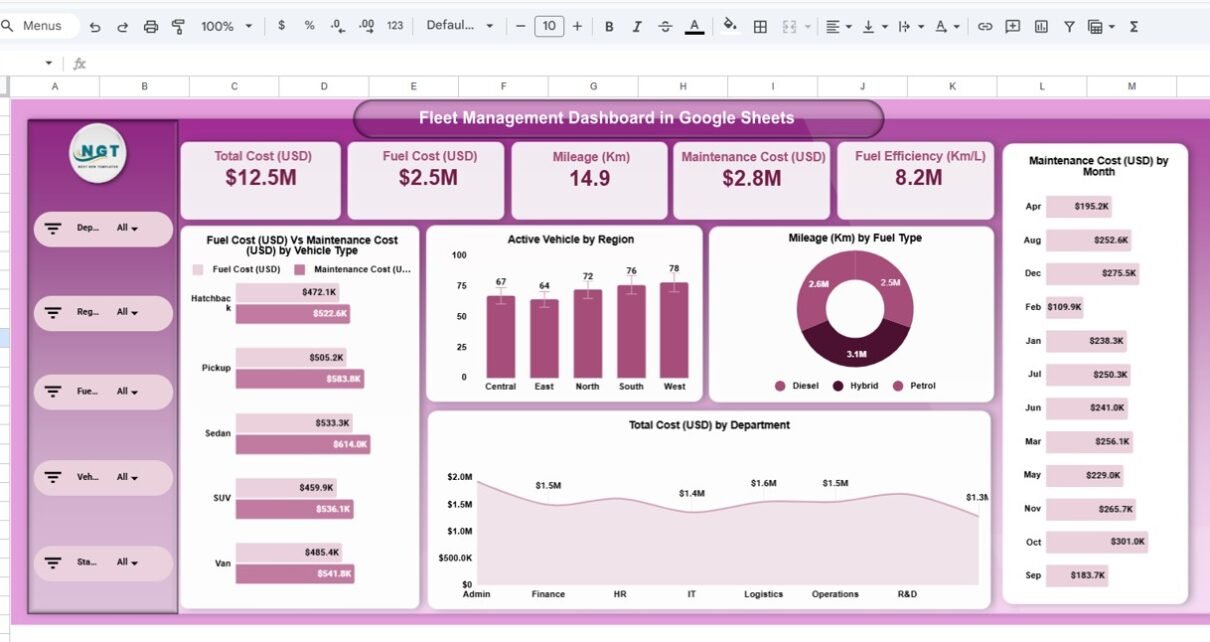
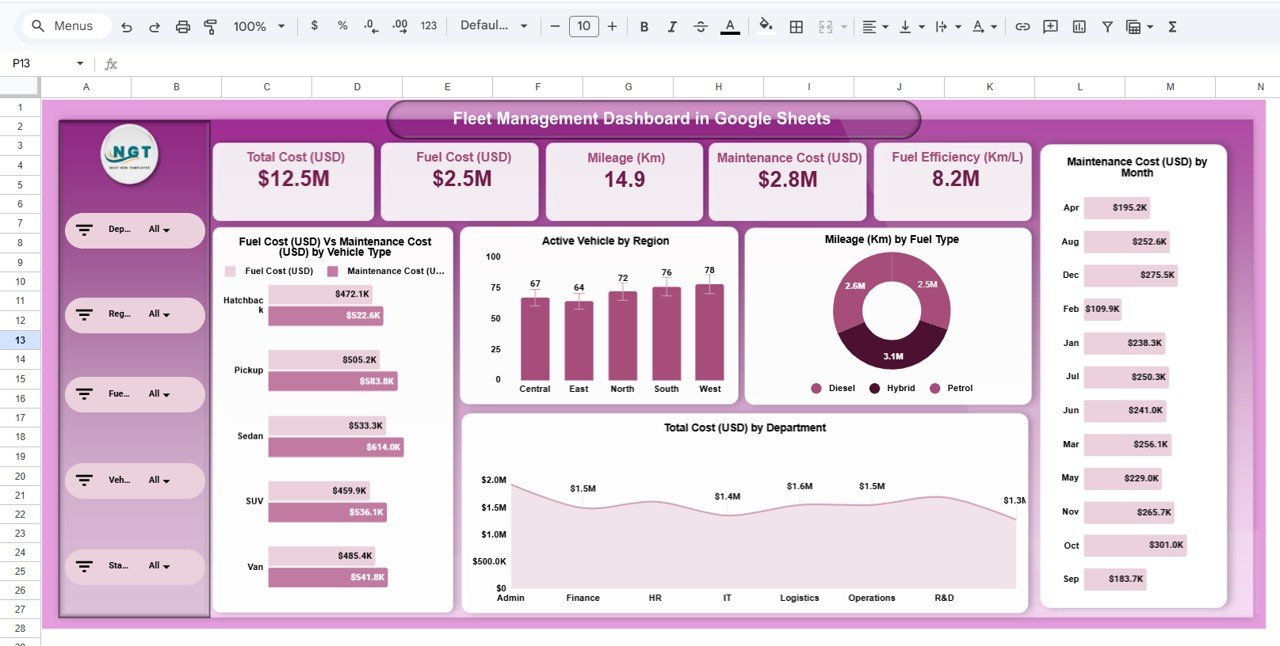
1. Overview Dashboard
The Overview Page provides a high-level summary of fleet performance.
Key KPI Cards
The dashboard displays important metrics such as:
-
Total Cost (USD)
-
Fuel Cost (USD)
-
Mileage (Km)
-
Maintenance Cost (USD)
-
Fuel Efficiency (Km/L)
These KPIs provide an instant overview of fleet performance.
Charts on the Overview Page
The overview dashboard includes several analytical charts:
-
Fuel Cost vs Maintenance Cost by Vehicle Type
-
Active Vehicles by Region
-
Mileage by Fuel Type
-
Maintenance Cost by Month
-
Total Cost by Department
Because these charts update automatically, fleet managers can quickly identify performance patterns.
Click to Buy Fleet Management Dashboard in Google Sheets
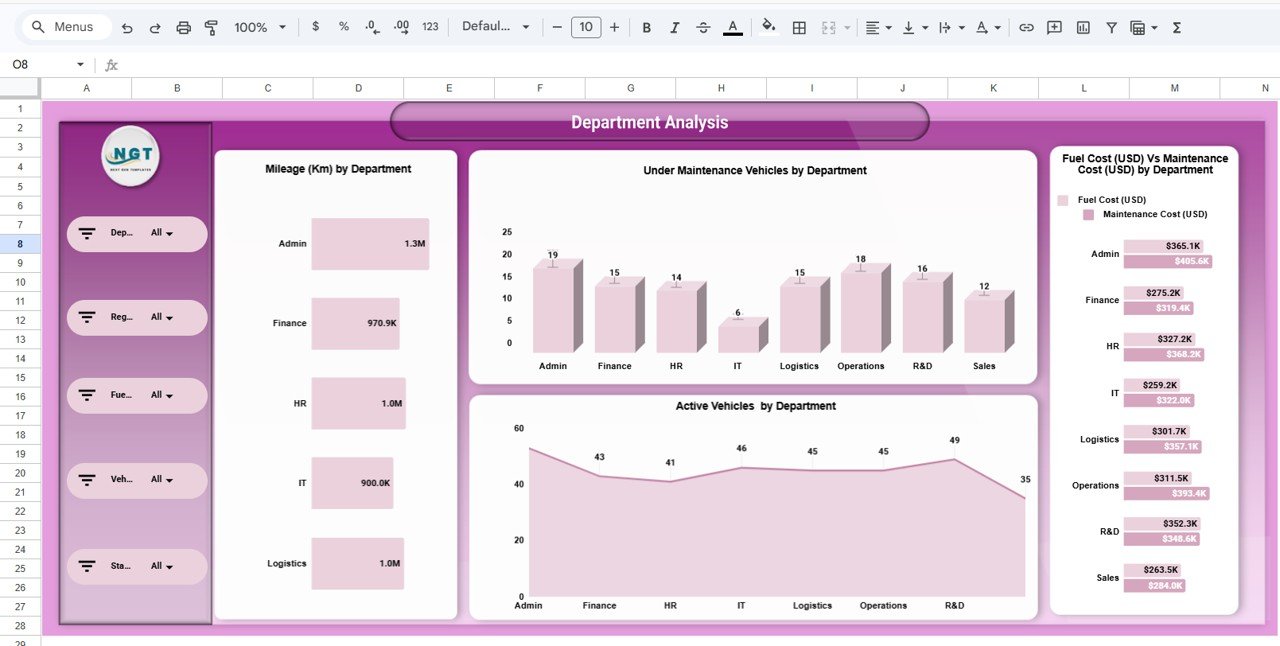
2. Department Analysis Dashboard
The Department Analysis Page focuses on how different departments use fleet vehicles.
Charts Included
-
Mileage by Department
-
Vehicles Under Maintenance by Department
-
Active Vehicles by Department
-
Fuel Cost vs Maintenance Cost by Department
Insights Provided
This page helps organizations understand:
-
Which departments use vehicles most frequently
-
Which departments generate higher maintenance costs
-
How fleet utilization differs across departments
Therefore, managers can allocate vehicles more effectively.
Click to Buy Fleet Management Dashboard in Google Sheets
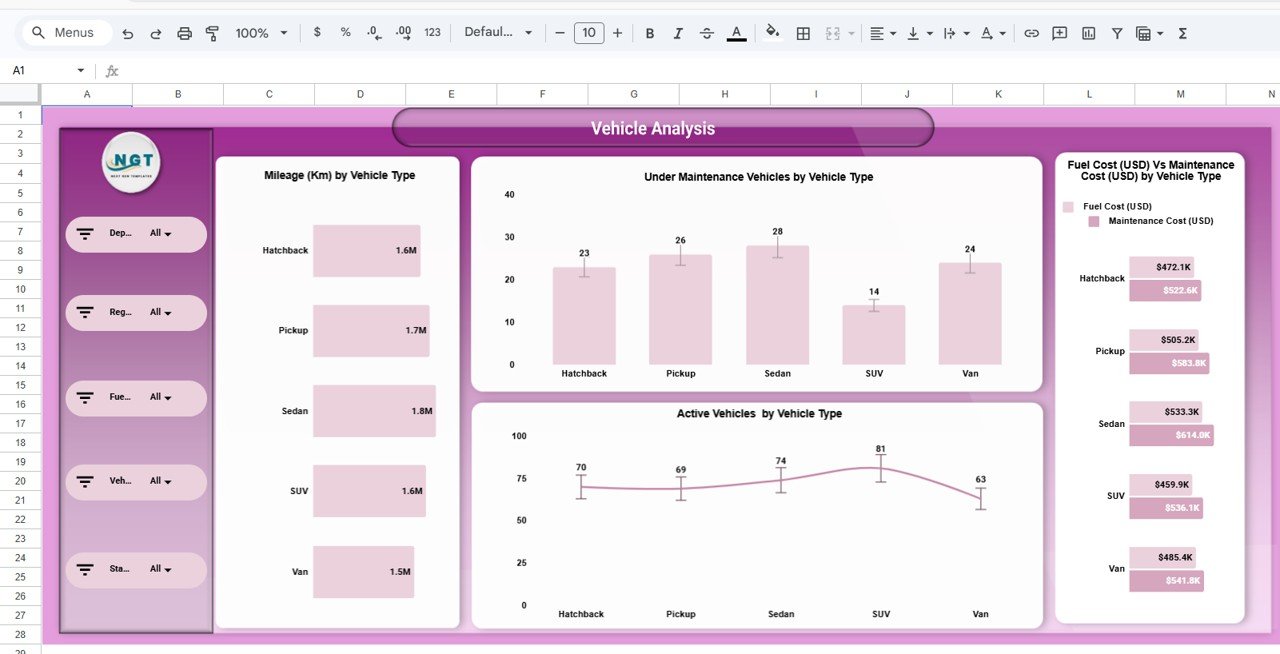
3. Vehicle Analysis Dashboard
The Vehicle Analysis Page evaluates fleet performance by vehicle type.
Charts Included
-
Mileage by Vehicle Type
-
Vehicles Under Maintenance by Vehicle Type
-
Active Vehicles by Vehicle Type
-
Fuel Cost vs Maintenance Cost by Vehicle Type
Insights from Vehicle Analysis
Fleet managers can analyze:
-
Which vehicle types perform best
-
Which vehicles require frequent maintenance
-
Which vehicle types generate higher fuel costs
Consequently, organizations can make smarter decisions about fleet expansion or replacement.
Click to Buy Fleet Management Dashboard in Google Sheets
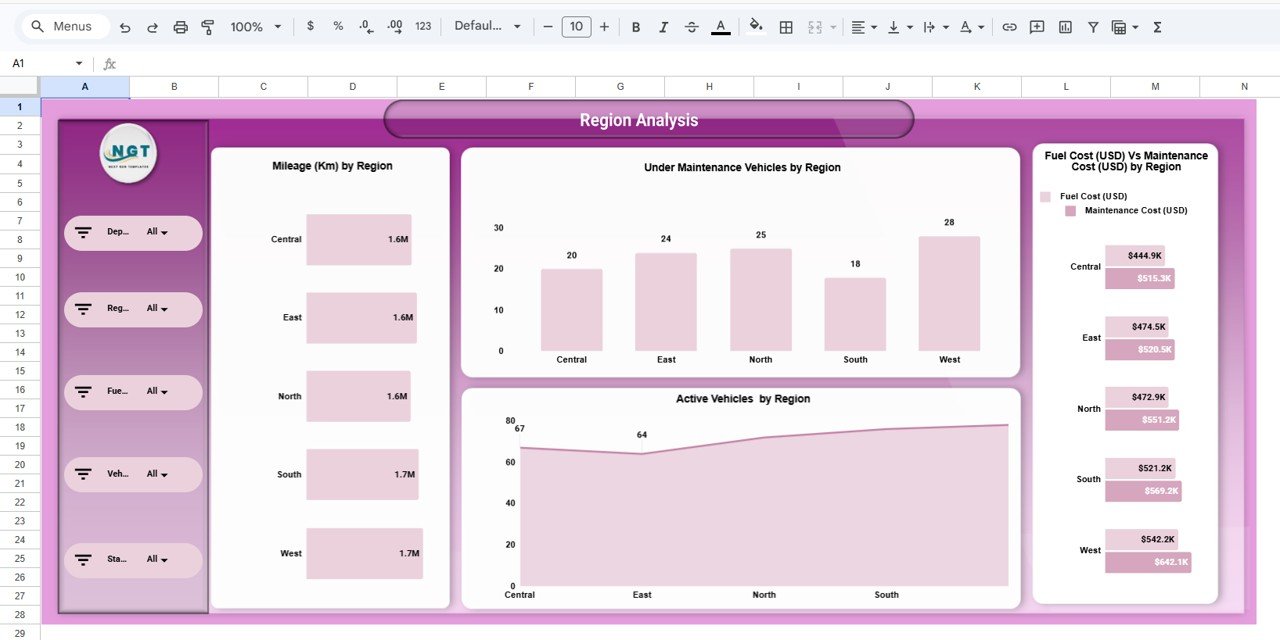
4. Region Analysis Dashboard
The Region Analysis Page helps organizations analyze fleet operations across different geographical areas.
Charts Included
-
Mileage by Region
-
Vehicles Under Maintenance by Region
-
Active Vehicles by Region
-
Fuel Cost vs Maintenance Cost by Region
Insights Provided
This page allows managers to identify:
-
Regions with higher vehicle utilization
-
Areas with higher maintenance requirements
-
Regional fuel consumption patterns
As a result, companies can optimize regional fleet deployment.
Click to Buy Fleet Management Dashboard in Google Sheets
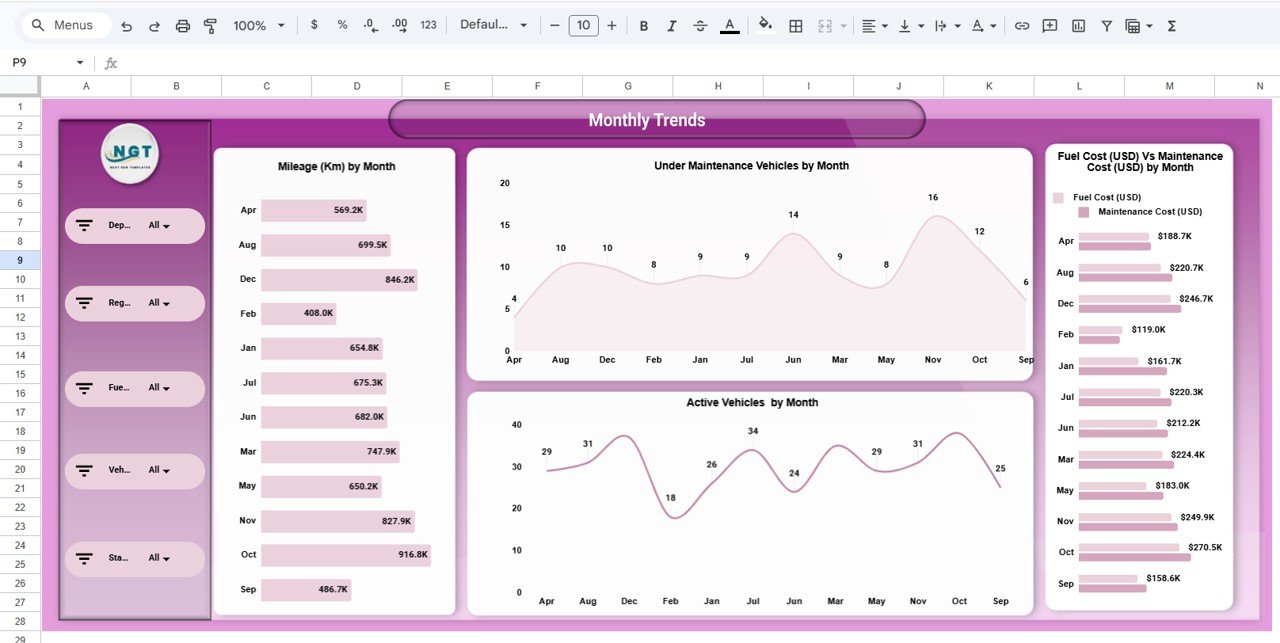
5. Monthly Trends Dashboard
Fleet performance changes over time, which makes monthly analysis essential.
The Monthly Trends Page tracks fleet performance across months.
Charts Included
-
Mileage by Month
-
Vehicles Under Maintenance by Month
-
Active Vehicles by Month
-
Fuel Cost vs Maintenance Cost by Month
Insights from Monthly Trends
Using this page, fleet managers can analyze:
-
Seasonal vehicle usage patterns
-
Monthly maintenance fluctuations
-
Fuel cost trends
Therefore, organizations can forecast future fleet requirements.
Click to Buy Fleet Management Dashboard in Google Sheets
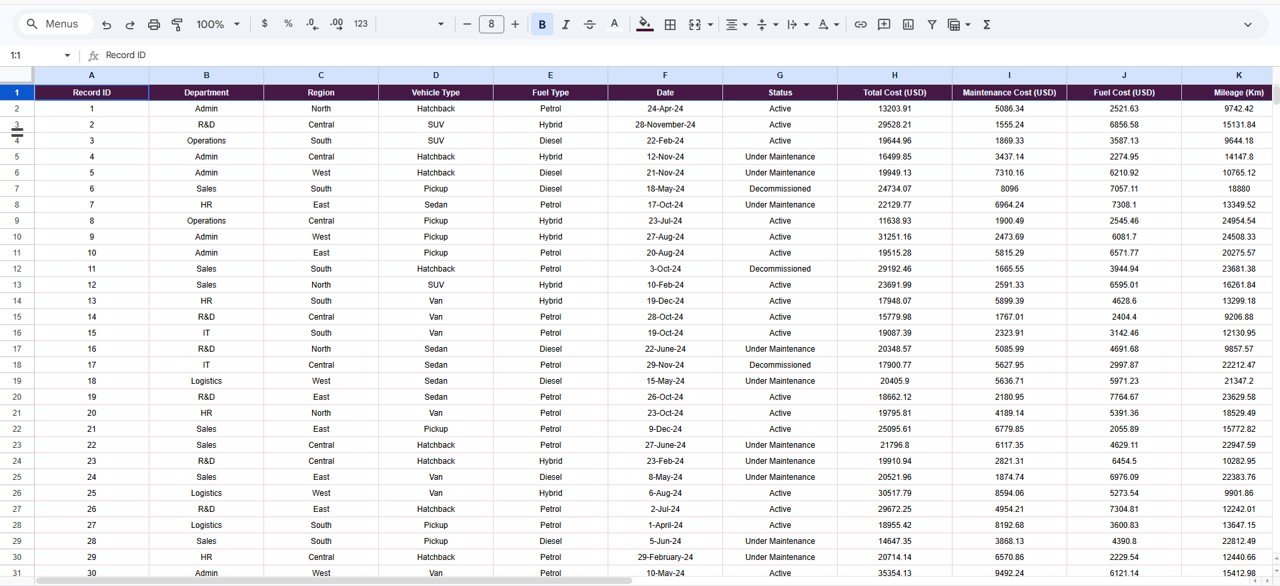
Data Input Sheet
The dashboard includes a Data Sheet where users enter fleet records.
Data Fields Included
- Record ID
- Department
- Region
- Vehicle Type
- Fuel Type
- Date
- Status
- Total Cost (USD)
- Maintenance Cost (USD)
- Fuel Cost (USD)
- Mileage (Km)
- Fuel Efficiency (Km/L)
- Trips Completed
- Under Maintenance
Once data is entered, all dashboard charts update automatically.
Click to Buy Fleet Management Dashboard in Google Sheets
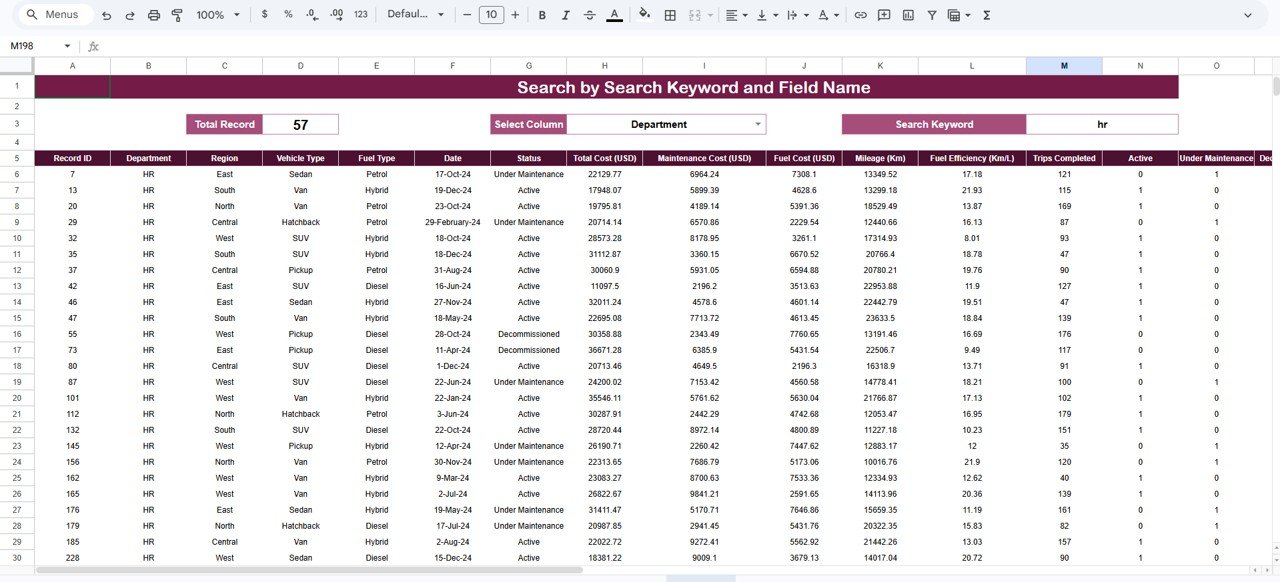
Search Dashboard Feature
The template also includes a Search Page.
This page allows users to:
- Select a column
- Enter a keyword
- Instantly filter fleet records
This feature makes it easy to locate specific fleet information quickly.
Advantages of the Fleet Management Dashboard in Google Sheets
The Fleet Management Dashboard provides several operational advantages.
1. Centralized Fleet Monitoring
All fleet data appears in one dashboard.
Therefore, managers can monitor fleet performance efficiently.
2. Cost Control
The dashboard tracks fuel and maintenance costs clearly.
As a result, organizations can control operational expenses.
3. Better Maintenance Planning
Managers can identify vehicles that require frequent maintenance.
Consequently, preventive maintenance planning becomes easier.
4. Data-Driven Decisions
Charts and KPIs provide actionable insights.
Therefore, managers can make smarter operational decisions.
5. Easy Implementation
Because the dashboard runs in Google Sheets, organizations can use it without advanced software.
Best Practices for Fleet Management Dashboards
Click to Buy Fleet Management Dashboard in Google Sheets
To maximize the benefits of this dashboard, organizations should follow several best practices.
1. Maintain Accurate Vehicle Data
Always record correct vehicle information to ensure reliable analysis.
2. Update Data Regularly
Frequent updates improve dashboard accuracy.
3. Monitor Maintenance Trends
Track maintenance patterns to prevent unexpected breakdowns.
4. Analyze Fuel Efficiency
Compare fuel efficiency across vehicles to identify optimization opportunities.
5. Review Monthly Trends
Regularly analyze monthly data to detect operational changes early.
Who Can Use This Dashboard?
Click to Buy Fleet Management Dashboard in Google Sheets
Many industries can benefit from a fleet management dashboard.
Common Users
- Logistics companies
- Transportation providers
- Delivery services
- Construction companies
- Government transport departments
- Corporate fleet managers
Therefore, this dashboard works for both private and public organizations.
Conclusion
Fleet operations require constant monitoring of vehicle performance, fuel consumption, and maintenance costs. Without proper tracking systems, organizations may face operational inefficiencies and rising expenses.
The Fleet Management Dashboard in Google Sheets provides a powerful yet simple solution for managing fleet data. By combining automated calculations, interactive charts, and structured reporting pages, this dashboard helps organizations monitor fleet operations effectively.
Because it includes pages for Overview, Department Analysis, Vehicle Analysis, Region Analysis, and Monthly Trends, fleet managers gain a complete view of operational performance.
As a result, organizations can improve fleet efficiency, reduce costs, and make better operational decisions.
Visit our YouTube channel to learn step-by-step video tutorials
Youtube.com/@NeotechNavigators
Watch the step-by-step video tutorial: