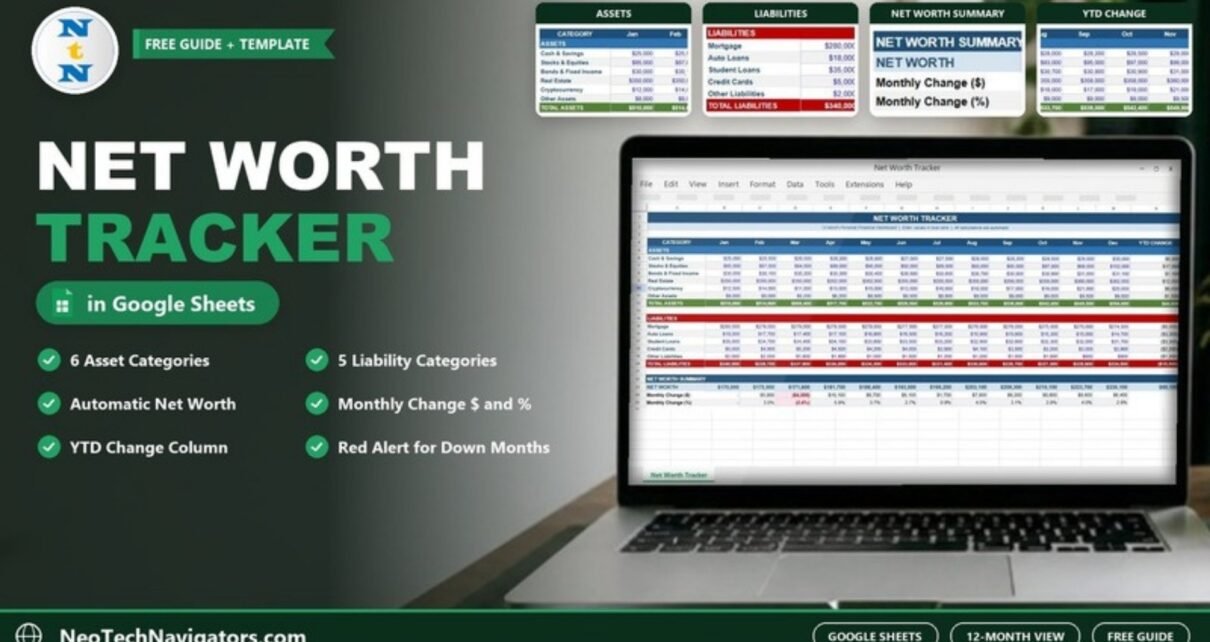
Income and spending tell you how a month went. Net worth tells you how your whole financial position is changing over time. A Net Worth Tracker in Google Sheets records what you own and what you owe each month and turns those balances into one number – your net worth – plus how much it moved since last month and since January.
This guide looks at the tracker as it actually ships: a 12-month sheet with six asset categories, five liability categories and a Net Worth Summary. You will see how every total is calculated (with the equivalent formulas), a worked example from the sample numbers, and how to set it up with your own accounts. It suits individuals and families who want a simple monthly check-in on their finances without a budgeting app.
🎥 Watch the Video Tutorial
What Is Net Worth and Why Track It Monthly?
Net worth is everything you own minus everything you owe:
Net Worth = Total Assets – Total LiabilitiesA single figure is a snapshot. Recording it every month shows the direction: whether savings and investments are growing faster than debts are shrinking, and which months set you back. Monthly is frequent enough to spot a trend and infrequent enough to keep the habit going.
Inside the Net Worth Tracker in Google Sheets
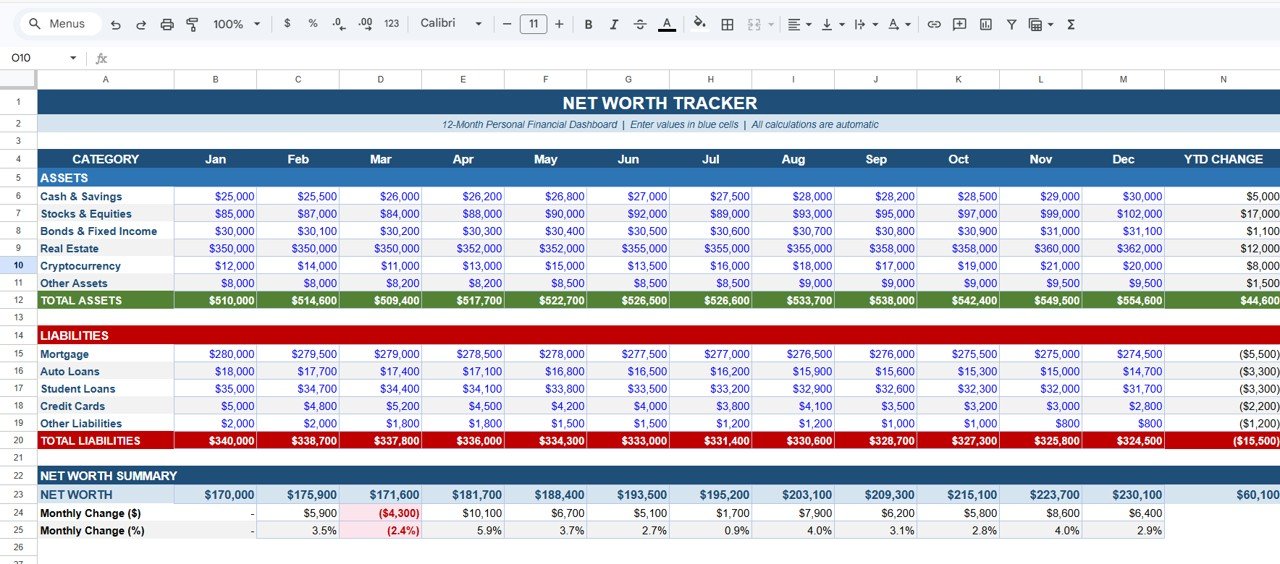
Everything happens on one tracker sheet titled NET WORTH TRACKER – 12-Month Personal Financial Dashboard. Columns run from Jan to Dec, followed by a YTD CHANGE column. The subtitle sums up how it works: enter values in the blue cells, and all calculations are automatic.
Assets Section
- Cash & Savings
- Stocks & Equities
- Bonds & Fixed Income
- Real Estate
- Cryptocurrency
- Other Assets
These add up to the green TOTAL ASSETS row.
Liabilities Section
- Mortgage
- Auto Loans
- Student Loans
- Credit Cards
- Other Liabilities
These add up to the red TOTAL LIABILITIES row.
Net Worth Summary
Three rows close the sheet: NET WORTH, Monthly Change ($) and Monthly Change (%). Any month where net worth falls is highlighted in red, so a bad month stands out immediately.
Colour Guide
| Colour | Meaning |
|---|---|
| Blue values | Input cells – type your monthly balances here |
| Green row | TOTAL ASSETS |
| Red row | TOTAL LIABILITIES |
| Red-shaded cell in the summary | A month where net worth went down |
| Other summary cells | Calculated automatically – do not overwrite |
How Each Total Is Calculated
In the sheet, months sit in columns B (Jan) to M (Dec), assets in rows 6–11 and liabilities in rows 15–19. The calculations are equivalent to these formulas, shown for January (column B) and February (column C):
| Row | Equivalent formula | What it does |
|---|---|---|
| TOTAL ASSETS | =SUM(B6:B11) |
Adds the six asset categories |
| TOTAL LIABILITIES | =SUM(B15:B19) |
Adds the five liability categories |
| NET WORTH | =B12-B20 |
Assets minus liabilities |
| Monthly Change ($) | =C23-B23 |
This month’s net worth minus last month’s |
| Monthly Change (%) | =C24/B23 |
The change as a share of last month’s net worth |
| YTD CHANGE | =M23-B23 |
December value minus January value |
Worked Example From the Sample Data
January: Total Assets are $510,000 and Total Liabilities are $340,000.
Net Worth (Jan) = 510,000 – 340,000 = $170,000February: assets rise to $514,600 and liabilities fall to $338,700.
Net Worth (Feb)     = 514,600 – 338,700 = $175,900
Monthly Change ($)  = 175,900 – 170,000 = $5,900
Monthly Change (%)  = 5,900 / 170,000   = 3.5%
March shows why the red highlight matters. Stocks & Equities drop from $87,000 to $84,000 and Cryptocurrency from $14,000 to $11,000, while credit card debt rises from $4,800 to $5,200. Net worth falls to $171,600:
Monthly Change ($)  = 171,600 – 175,900 = –$4,300
Monthly Change (%)  = –4,300 / 175,900  = –2.4%
By December the sample reaches $230,100. The YTD CHANGE column shows +$44,600 in assets, –$15,500 in liabilities and +$60,100 in net worth for the year – and $60,100 is exactly 44,600 + 15,500, because paying down debt raises net worth just as much as growing assets.
How to Set It Up With Your Own Numbers
- Make a copy of the file in your Google Drive.
- List your accounts against the categories. Several bank accounts can go into Cash & Savings; your home’s estimated value goes into Real Estate.
- Choose a fixed date each month (for example, the last day) and use the balance on that date.
- Clear the sample values in the blue cells and enter your January balances.
- Enter debts as positive numbers in the liabilities rows – the sheet subtracts them for you.
- Add each new month in the next column. Net worth, monthly change and YTD change update on their own.
- Review red months and note what caused them – a market dip, a large purchase or new debt.
Real-World Use Cases
- Paying off a mortgage or student loan: watch the liability rows shrink and see how much of your net worth growth comes from debt reduction alone.
- Household finance check-in: a couple updates the shared sheet together at month end, which keeps both people informed without sharing bank logins.
- Preparing for a meeting with a financial adviser: a 12-month view of assets and debts is a useful starting point for the conversation.
Best Practices
- Use realistic values for property and other illiquid assets; update them a few times a year rather than every month.
- Record investment and crypto balances on the same day each month, since prices move daily.
- Include every debt, even small ones like a store card, so the picture is honest.
- Do not type over calculated cells; if you need more categories, insert rows inside each section so the totals still include them.
- Start a fresh copy each January and keep the old year for comparison.
Limitations – When You Need Something Else
- It does not track income, spending or budgets. Pair it with a budget tracker if you need that.
- It does not connect to banks or brokers; every balance is entered by hand.
- It covers one year per sheet. Multi-year history means keeping one copy per year.
- It is a record-keeping tool, not financial advice. For investment or debt decisions, speak to a qualified adviser.
Related Guides and Templates
For a different take on the same idea, read about the Personal Finance Net Worth Tracker in Google Sheets. To build a cash buffer first, see the Emergency Fund Tracker in Google Sheets or the Savings Goal Tracker. For monthly spending, follow the guide on how to make a budget tracker in Google Sheets, and for a KPI-style view of your finances, the Personal Finance KPI Dashboard.
Prefer Excel? The same idea is available as a Net Worth Tracker in Excel.
If you are new to spreadsheets and want to understand formulas like SUM and simple percentage changes, the learning paths on NextGenTemplates Academy start from the basics.
Frequently Asked Questions
How do you calculate net worth in Google Sheets?
Add up your assets with SUM, add up your liabilities with SUM, and subtract: for example =SUM(B6:B11)-SUM(B15:B19). The tracker does this for every month automatically.
How often should I update my net worth tracker?
Once a month is enough for most people. Use the same date each month so the changes are comparable.
Should I include my home and car?
Include your home under Real Estate at a realistic estimated value, and the loan against it under Mortgage. Cars lose value quickly; if you include one, put it under Other Assets and update the value at least once a year.
What does a red month mean?
The Monthly Change cells turn red when net worth is lower than the previous month – as in March of the sample, when it fell by $4,300 (–2.4%).
Can I add more asset or liability categories?
Yes. Insert a new row inside the Assets or Liabilities section, give it a name and enter values in blue. Check that the TOTAL row still includes the new row.
Can I use a currency other than US dollars?
Yes. Select the value cells and change the format under Format > Number > Currency or a custom currency.
Wrapping Up
The Net Worth Tracker in Google Sheets reduces your finances to one monthly habit: enter balances, read the net worth line, and check whether the month was green or red. Over a year, the YTD CHANGE column shows how much came from growing assets and how much from paying down debt.
📅 Last updated: October 2026