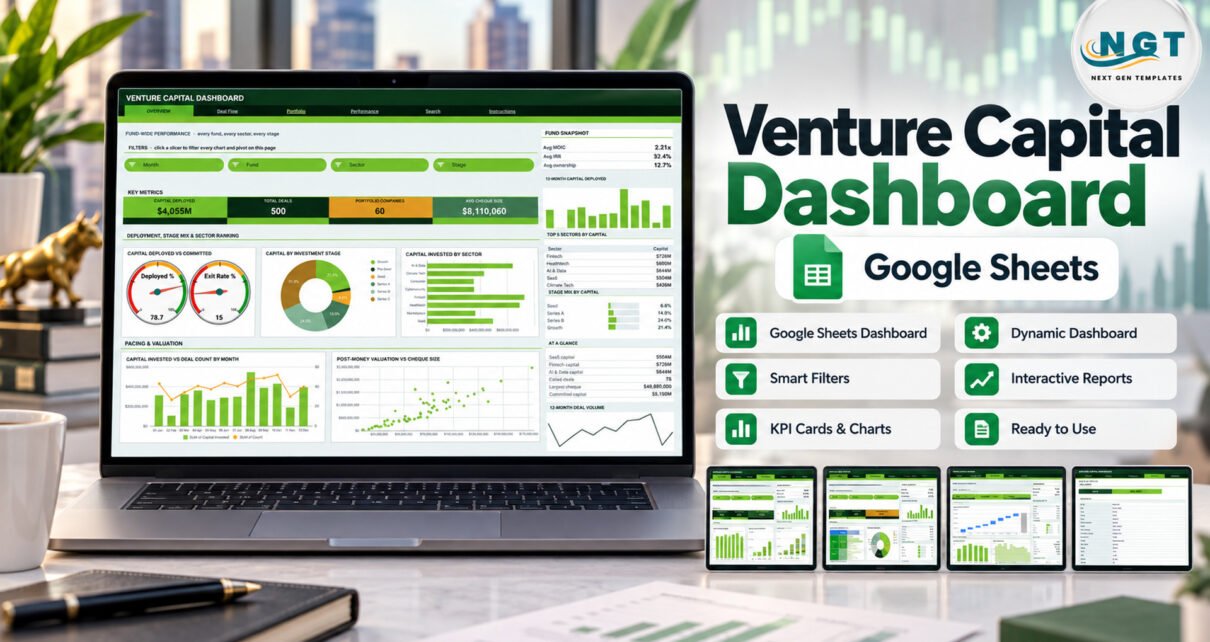
A six-page Venture Capital Dashboard in Google Sheets with 16 KPI cards, 18 chart panels and 15 slicers covering capital deployed, deal flow, portfolio composition, MOIC and IRR from a 1,000-row deal log.
Online Tutorial for Data Analysis and Automation
A six-page Venture Capital Dashboard in Google Sheets with 16 KPI cards, 18 chart panels and 15 slicers covering capital deployed, deal flow, portfolio composition, MOIC and IRR from a 1,000-row deal log.
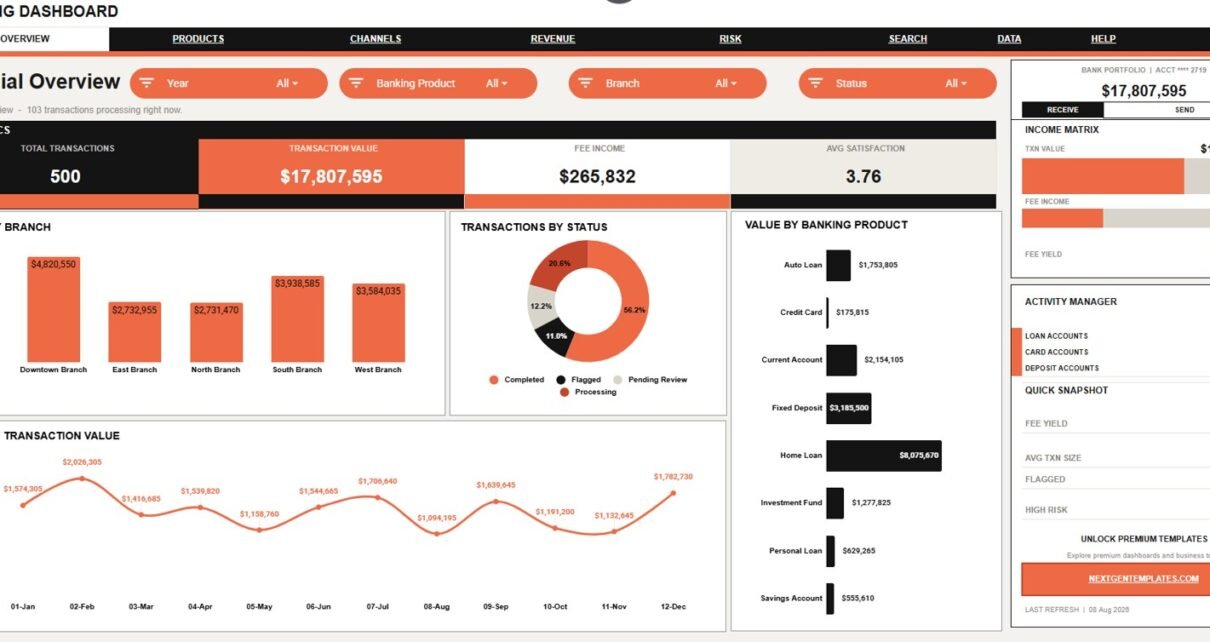
Banking Dashboard in Google Sheets is a ready-to-use Google Sheets template for banking teams that need visibility into transaction activity, fee revenue, banking product performance, channels, customer segments, satisfaction, risk, and processing time. The workbook includes 7 sheet tabs, 4 headline KPI cards, 21 chart views, native slicers, a Transaction Lookup screen, and an editable […]
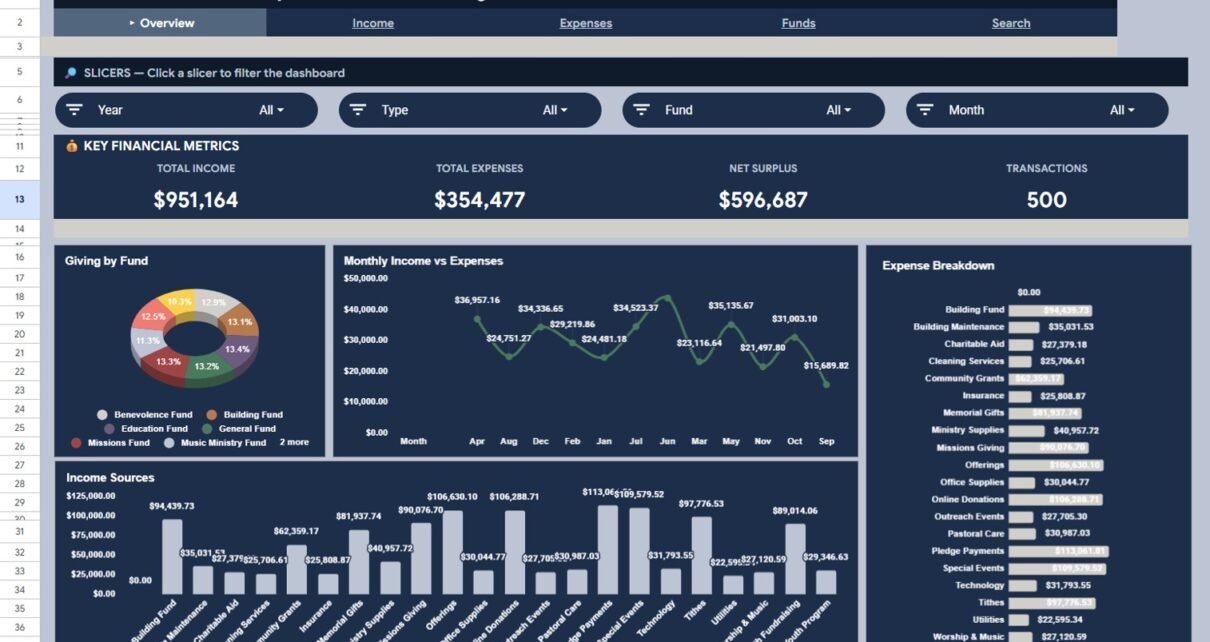
Review church income, expenses, funds, payment methods and individual transactions in one Google Sheets dashboard with KPI cards, slicers, a Transaction ID search and a User Guide.
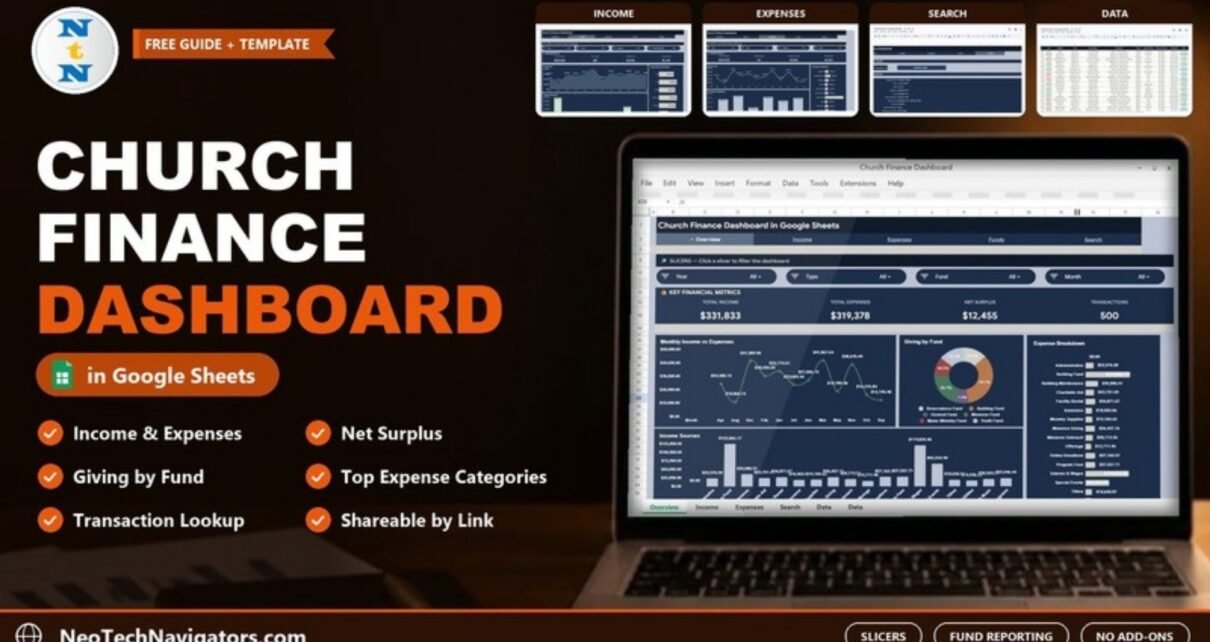
Track church income, expenses, net surplus and giving by fund in one Google Sheets dashboard with slicers and a transaction lookup. This guide explains each tab and how to load your own records.
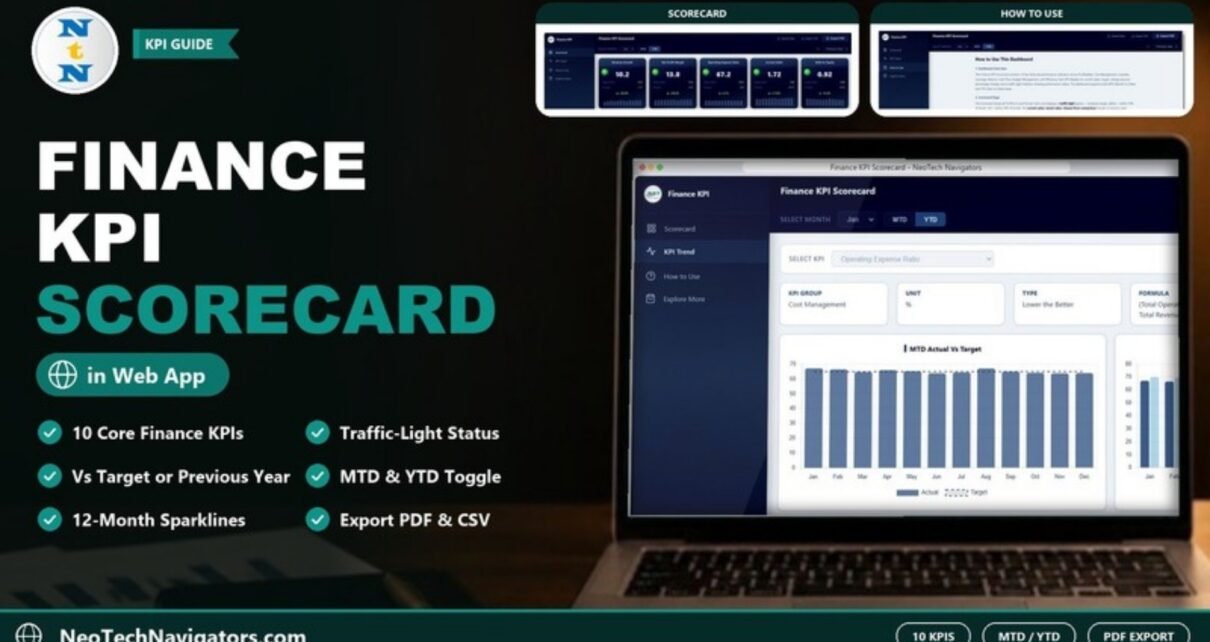
A browser-based Finance KPI Scorecard in HTML that shows ten financial KPIs with traffic lights, targets, prior-year changes, sparklines and four trend charts, with PDF and CSV export.
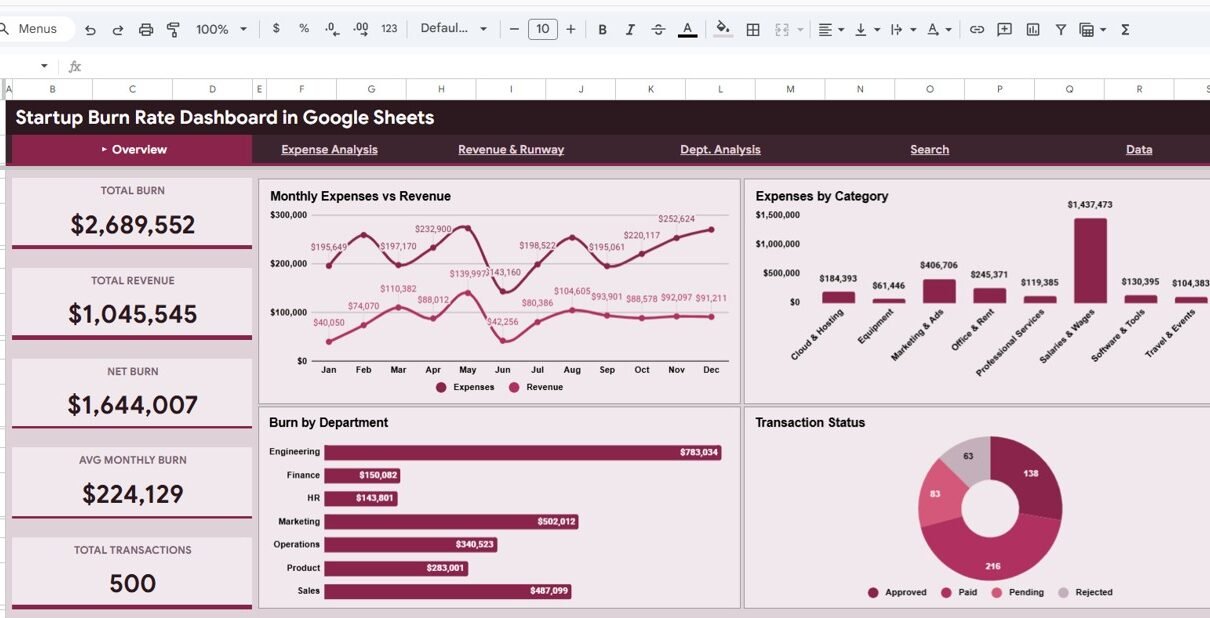
Track your startup’s burn rate, expenses, revenue, and financial runway with this interactive Google Sheets dashboard featuring 5 pages, 5 KPI cards, dynamic charts, and smart search functionality.
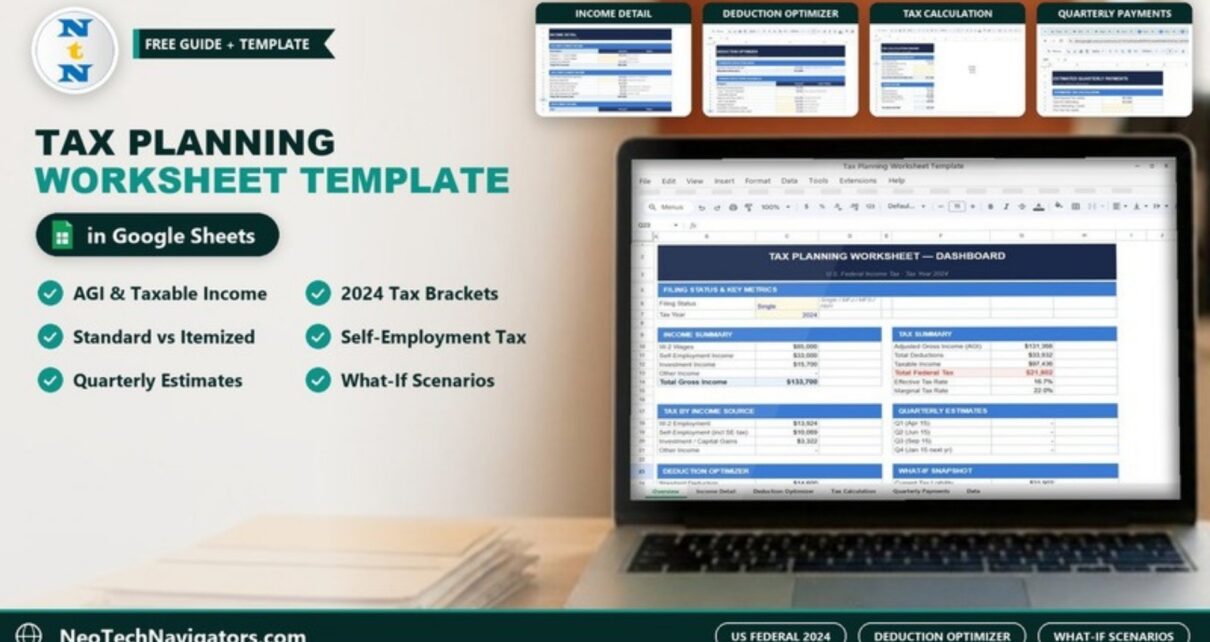
How the Tax Planning Worksheet Template in Google Sheets works for U.S. federal tax year 2024: income detail, standard vs itemized deductions, bracket tax, effective rate and quarterly estimated payments.
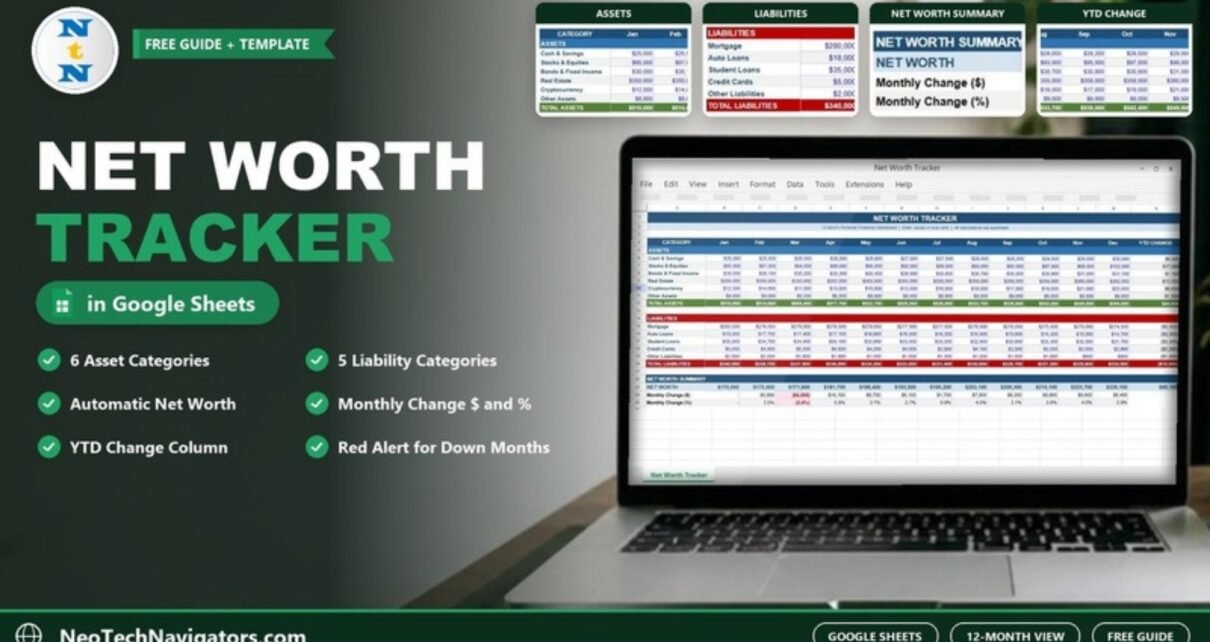
A 12-month Net Worth Tracker in Google Sheets: enter assets and liabilities each month and see net worth, monthly change and year-to-date change calculated for you, with a worked example.
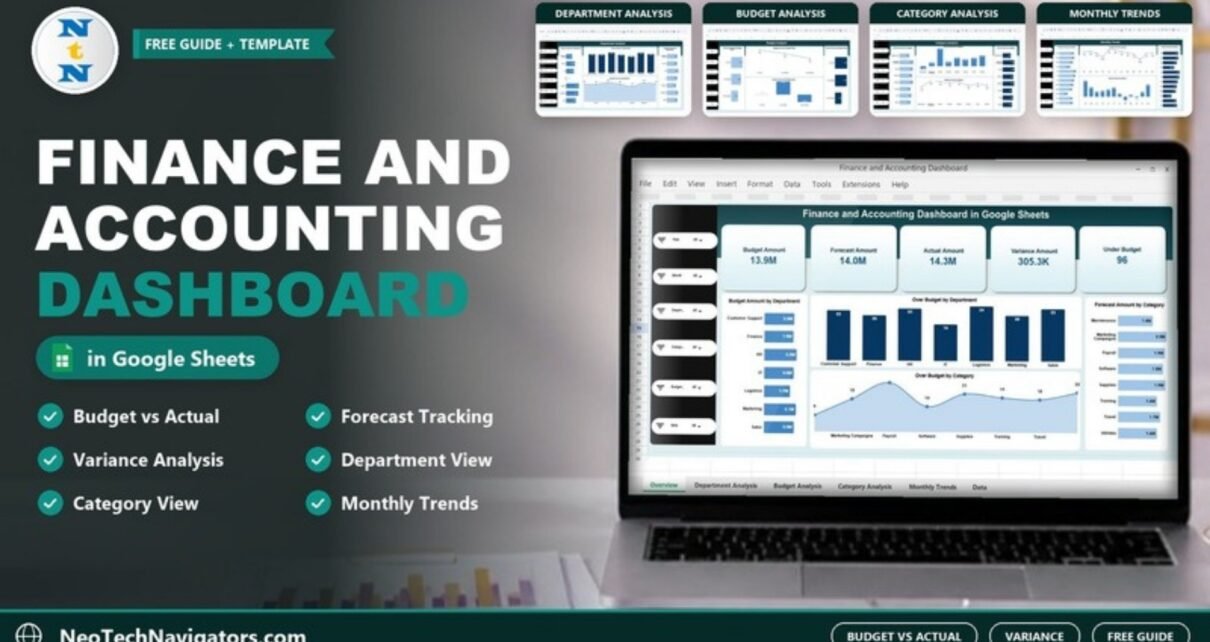
A practical guide to the Finance and Accounting Dashboard in Google Sheets: five pages tracking budget, forecast, actual and variance by department, category, budget status and month, with setup steps and a worked variance example.
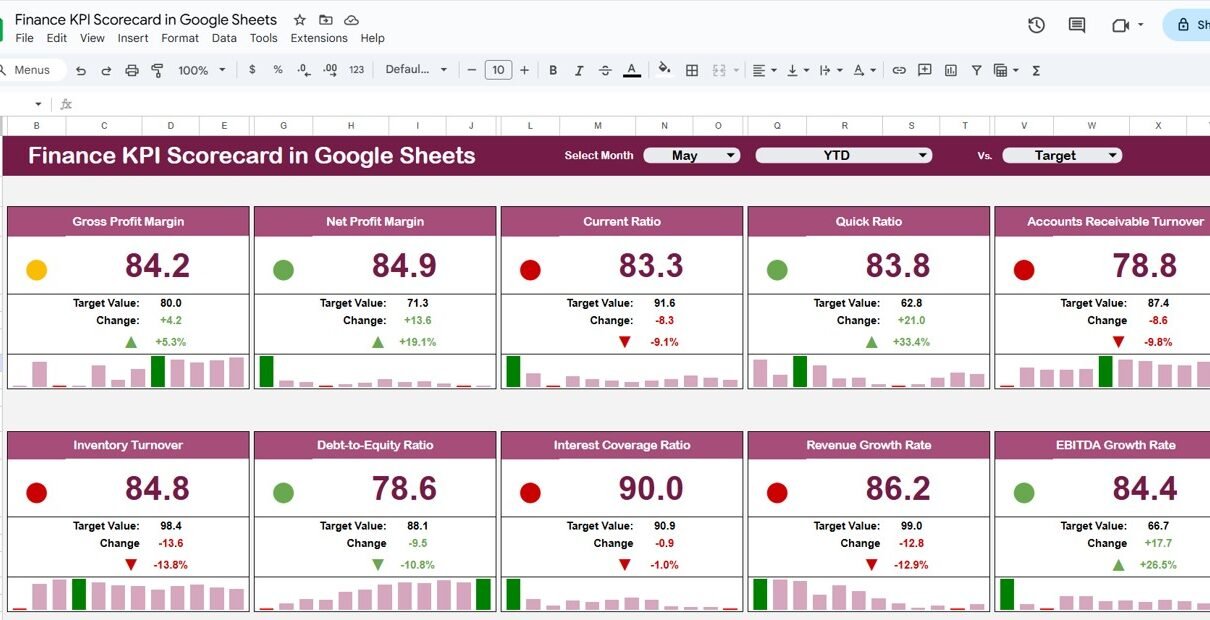
Monitoring financial performance is essential for business growth and sustainability. The Finance KPI Scorecard in Google Sheets is a ready-to-use template that helps finance teams track key financial metrics, analyze trends, and make data-driven decisions. In this article, we will explain the features, advantages, and best practices of using this finance KPI scorecard. Get the […]