When budgets live in one file, forecasts in another and actual spending in the accounting system, nobody can say quickly which department is over budget or why. The Finance and Accounting Dashboard in Google Sheets brings budget, forecast, actual and variance into one place and breaks them down by department, expense category, budget status and month.
This guide is for finance managers, accountants, small business owners and department heads who run a monthly budget review. It covers the five dashboard pages, the KPIs and how variance is calculated, a worked example from the sample data, how to load your own numbers, real use cases, best practices and the limits of a spreadsheet-based finance report.
🎥 Watch the Video Tutorial
Get the Finance and Accounting Dashboard
What a Finance and Accounting Dashboard Does
It compares three numbers for every line of spending: what you planned (budget), what you now expect (forecast) and what you actually spent (actual). The gap between actual and budget is the variance. Each line also carries a budget status of Over Budget, Under Budget or On Track, so problem areas can be counted and filtered.
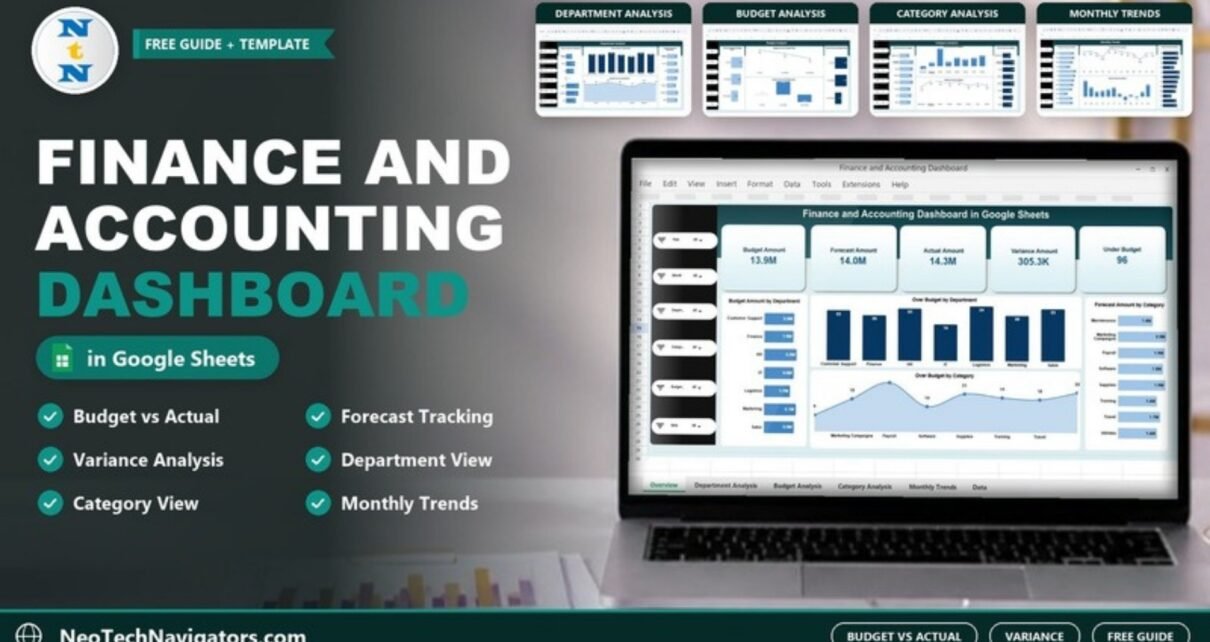
Six slicers down the left side of every page, Year, Month, Department, Category, Budget Status and Date, let you narrow the page to, say, Marketing in one month or all Over Budget lines this year.
The Five Dashboard Pages
| Page | What it shows | Question it answers |
|---|---|---|
| Main Dashboard | Five KPI cards, Budget Amount by Department, Over Budget by Department, Over Budget by Category, Forecast Amount by Category | Where do we stand overall? |
| Department Analysis | Budget, forecast, actual and variance by department | Which teams are overspending? |
| Budget Analysis | The same four measures by budget status | How much money sits in Over, Under and On Track lines? |
| Category Analysis | The four measures by expense category | Which cost types drive the variance? |
| Monthly Trends | The four measures by month | Is the variance growing or shrinking over time? |
Main Dashboard (Executive Summary)
Five cards sit at the top. With the sample data they read Budget Amount 13.9M, Forecast Amount 14.0M, Actual Amount 14.3M, Variance Amount 305.3K and Under Budget 96 (the number of lines spending less than planned). Below them, charts show budget amount by department, the number of over-budget lines by department and by category, and forecast amount by category. This is the page to open in a leadership meeting.

Department Analysis
Variance, actual, budget and forecast amounts for each of the seven departments: Customer Support, Finance, HR, IT, Logistics, Marketing and Sales. In the sample, Logistics has the largest variance (67.8K) and IT the smallest (1.7K), so you can see at a glance which teams are spending ahead of plan.

Budget Analysis
Groups every line by status (On Track, Over Budget, Under Budget) and shows how much budget, forecast, actual and variance falls in each group. A large amount in Over Budget is a signal to review approvals.

Category Analysis
The same four measures by expense category: Maintenance, Marketing Campaigns, Payroll, Software, Supplies, Training, Travel and Utilities. This is where you find the cost type behind a department’s overspend. In the sample, Payroll carries the largest variance (96.3K) while Maintenance is under budget (-17,388).

Monthly Trends
Forecast, budget, actual and variance by month. Use it to spot seasonal spikes and to check whether forecasts are getting more accurate as the year goes on. In the sample, April shows the biggest overspend (69.9K) and March and November finish under budget.

Finance KPIs and How They Are Calculated
| KPI | What it measures | Formula | Better when |
|---|---|---|---|
| Budget Amount | Total planned spending | Sum of Budget | Close to need (not a target to maximise) |
| Forecast Amount | Expected spending based on latest information | Sum of Forecast | Closer to Budget |
| Actual Amount | Real spending recorded | Sum of Actual | At or below Budget |
| Variance Amount | Gap between actual and budget | Actual – Budget | Lower (negative means under budget) |
| Under Budget | Number of lines spending less than planned | Count of lines with status Under Budget | Context dependent |
Variance % ((Actual – Budget) / Budget) is not a card in the template, but it is easy to add and makes departments of different sizes comparable.
Worked Example
The Budget Analysis page explains the 305.3K variance on the summary card. Over Budget lines had a budget of 4.8M and actual spending of 5.5M, a variance of 706.5K. Under Budget lines had a budget of 3.5M and actual spending of 3.1M, a variance of -402,930. On Track lines add just 1.7K. Together: 706.5K – 402.9K + 1.7K = 305.3K, the total shown on the Main Dashboard. Filtering Category Analysis to the Over Budget status then shows which cost types make up the 706.5K, which tells you which approvals to review.
How to Use It with Your Own Data
- Make a copy of the template in your Google Drive.
- Set up your department and expense category names, and keep them identical everywhere.
- Enter monthly Budget and Forecast amounts for each department and category in the data sheet.
- After each month closes, add Actual spending from your accounting system or bank export.
- Check that each line has the correct budget status.
- Open the Main Dashboard and use the Year, Month, Department, Category, Budget Status and Date slicers.
- Drill into Department and Category Analysis for anything over budget, then review Monthly Trends before changing next quarter’s budget.
Three Real-World Use Cases
- Small business owner: one monthly view of spending by category, so payroll, utilities and marketing campaign overruns are caught before the quarter ends.
- Finance team in a mid-sized company: a shared budget-vs-actual report that department heads can filter to their own numbers.
- Non-profit or school: show funders and boards how actual spending compares with the approved budget by department and month.
Best Practices
- Close actuals on the same day each month so trends are comparable.
- Update forecasts when you learn something new; a stale forecast is just a second budget.
- Review lines with the largest variance amount first, not the largest percentage.
- Standardise department and category names using dropdowns.
- Restrict edit access to the people who enter data and share view access with everyone else.
Limitations: Who Should Not Use It
This is a budget-versus-actual dashboard, not an accounting system. It does not post journal entries, produce a balance sheet or connect to QuickBooks, Tally or Xero automatically, so actuals are entered or pasted. Companies needing audit trails, multi-currency consolidation or daily ledger feeds should use their accounting software’s reporting or a BI tool connected to it.
Related Templates and Learning
For KPI-based finance tracking, see the Finance KPI Dashboard and the one-page Finance KPI Scorecard. If budgets are your focus, the Budget Performance Dashboard and Budget Forecasting Dashboard go further, and the Cash Flow Dashboard covers money in and out.
The same dashboard is available as the Finance and Accounting Dashboard in Excel and in Power BI. To learn how budget-vs-actual reports like this are built, the Excel Pivot Tables and Dashboards course on NextGenTemplates Academy walks through the method.
Frequently Asked Questions
What is a finance and accounting dashboard used for?
To compare budget, forecast and actual spending in one view and highlight where variance comes from by department, category and month.
How is variance calculated?
Variance is actual minus budget. A positive number means spending is over budget; a negative number means it is under.
Can I change departments and categories?
Yes. Replace the sample names with your own and keep the spelling consistent so slicers and charts group correctly.
Does it track monthly results?
Yes. The Monthly Trends page shows budget, forecast, actual and variance by month, and every page can be filtered by year, month and date.
Is it suitable for small businesses?
Yes. It needs only Google Sheets and monthly totals, which suits small teams without a BI tool.
Does it connect to my accounting software?
No. Export actuals from your accounting system and paste them in. Automation is possible with Google Apps Script but is not included.
Wrapping Up
The Finance and Accounting Dashboard gives you a clear monthly answer to “are we on budget, and if not, where?” Load your budget and forecast, add actuals after each month closes, start with the Main Dashboard and follow the variance into departments and categories.
Get the Finance and Accounting Dashboard
📅 Last updated: October 2026