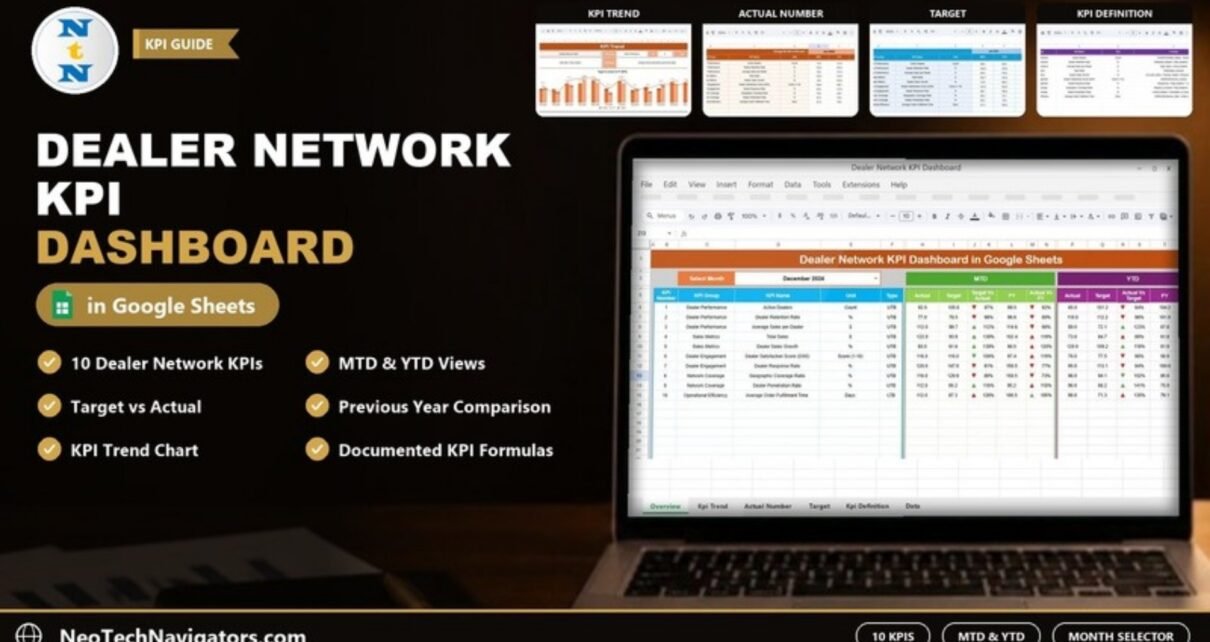
The Dealer Network KPI Dashboard in Google Sheets tracks how your dealers are performing every month against target and against last year. It covers 10 KPIs across dealer performance, sales, dealer engagement, network coverage and operational efficiency, and shows each one as MTD (month-to-date) and YTD (year-to-date) figures with green and red arrows.
It is built for sales directors, channel and distribution managers, regional managers and dealer development teams in automotive, equipment, consumer goods or any business that sells through dealers. The file has six sheets: Dashboard, KPI Trend, Actual Number, Target, Previous Year Number and KPI Definition. You choose a month from a drop-down and the whole dashboard updates.
🎥 Watch the Video Tutorial
Get the Dealer Network KPI Dashboard
What Problem Does a Dealer Network KPI Dashboard Solve?
A dealer network is hard to manage from scattered reports. One file holds sales, another holds dealer survey scores, and targets live in a planning deck. By the time someone compiles them, the month is over. Managers end up reacting late to falling retention or slow order fulfilment.
This dashboard puts actuals, targets and last year’s numbers side by side for every KPI. You see at a glance which KPIs are above target, which are below, and whether the network is doing better or worse than a year ago, both for the selected month and for the year so far.
The 10 Dealer Network KPIs in the Template
These are the KPIs exactly as defined on the KPI Definition sheet. UTB means “upper the better” and LTB means “lower the better”.
| # | KPI Group | KPI | Unit | Formula | Better when |
|---|---|---|---|---|---|
| 1 | Dealer Performance | Active Dealers | Count | COUNTIF(Dealer_Status, “Active”) | Higher (UTB) |
| 2 | Dealer Performance | Dealer Retention Rate | % | (Retained_Dealers / Total_Dealers) * 100 | Higher (UTB) |
| 3 | Dealer Performance | Average Sales per Dealer | $ | Total_Sales / Active_Dealers | Higher (UTB) |
| 4 | Sales Metrics | Total Sales | $ | SUM(Sales_Amount) | Higher (UTB) |
| 5 | Sales Metrics | Dealer Sales Growth | % | ((Current_Sales – Previous_Sales) / Previous_Sales) * 100 | Higher (UTB) |
| 6 | Dealer Engagement | Dealer Satisfaction Score (DSS) | Score (1-10) | AVERAGE(Survey_Scores) | Higher (UTB) |
| 7 | Dealer Engagement | Dealer Response Rate | % | (Responses / Total_Dealers) * 100 | Higher (UTB) |
| 8 | Network Coverage | Geographic Coverage Ratio | % | (Regions_Covered / Total_Regions) * 100 | Higher (UTB) |
| 9 | Network Coverage | Dealer Penetration Rate | % | (Active_Dealers / Population_in_Area) * 100 | Higher (UTB) |
| 10 | Operational Efficiency | Average Order Fulfillment Time | Days | AVERAGE(Delivery_Date – Order_Date) | Lower (LTB) |
The formulas describe how each KPI should be calculated from your source data. You calculate the monthly values in your own system and enter the results in the Actual Number sheet.
The Six Sheets Explained
1. Dashboard
The Dashboard is the main report. Choose the month in the Select Month drop-down (cell D3; December 2024 in the screenshot). For each of the 10 KPIs it shows KPI Number, KPI Group, KPI Name, Unit and Type, followed by two blocks:
- MTD: Actual, Target, Target Vs Actual, PY (previous year) and Actual Vs PY
- YTD: Actual, Target, Actual Vs Target, PY and Actual Vs PY
Each percentage comparison carries a green or red up/down arrow so you can scan the table quickly. Always read the arrow together with the KPI’s Type column: for an LTB KPI such as Average Order Fulfillment Time, a value above 100% means the number is higher than the comparison, which is the unfavourable direction.

Worked example from the screenshot
For Average Sales per Dealer in December 2024, MTD Actual is 112.0, Target is 99.7 and PY is 114.6:
Target Vs Actual = 112.0 / 99.7  = 112%  (above target, green arrow)
Actual Vs PY     = 112.0 / 114.6 = 98%   (slightly below last year)
For an LTB KPI such as Average Order Fulfillment Time, a value above target is unfavourable: MTD Actual 112.0 against a target of 87.3 gives 128% and a red arrow.
2. KPI Trend
Pick one KPI in the Select KPI drop-down (cell C3). The sheet shows its KPI Group, Unit, Type, Formula and Definition, and a Target Vs Actual Vs PY (MTD) chart from Jan-2024 to Dec-2024, with Actual and PY as columns and Target as a line.

3. Actual Number
Enter the current year’s actual values here, with an MTD and a YTD column for each month (Jan-2024, Feb-2024 and so on). Set the first month of your year in cell E1 (labelled “Change the first of the year”), and the month headers follow from it, so the template works for April–March or other fiscal years.

4. Target
The Target sheet holds the MTD and YTD target for each KPI and month in the same layout as the actuals.

5. Previous Year Number
Enter last year’s values (Jan-2023 onwards in the sample) in the same MTD/YTD layout. The dashboard uses them for the PY and Actual Vs PY columns.

6. KPI Definition
The KPI Definition sheet documents every KPI with KPI Group, KPI Name, Unit, Formula, Definition and Type (UTB or LTB). This is where you rename KPIs or add new ones.

How to Use It With Your Own Data
- Make a copy with File > Make a copy.
- Review the KPI Definition sheet. Keep the 10 KPIs or rename them to match your network, and set the correct UTB or LTB type for each.
- Set your year start in cell E1 of the Actual Number sheet.
- Enter targets for each KPI and month in the Target sheet.
- Enter last year’s values in the Previous Year Number sheet.
- Enter actuals each month in the Actual Number sheet, both MTD and YTD.
- Select the month on the Dashboard and review the arrows, then open KPI Trend for any KPI that needs a closer look.
Three Real-World Use Cases
Automotive dealer network
A regional sales head reviews Active Dealers, Dealer Retention Rate and Average Sales per Dealer each month to decide which dealers need support or territory changes.
Consumer goods distribution
A channel manager watches Geographic Coverage Ratio and Dealer Penetration Rate to find regions where the network is thin before planning dealer recruitment.
Equipment manufacturer
An operations lead tracks Average Order Fulfillment Time and Dealer Satisfaction Score together, since slow deliveries usually show up in dealer survey scores a month or two later.
Best Practices
- Agree on KPI formulas with finance and sales before entering data, and keep them in the KPI Definition sheet.
- Enter actuals on a fixed date each month.
- Set realistic targets per month instead of dividing the annual target by 12, so seasonality is respected.
- Look at YTD as well as MTD; one weak month matters less if the year is on track.
- Use KPI Trend before dealer review meetings to show the pattern, not a single month.
Limitations and Who Should Not Use It
This template is a KPI summary at network level. It does not store transactions or rank individual dealers, and it does not calculate the KPIs from raw data; you enter monthly results. If you need dealer-by-dealer leaderboards or a live CRM or DMS connection, a transactional dashboard or BI tool is a better fit. For monthly management reporting, it is quick to set up and easy to maintain.
Related KPI Dashboards
If you manage distributors rather than dealers, see the Distributor Performance KPI Dashboard in Google Sheets and the Channel Sales KPI Dashboard. Automotive teams can compare the Automotive KPI Dashboard in Google Sheets and the Car Dealership Dashboard in Google Sheets, and franchise networks may prefer the Franchise Management KPI Dashboard.
Related templates on NextGenTemplates: the Dealer Network KPI Dashboard in Excel and the Dealer Network KPI Dashboard in Power BI.
If you want to build MTD/YTD dashboards like this yourself, the Excel Pivot Tables & Dashboards course on NextGenTemplates Academy walks through the summarising and layout steps.
Frequently Asked Questions
Which KPIs does the Dealer Network KPI Dashboard track?
Active Dealers, Dealer Retention Rate, Average Sales per Dealer, Total Sales, Dealer Sales Growth, Dealer Satisfaction Score (DSS), Dealer Response Rate, Geographic Coverage Ratio, Dealer Penetration Rate and Average Order Fulfillment Time.
What is the difference between MTD and YTD?
MTD (month-to-date) covers the selected month only. YTD (year-to-date) covers the period from the first month of your year up to the selected month.
Can I use a fiscal year that starts in April?
Yes. Change the first month in cell E1 of the Actual Number sheet and the month headers follow it.
What do UTB and LTB mean?
UTB means upper the better, so higher values are good. LTB means lower the better, as with Average Order Fulfillment Time. Check the Type column when you read each comparison, because a high percentage is good news for a UTB KPI but bad news for an LTB one.
Can I add or change KPIs?
Yes. Edit the KPI Definition sheet and use the same KPI names in the Actual Number, Target and Previous Year Number sheets.
Does it calculate KPIs from raw sales data?
No. The formulas on the KPI Definition sheet document how each KPI is calculated, but you enter the monthly results yourself.
Wrapping Up
The Dealer Network KPI Dashboard in Google Sheets gives you a clean monthly view of 10 dealer KPIs against target and last year. Set your year start, load targets and last year’s numbers, and enter this month’s actuals to see where your network stands before the next dealer review.
Get the Dealer Network KPI Dashboard
📅 Last updated: October 2026