The Channel Sales KPI Dashboard in Google Sheets tracks 13 channel sales KPIs — from Total Sales Volume and Sales Conversion Rate to Channel ROI and Channel Cost per Acquisition — on one page, with month-to-date (MTD) and year-to-date (YTD) results compared against target and the previous year.
It is built for channel sales managers, partner managers and sales operations teams who sell through distributors, resellers or partners and need a monthly scorecard without a BI tool. You type your actual, target and previous-year numbers into three input sheets, pick a month, and the dashboard calculates every comparison with up/down arrows.
The workbook has six sheets: Dashboard, KPI Trend, Actual Numbers, Target, Previous Year Numbers and KPI Definition. This guide explains each one, lists all 13 KPIs with their formulas, and shows how to load your own data.
🎥 Watch the Video Tutorial
Get the Channel Sales KPI Dashboard
What Problem Does This Dashboard Solve?
Channel sales data usually arrives in pieces: partner reports, CRM exports and finance figures, each in a different format. Managers end up rebuilding the same monthly summary by hand and still struggle to answer simple questions — are we ahead of target this month, and are we better than last year?
This dashboard fixes the layout once. Every KPI has a group, a unit, a formula, a definition and a direction (higher or lower is better). You only maintain the numbers, and the comparisons stay consistent from month to month.
The 13 Channel Sales KPIs in the Template
These are the KPIs exactly as they appear on the KPI Definition sheet. UTB means “upper the better” (higher is better) and LTB means “lower the better”.
| # | KPI | Group | What it measures | Formula | Better when |
|---|---|---|---|---|---|
| 1 | Total Sales Volume | Sales Performance | Total value of sales generated by the channel | SUM(Sales Amount) | Higher (UTB) |
| 2 | Sales Growth Rate | Sales Performance | Increase in sales compared to the previous period | (Current Sales − Previous Sales) / Previous Sales × 100 | Higher (UTB) |
| 3 | Average Deal Size | Sales Performance | Average value of each sale closed by the channel | Total Sales / Number of Deals | Higher (UTB) |
| 4 | Sales Conversion Rate | Sales Performance | Share of leads converted into closed sales | (Closed Deals / Leads) × 100 | Higher (UTB) |
| 5 | Channel Profitability | Sales Performance | Profit after accounting for costs | Total Sales − Total Costs | Higher (UTB) |
| 6 | Lead Response Time | Lead Management | Time taken to respond to a new lead | Average time between lead capture and response | Lower (LTB) |
| 7 | Lead Conversion Rate | Lead Management | Share of leads that result in a sale | (Converted Leads / Total Leads) × 100 | Higher (UTB) |
| 8 | Net Promoter Score (NPS) | Customer Satisfaction | Customer satisfaction and loyalty (score −100 to 100) | %Promoters − %Detractors | Higher (UTB) |
| 9 | Customer Retention Rate | Customer Satisfaction | Customers retained over a period | (Customers Retained / Customers at Start) × 100 | Higher (UTB) |
| 10 | Channel ROI | Channel Management | Return on investment from a sales channel | (Revenue from Channel − Costs of Channel) / Costs of Channel × 100 | Higher (UTB) |
| 11 | Channel Coverage | Channel Management | Share of channels actively generating sales | (Number of Active Channels / Total Number of Channels) × 100 | Higher (UTB) |
| 12 | Channel Cost per Acquisition | Channel Efficiency | Cost of acquiring each customer through the channel | Total Channel Costs / Number of Acquisitions | Lower (LTB) |
| 13 | Channel Inventory Turnover | Channel Efficiency | How fast inventory is sold and replaced through the channel | Sales Volume / Average Inventory | Higher (UTB) |
The Six Sheets Explained
1. Dashboard
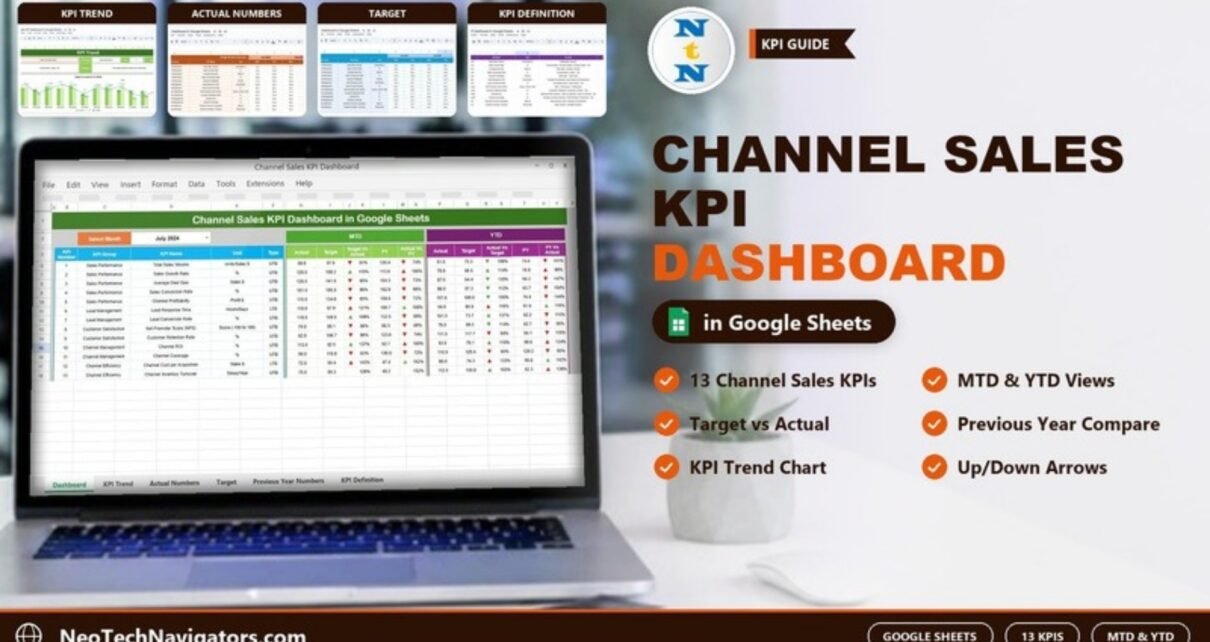
The Dashboard is the monthly scorecard. Choose a month in the Select Month dropdown (cell D3; July 2024 in the screenshot) and every value refreshes. The left block lists KPI Number, KPI Group, KPI Name, Unit and Type. Two blocks follow:
- MTD — Actual, Target, Target vs Actual, PY and Actual vs PY for the selected month.
- YTD — Actual, Target, Actual vs Target, PY and PY vs Actual from the start of the year to the selected month.
The comparisons show a percentage, flagged with a green or red up/down arrow. For example, in July 2024 Total Sales Volume has an MTD Actual of 89.0 against a Target of 97.9, so Target vs Actual is 89.0 ÷ 97.9 ≈ 91%; against a PY value of 120.4 it reaches about 74%. Sales Growth Rate is ahead: 120.0 against a target of 109.2 gives 110%.
For lower-the-better KPIs, a percentage above 100% is a warning. Lead Response Time shows an MTD Actual of 118.0 against a target of 97.9 (121%), and Channel Cost per Acquisition shows 72.0 against 50.4 (143%) — both flagged with red arrows because higher is worse.

The comparison logic is simple enough to check by hand:
Target vs Actual = Actual / Target
Actual vs PY     = Actual / PY
Example: 89.0 / 97.9 = 0.909  -> 91%
2. KPI Trend
The KPI Trend sheet focuses on one KPI at a time. Pick a KPI in Select KPI (cell C3) and the sheet shows its KPI Group, Unit, Type, Formula and Definition, plus a Target Vs Actual Vs PY (MTD) chart for January to December 2024. In the screenshot, Sales Conversion Rate is selected, with the formula (Closed Deals / Leads) * 100.

3. Actual Numbers
This is where you enter your real results: one row per KPI and an MTD and YTD column for each month. Cell E1 holds the first month of the year (labelled “Change the first of the year”), so you can align the sheet to a January or April financial year; the month headers follow from it. The sample starts at Jan-2024.

4. Target
The Target sheet uses the same layout — MTD and YTD targets for every KPI and month — so the dashboard can compare like with like.

5. Previous Year Numbers
Enter last year’s MTD and YTD results here (Jan-2023 onward in the sample). These drive the PY columns on the dashboard and the PY bars on the trend chart.

6. KPI Definition
The KPI Definition sheet is the master list behind everything else: #, KPI Group, KPI Name, Unit, Formula, Definition and Type (UTB/LTB). The table earlier in this article reproduces it.

How to Use the Dashboard With Your Own Data
- Open the KPI Definition sheet and confirm the 13 KPIs, formulas and UTB/LTB types match how your company measures channel sales.
- Set the first month of your year in cell E1 of the Actual Numbers sheet.
- Enter last year’s MTD and YTD figures in Previous Year Numbers.
- Enter this year’s MTD and YTD targets in Target.
- Each month, calculate your KPIs from your CRM or partner reports and type the results into Actual Numbers.
- Go to the Dashboard, pick the month in D3 and review the red arrows first.
- Use KPI Trend to look at any KPI that is off target and see whether it is a one-month dip or a trend.
Real-World Use Cases
- Monthly channel review: a channel sales manager opens the dashboard in the review meeting and walks through MTD vs target, focusing on red arrows.
- Distributor-led manufacturer: tracks Channel Inventory Turnover and Channel Coverage to see whether stock is moving and how many channels are actually selling.
- Partner programme budgeting: uses Channel ROI and Channel Cost per Acquisition to decide where to put next quarter’s partner marketing funds.
Best Practices
- Agree the calculation rules (for example, what counts as a “lead”) before entering numbers, so months are comparable.
- Update Actual Numbers on a fixed day each month.
- Read lower-the-better KPIs carefully: above 100% of target is bad for Lead Response Time and Channel Cost per Acquisition.
- Keep both MTD and YTD in view — a weak month inside a strong year needs a different response from a weak year.
- Protect the Dashboard and KPI Definition sheets with Data > Protect sheets and ranges so only input sheets are edited.
Limitations and Who Should Not Use It
The dashboard reports KPI results; it does not calculate them from raw transactions. You enter the finished MTD and YTD values, so you still need a CRM export or a separate calculation sheet. It also tracks the channel as a whole rather than partner by partner — if you need a ranking of individual distributors or resellers, a partner-level dashboard is a better fit. Teams that want live CRM data without manual entry should look at a BI tool connected to their CRM.
Related Dashboards
For partner-level views, see the Distributor Performance KPI Dashboard and the Reseller KPI Dashboard in Google Sheets. The Partner Onboarding KPI Dashboard covers the earlier stage of the partner lifecycle, and the Sales KPI Dashboard in Google Sheets and Sales KPI Scorecard suit direct sales teams.
Prefer Excel? The same topic is available as the Channel Sales KPI Dashboard in Excel.
If you want to learn how scorecards like this are built, the Pivot Tables & Dashboards course on NextGenTemplates Academy covers target-vs-actual layouts and dashboard design step by step.
Frequently Asked Questions
Which KPIs does the Channel Sales KPI Dashboard track?
Thirteen: Total Sales Volume, Sales Growth Rate, Average Deal Size, Sales Conversion Rate, Channel Profitability, Lead Response Time, Lead Conversion Rate, Net Promoter Score, Customer Retention Rate, Channel ROI, Channel Coverage, Channel Cost per Acquisition and Channel Inventory Turnover.
What do UTB and LTB mean?
UTB is “upper the better” — a higher value is good. LTB is “lower the better” — a lower value is good. Lead Response Time and Channel Cost per Acquisition are the two LTB KPIs.
How do I change the reporting month?
Select the month in the dropdown in cell D3 on the Dashboard. All MTD and YTD values update for that month.
Can my financial year start in April?
Yes. Change the first month of the year in cell E1 of the Actual Numbers sheet and the month columns follow from it.
Can I change the KPIs?
You can edit names, units, formulas and types on the KPI Definition sheet. Keep the row order the same across the Actual, Target and Previous Year sheets so the dashboard lines up.
Does it connect to my CRM automatically?
No. You enter MTD and YTD values manually or paste them from a CRM export.
Wrapping Up
The Channel Sales KPI Dashboard in Google Sheets gives you a clear monthly answer to “are our channels on target and ahead of last year?” across 13 defined KPIs. Load your targets and last year’s numbers, enter this month’s actuals, and start your next channel review from the red arrows.
Get the Channel Sales KPI Dashboard in Google Sheets
📅 Last updated: October 2026