Sales performance drives business growth — and monitoring key sales metrics helps organizations stay competitive. The Sales KPI Scorecard in Google Sheets is a ready-to-use template designed to track performance across multiple KPIs with dynamic visuals and interactive controls.
In this article, we’ll explain how this Sales KPI Scorecard works, its key features, and best practices for using it effectively.
What Is a Sales KPI Scorecard in Google Sheets?
A Sales KPI Scorecard is a performance tracking tool that consolidates your sales data and KPIs in a single dashboard. It helps sales managers, executives, and teams analyze monthly and yearly performance, visualize progress, and identify areas of improvement.
Built in Google Sheets, this scorecard provides flexibility, automation, and collaboration — all within a familiar spreadsheet interface.
Key Features of the Sales KPI Scorecard
Click to Buy Sales KPI Scorecard in Google Sheets
This Google Sheets template is designed with simplicity and insight in mind. It includes multiple tabs for visualization, trends, and definitions:
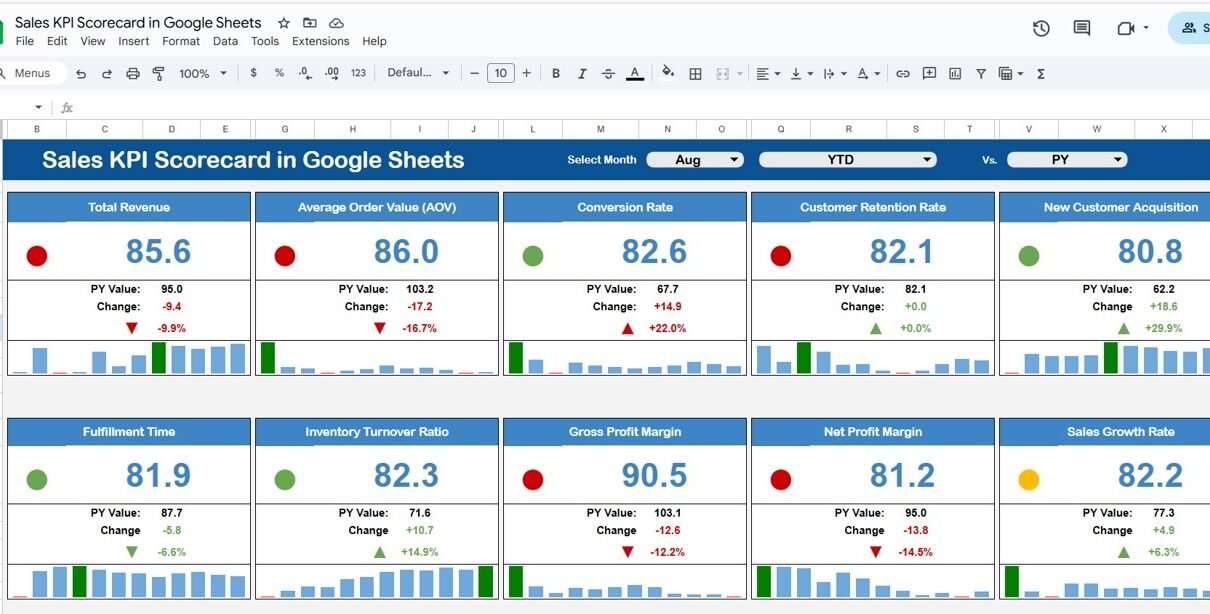
1. Dashboard Sheet Tab
The Dashboard Sheet serves as the main interface of the scorecard.
Highlights:
-
Month Dropdown (Range D3): Select any month to refresh all KPIs dynamically.
-
Traffic Light Indicators: Colors (Red, Yellow, Green) and arrows show KPI trends and performance.
-
MTD and YTD Toggle: Click MTD (Month-to-Date) or YTD (Year-to-Date) to switch between views.
-
Ten Key Sales KPIs: Includes metrics that measure sales growth, efficiency, and conversion performance.

Click to Buy Sales KPI Scorecard in Google Sheets
2. KPI Trend Sheet Tab
The KPI Trend Sheet helps track performance patterns over time.
Key Features:
-
Dropdown in Range C3 to select any KPI
-
Automatically displays KPI Group, Unit, Formula, and Definition
-
Shows KPI type: Upper the Better (UTB) or Lower the Better (LTB)
-
Trend charts comparing MTD, YTD, and previous year performance
This tab helps visualize how sales metrics evolve and highlights areas requiring focus.

3. KPI Definition Sheet Tab
The KPI Definition Sheet provides clarity and consistency across all KPIs.
Columns Included:
-
KPI Name – Name of the performance indicator
-
KPI Group – Category (Sales, Marketing, Customer Success, etc.)
-
Unit – Metric unit (e.g., %, $, Count)
-
Formula – How the KPI is calculated
-
Definition – Description of what the KPI measures
-
Type – LTB (Lower the Better) or UTB (Upper the Better)

Click to Buy Sales KPI Scorecard in Google Sheets
4. Data Input Sheet Tab
This is the data backbone of your scorecard.
-
Input monthly Actual, Target, and Previous Year data for each KPI.
-
The dashboard updates automatically based on these inputs.
-
Ensures clean and structured data for accurate analysis.

5. Color Settings Tab
This sheet allows you to modify traffic light thresholds for performance visualization.
-
Define ranges for Red (Poor), Yellow (Average), and Green (Excellent).
-
Customize according to your organization’s goals and performance standards.

Click to Buy Sales KPI Scorecard in Google Sheets
Advantages of Using the Sales KPI Scorecard
-
Centralized Sales Data: Consolidate multiple sales KPIs in one Google Sheet.
-
Dynamic Visualization: Interactive charts and indicators for real-time tracking.
-
Flexible Analysis: Switch easily between MTD and YTD performance.
-
Trend Identification: Quickly recognize growth patterns and bottlenecks.
-
Team Collaboration: Multiple team members can view or update data simultaneously.
-
Action-Oriented Insights: Focus on underperforming areas using conditional formatting.
Best Practices for Using the Scorecard
Click to Buy Sales KPI Scorecard in Google Sheets
-
Update Data Regularly: Enter data monthly to maintain accuracy.
-
Set Realistic Targets: Align KPI targets with your quarterly goals.
-
Review Trends Monthly: Identify recurring patterns and make timely adjustments.
-
Customize Indicators: Modify traffic light thresholds to fit your sales strategy.
-
Share with Stakeholders: Use the collaborative power of Google Sheets for team transparency.
-
Track Both MTD and YTD: Compare short-term and long-term sales performance.
How This Scorecard Helps Sales Teams
-
Sales Managers: Evaluate performance and coach teams effectively.
-
Executives: Align KPIs with business objectives.
-
Analysts: Identify data trends and forecast future outcomes.
-
Teams: Track individual and group performance transparently.
Frequently Asked Questions (FAQs)
Click to Buy Sales KPI Scorecard in Google Sheets
Q1: Can I add more KPIs to the scorecard?
Yes, you can easily expand the KPI Definition and Data Input sheets to include additional metrics.
Q2: How does the traffic light system work?
It uses conditional formatting to indicate performance levels — green (on track), yellow (warning), and red (underperforming).
Q3: Can I track quarterly performance instead of monthly?
Yes, by modifying the date filters and aggregation formulas, you can switch to quarterly analysis.
Q4: Is this dashboard shareable with my team?
Yes, since it’s built in Google Sheets, you can share it with controlled permissions for view or edit access.
Q5: Does the dashboard support year-over-year comparison?
Yes, it includes previous-year data for each KPI to track progress over time.
Conclusion
The Sales KPI Scorecard in Google Sheets is an all-in-one solution for tracking, analyzing, and improving sales performance. With MTD and YTD views, dynamic traffic lights, and trend analysis, this scorecard enables sales managers and teams to make better decisions, hit targets consistently, and drive growth with data-driven insights.
Visit our YouTube channel to learn step-by-step video tutorials
Youtube.com/@NeotechNavigators
Watch the step-by-step video Demo: