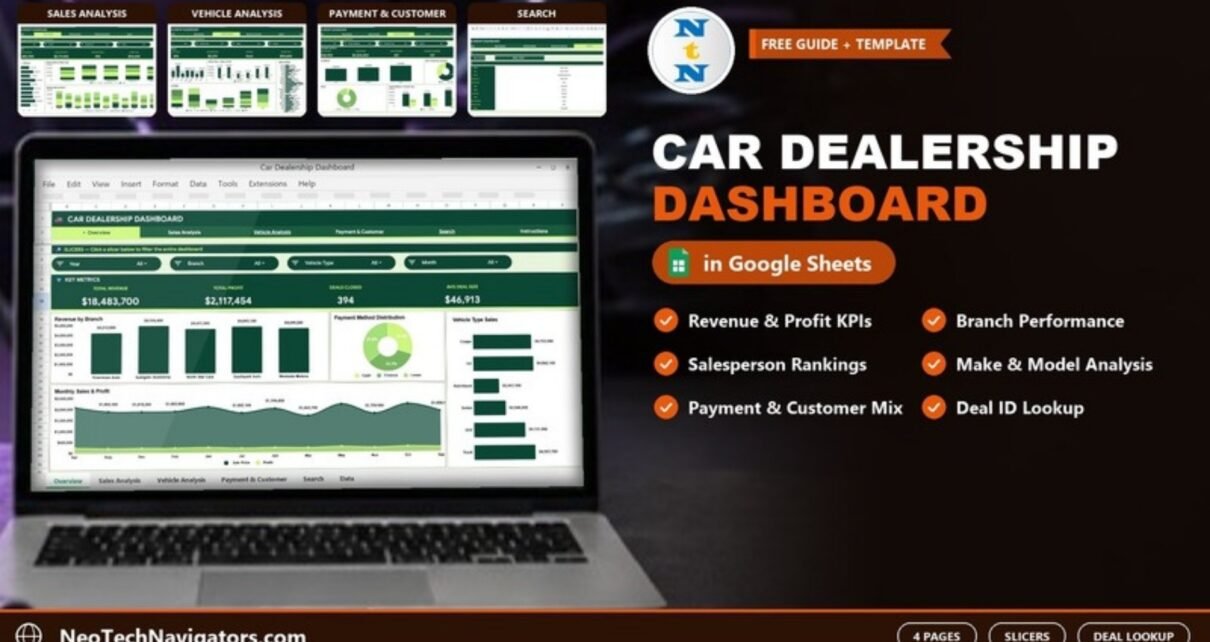
The Car Dealership Dashboard in Google Sheets turns a simple list of vehicle deals into a four-page sales report: revenue and profit by branch, salesperson performance, make and model analysis, and payment and customer trends. Every page has its own slicers, so a manager can move from the whole group to one branch, one salesperson or one vehicle type in a couple of clicks.
It is aimed at independent dealers, small dealer groups with a few branches, sales managers and consultants who already keep deal records in a spreadsheet and want a clear weekly or monthly review without buying a full dealership management system. The dashboard is built on Google Sheets pivot tables, charts and slicers, with a Deal ID lookup page for answering questions about a single sale.
This guide walks through each page using the real sample data in the template, explains how the headline numbers are calculated, and shows how to load your own deals.
🎥 Watch the Video Tutorial
Get the Car Dealership Dashboard
What the Car Dealership Dashboard in Google Sheets Helps You Answer
A dealership produces plenty of data, but the weekly sales meeting usually comes down to a few questions:
- How much revenue and profit did completed deals bring in, and how many deals closed?
- Which branches and salespeople are carrying the numbers?
- Which makes, models and vehicle types sell best, and which earn the most profit?
- How are customers paying (cash, finance or lease), and how many are new versus returning?
The dashboard puts each of those questions on its own page, with a navigation bar at the top linking Overview, Sales Analysis, Vehicle Analysis, Payment & Customer, Search and Instructions. All of it reads from one Data sheet.
Dashboard Pages Explained
1. Overview
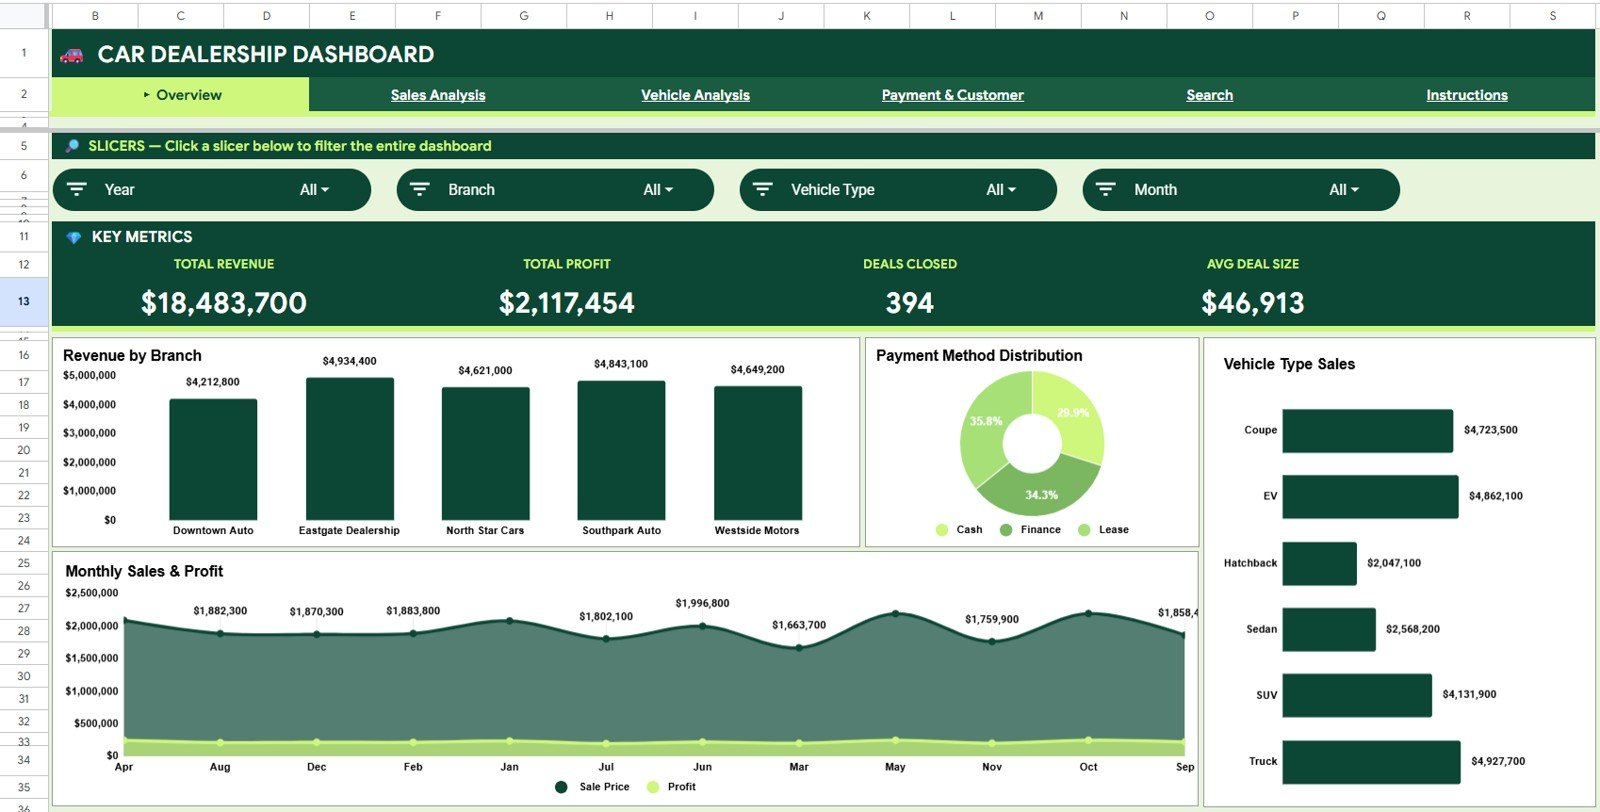
The Overview page has four slicers: Year, Branch, Vehicle Type and Month. Under them, the Key Metrics band shows four cards. With the sample data and all slicers set to All, they read:
- Total Revenue: $18,483,700
- Total Profit: $2,117,454
- Deals Closed: 394
- Avg Deal Size: $46,913
Four charts sit below: Revenue by Branch (Downtown Auto, Eastgate Dealership, North Star Cars, Southpark Auto and Westside Motors), Payment Method Distribution (Cash, Finance, Lease), Vehicle Type Sales (Coupe, EV, Hatchback, Sedan, SUV, Truck) and Monthly Sales & Profit, which plots sale price and profit by month. In the sample file the Revenue by Branch and Vehicle Type Sales bars add up to $23,260,500, more than the $18,483,700 revenue card, so those two charts include pending and cancelled deals as well as completed ones.
2. Sales Analysis
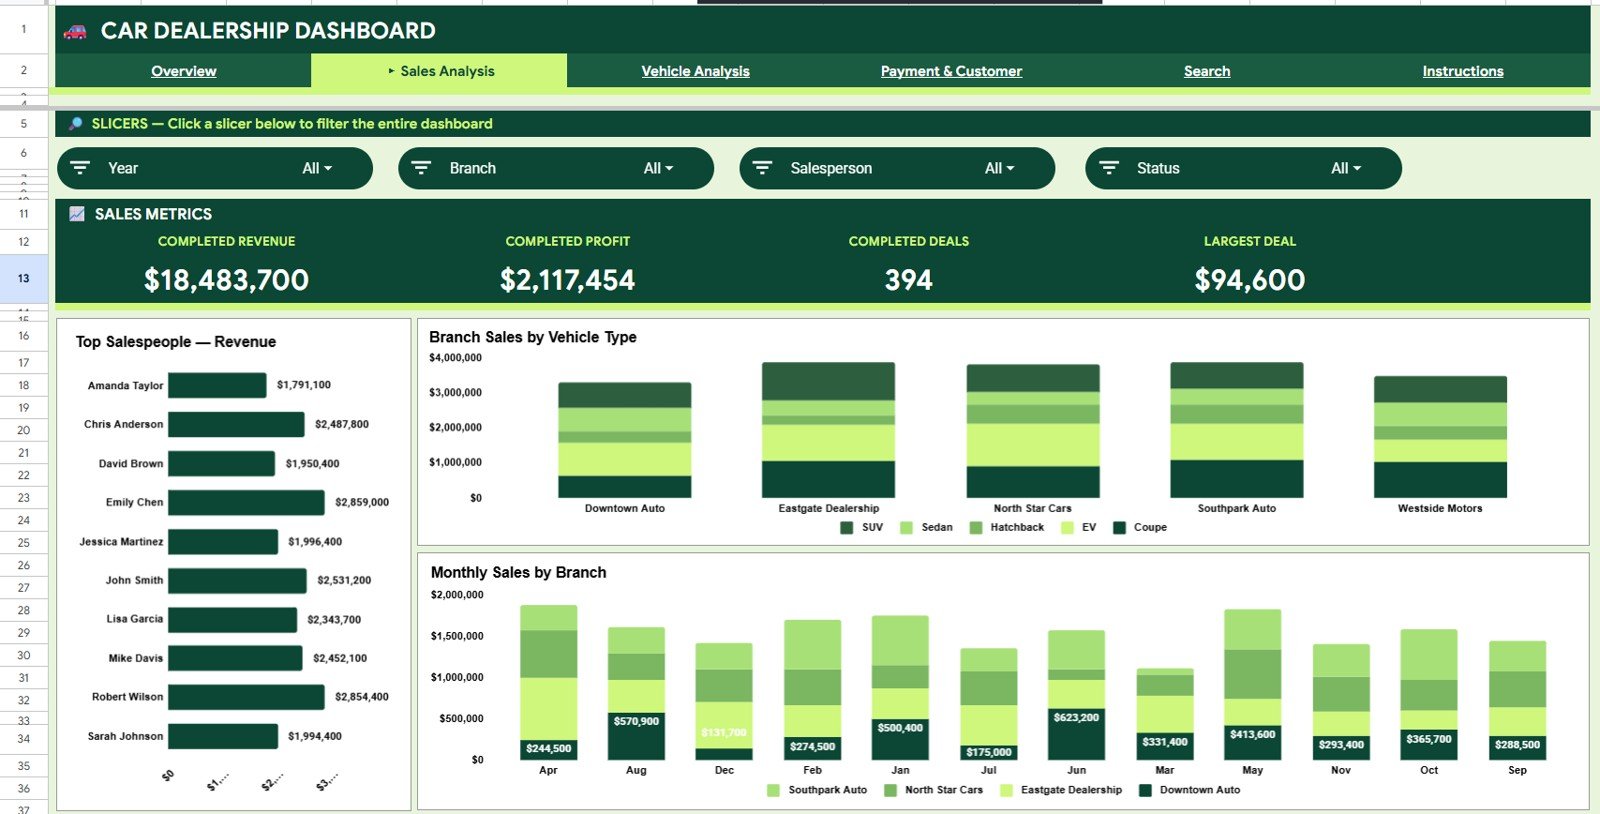
Slicers here are Year, Branch, Salesperson and Status. The Sales Metrics band shows Completed Revenue, Completed Profit, Completed Deals and Largest Deal ($94,600 in the sample).
The charts are Top Salespeople — Revenue (ten salespeople, from Amanda Taylor to Sarah Johnson), Branch Sales by Vehicle Type as stacked columns, and Monthly Sales by Branch. This is the page for commission reviews and for spotting whether one branch depends on a single vehicle type.
3. Vehicle Analysis
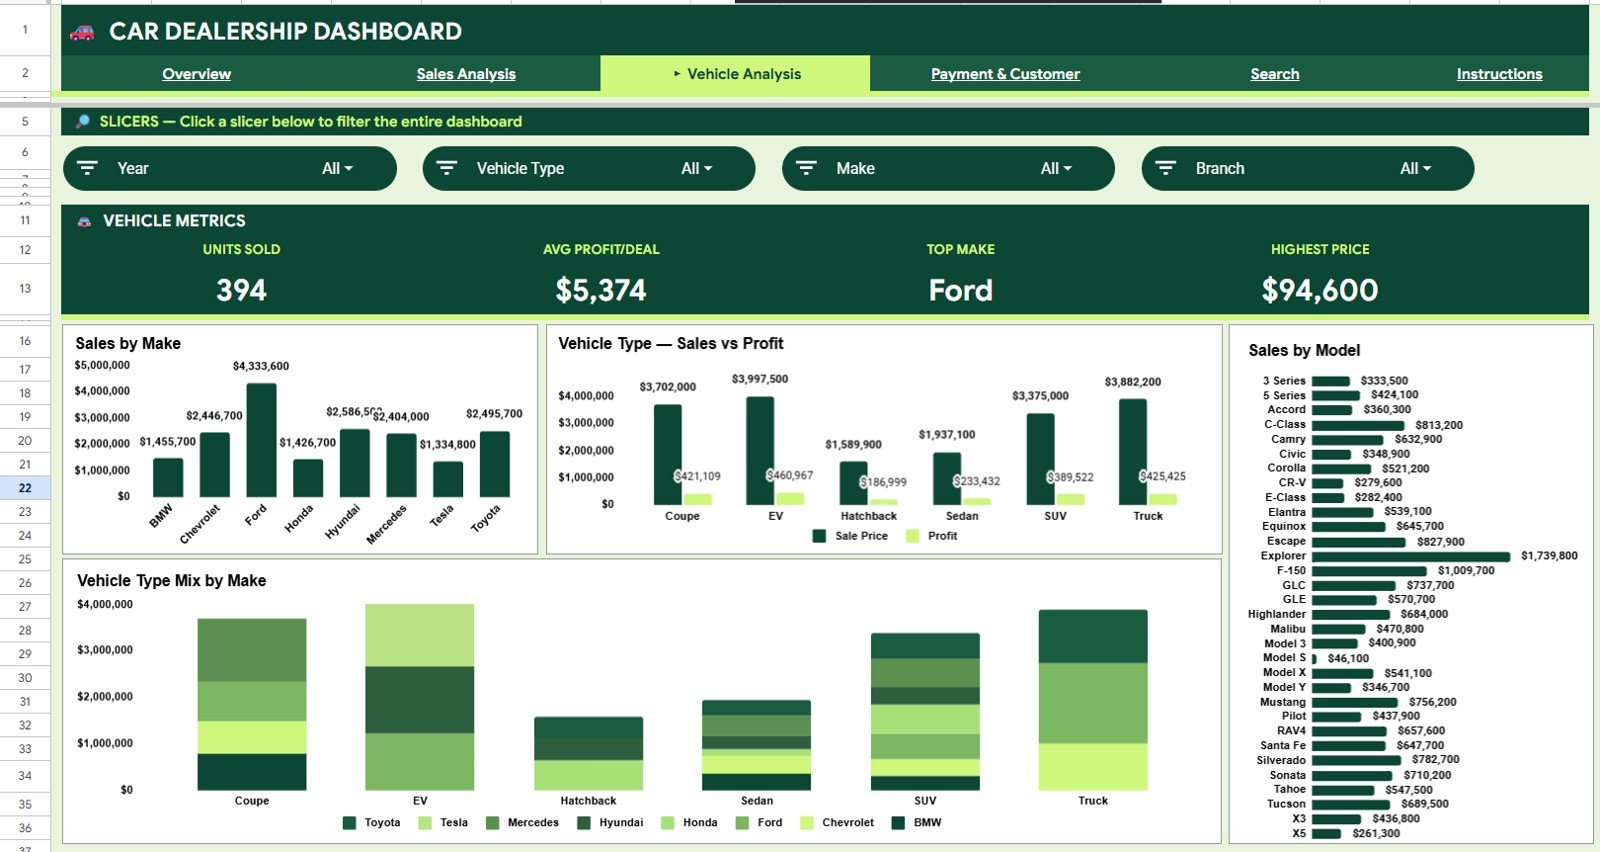
Slicers: Year, Vehicle Type, Make and Branch. The Vehicle Metrics band shows Units Sold (394), Avg Profit/Deal ($5,374), Top Make (Ford) and Highest Price ($94,600).
Charts include Sales by Make (BMW, Chevrolet, Ford, Honda, Hyundai, Mercedes, Tesla, Toyota), Vehicle Type — Sales vs Profit, Sales by Model (from 3 Series to X5) and Vehicle Type Mix by Make. Use it to decide which makes and models deserve more stock and which vehicle types earn the most profit for their sales value.
4. Payment & Customer
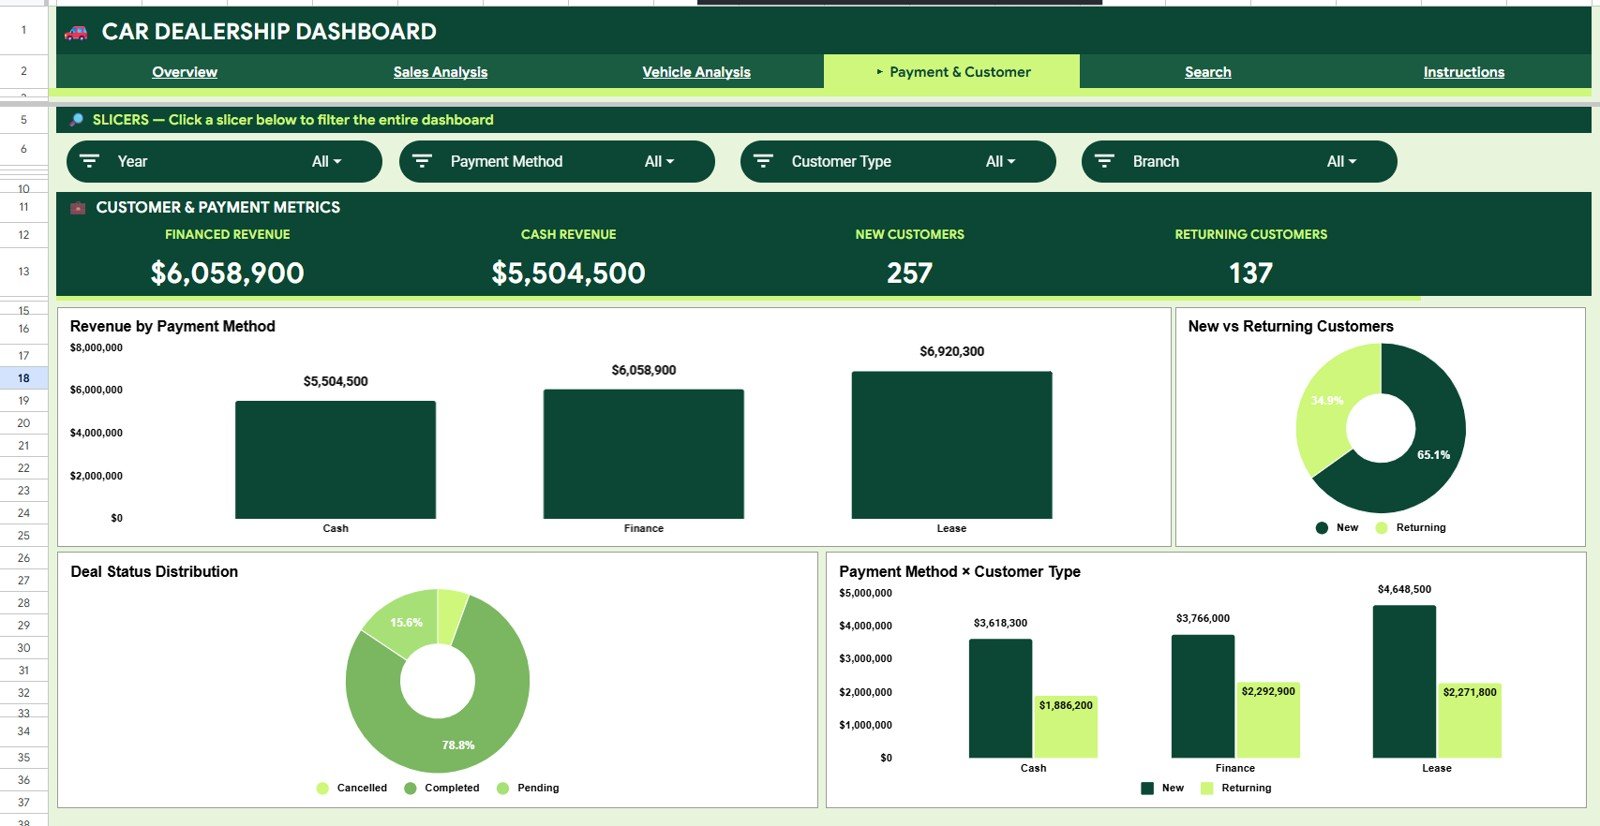
Slicers: Year, Payment Method, Customer Type and Branch. The Customer & Payment Metrics band shows Financed Revenue ($6,058,900), Cash Revenue ($5,504,500), New Customers (257) and Returning Customers (137).
Charts: Revenue by Payment Method (Cash $5,504,500, Finance $6,058,900, Lease $6,920,300), New vs Returning Customers, Deal Status Distribution (Completed, Pending, Cancelled) and Payment Method × Customer Type.
5. Search (Deal Lookup)
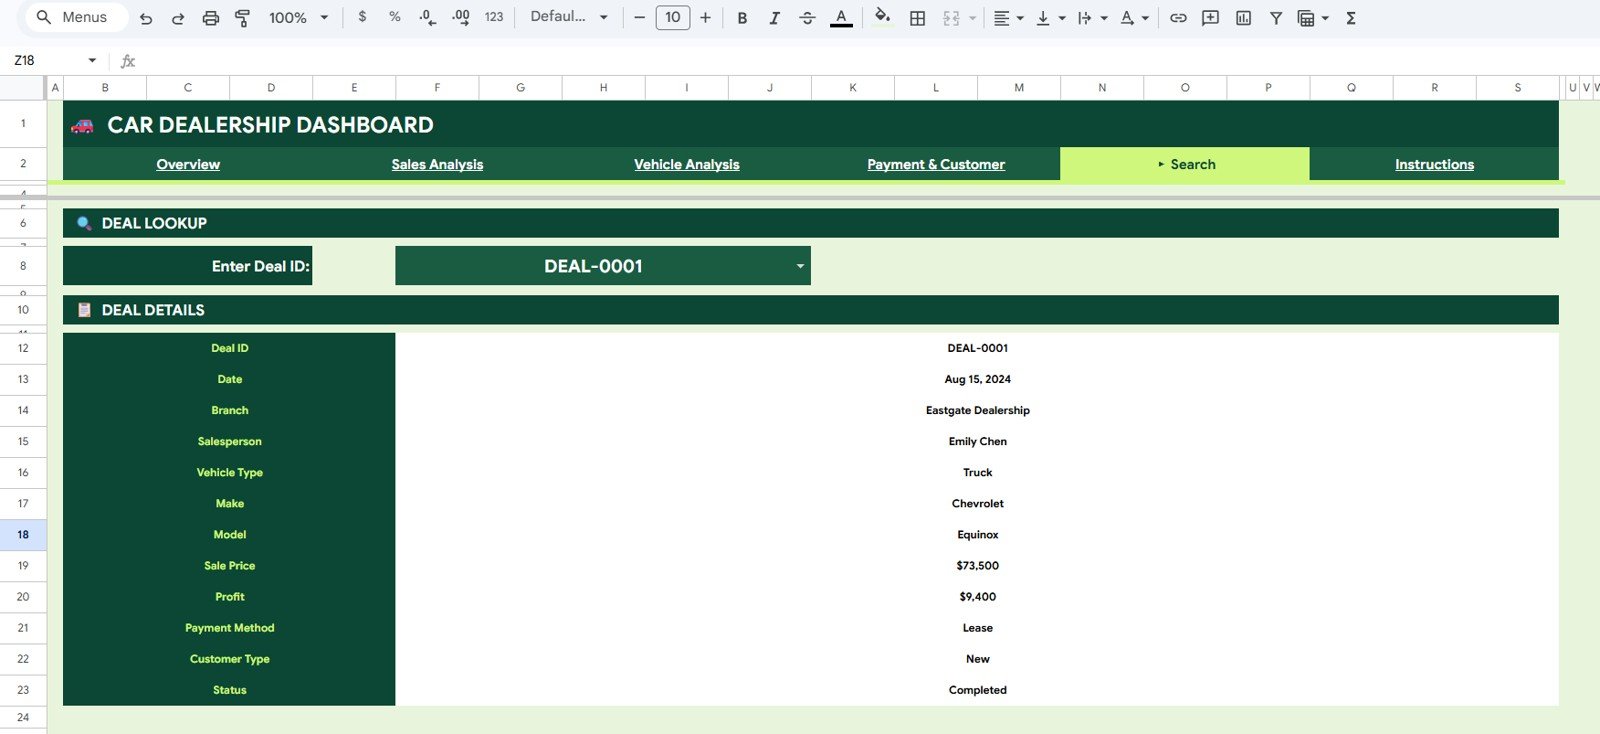
Choose a Deal ID in the Enter Deal ID dropdown and the Deal Details panel shows the full record: Deal ID, Date, Branch, Salesperson, Vehicle Type, Make, Model, Sale Price, Profit, Payment Method, Customer Type and Status. For example, DEAL-0001 shows Aug 15, 2024, Eastgate Dealership, Emily Chen, vehicle type Truck, Chevrolet Equinox, a $73,500 sale price with $9,400 profit, paid by Lease, a New customer and status Completed.
6. Data Sheet
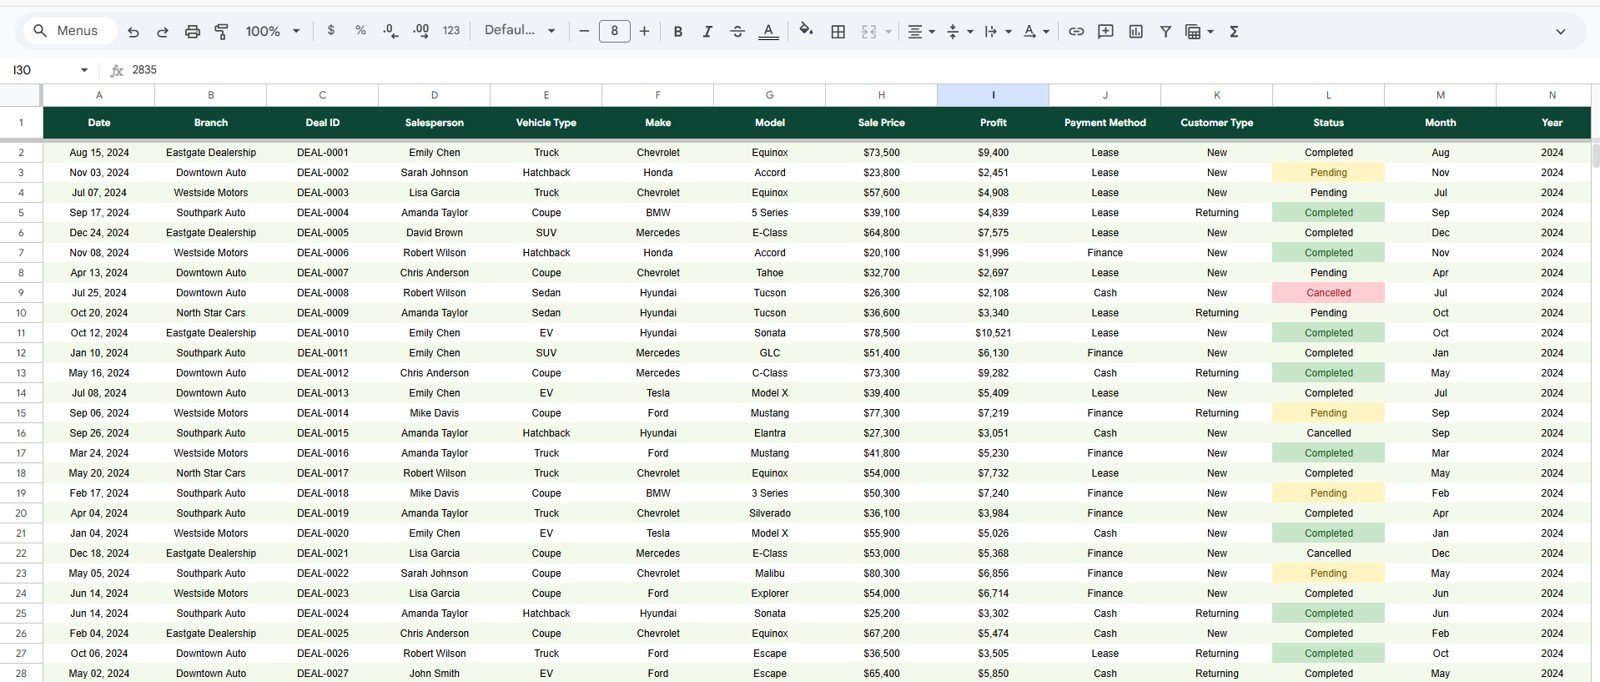
The Data sheet holds one row per deal with fourteen columns: Date, Branch, Deal ID, Salesperson, Vehicle Type, Make, Model, Sale Price, Profit, Payment Method, Customer Type, Status, Month and Year. The Status column uses three values: Completed, Pending and Cancelled.
How the Headline Numbers Are Calculated
The Sales Analysis page labels the same totals as Completed Revenue, Profit and Deals, so the headline cards count deals whose Status is Completed. The averages are simple ratios, and you can check them against the sample figures:
| Metric | Where it appears | How it is worked out | Sample result |
|---|---|---|---|
| Total / Completed Revenue | Overview, Sales Analysis | Sum of Sale Price for completed deals | $18,483,700 |
| Total / Completed Profit | Overview, Sales Analysis | Sum of Profit for completed deals | $2,117,454 |
| Deals Closed / Units Sold | Overview, Vehicle Analysis | Count of completed deals | 394 |
| Avg Deal Size | Overview | Revenue ÷ Deals Closed | $18,483,700 ÷ 394 = $46,913 |
| Avg Profit/Deal | Vehicle Analysis | Profit ÷ Units Sold | $2,117,454 ÷ 394 = $5,374 |
| New / Returning Customers | Payment & Customer | Count of completed deals by Customer Type | 257 + 137 = 394 |
If you want the same figures in a cell elsewhere in your file, these formulas reproduce them from the Data sheet (Sale Price in column H, Profit in column I, Status in column L):
=SUMIFS(Data!H:H, Data!L:L, "Completed")
=SUMIFS(Data!I:I, Data!L:L, "Completed")
=COUNTIFS(Data!L:L, "Completed")
=SUMIFS(Data!H:H, Data!L:L, "Completed") / COUNTIFS(Data!L:L, "Completed")
Replace Data with your Data sheet’s tab name if it differs. One extra figure worth watching that the dashboard does not show as a card is gross margin: completed profit ÷ completed revenue, which is about 11.5% in the sample.
How to Use the Dashboard With Your Own Data
- Open the copy link in the PDF guide and save the file to your Google Drive.
- Export your deals from your sales log or DMS and arrange them in the same fourteen-column order as the Data sheet.
- Paste your rows over the sample data, keeping the header row unchanged.
- Fill Month and Year for every row so the time slicers and monthly charts work.
- Use the same spelling every time for branches, salespeople, makes, payment methods and statuses (Completed, Pending, Cancelled).
- Open the Overview page, set the slicers to All, and check that Deals Closed matches your own count of completed deals.
Real-World Use Cases
- Weekly sales meeting: a sales manager filters Sales Analysis to the current Year and Status = Completed, then reviews Top Salespeople — Revenue and Monthly Sales by Branch with the team.
- Stock planning: a used-car buyer uses Vehicle Analysis to compare Sales by Make and Vehicle Type — Sales vs Profit before choosing what to buy at the next auction.
- Finance desk review: the F&I lead watches Revenue by Payment Method and Payment Method × Customer Type to see whether lease and finance business is growing with new or returning buyers.
Template vs Plain Spreadsheet vs Dealership Software
| Point | This dashboard | Plain deal spreadsheet | Dealership management system |
|---|---|---|---|
| Main job | Sales reporting and analysis | Record keeping | Full operations: inventory, F&I, CRM, service |
| Charts and slicers | Ready on four pages | Build yourself | Built-in reports |
| Single-deal lookup | Search page by Deal ID | Filter or Ctrl+F | Yes |
| Data entry | Paste or type deal rows | Type rows | Captured as deals are worked |
| Cost model | One-time purchase | Free, plus your time | Usually a monthly subscription |
Best Practices
- Keep the column order of the Data sheet as it is; add any extra fields at the far right.
- Use data validation dropdowns for Branch, Salesperson, Payment Method and Status so typos do not create duplicate categories.
- Update the data weekly so problems show up while there is still time in the month to act.
- Give edit access only to the people who enter deals and view access to everyone else.
- Start a fresh copy each year and keep last year’s file for comparison.
Limitations: Who Should Not Use It
- It does not manage inventory, appraisals, finance paperwork, service work orders or leads. It only reports on deals you enter.
- There is no live connection to a DMS; you refresh it by pasting new data.
- Very large groups with tens of thousands of deals across many years may find Google Sheets slow and should look at the Car Dealership Dashboard in Power BI.
Related Automotive Templates and Guides
Prefer Excel? There is also a Car Dealership Dashboard in Excel. On this blog, the Used Car Sales KPI Dashboard in Google Sheets adds target and previous-year comparisons, and the Automotive KPI Scorecard in Google Sheets gives a scorecard-style view. For a broader view of the industry see the Automotive Dashboard in Google Sheets, and service businesses can look at the Auto Repair Dashboard in Google Sheets.
If you would like to build dashboards like this yourself, the Excel Pivot Tables and Dashboards course on NextGenTemplates Academy covers pivot tables, slicers and dashboard layout in structured lessons.
Frequently Asked Questions
What does the Car Dealership Dashboard in Google Sheets track?
Revenue, profit, deal count, average deal size, salesperson revenue, branch sales, make and model sales, vehicle type mix, payment method, new versus returning customers and deal status, across four analysis pages plus a Deal ID lookup.
Are cancelled and pending deals included in revenue?
The headline revenue, profit and deal cards are labelled “Completed” on the Sales Analysis page, so they count completed deals. Pending and cancelled deals still appear in the Deal Status Distribution chart, and the Status slicer on Sales Analysis lets you filter by status.
Which slicers are available?
Each of the four analysis pages has four slicers. Overview: Year, Branch, Vehicle Type, Month. Sales Analysis: Year, Branch, Salesperson, Status. Vehicle Analysis: Year, Vehicle Type, Make, Branch. Payment & Customer: Year, Payment Method, Customer Type, Branch.
Can I add new branches, salespeople or makes?
Yes. Add rows with the new names to the Data sheet. The pivot tables and charts pick up new categories when the data range includes them.
Do I need Apps Script or add-ons?
No. The dashboard uses built-in Google Sheets pivot tables, charts, slicers and formulas, and works in a standard Google account.
Does it work on a phone?
You can open it in the Google Sheets mobile app to read the pages and look up deals, though slicers and wide charts are easier to use on a laptop.
Wrapping Up
If your dealership already records deals in a spreadsheet, this dashboard is a fast way to turn that list into a weekly sales review: completed revenue and profit, salesperson and branch rankings, make and model performance, payment mix and a Deal ID lookup. Paste in last month’s deals, set the slicers to All, and check that the numbers match your records; from there, the weekly update takes a few minutes.
Get the Car Dealership Dashboard
📅 Last updated: October 2026