Freelance developers managing projects across multiple platforms face a real analytics gap: according to a 2024 Upwork survey, fewer than 30% of independent tech contractors track revenue by technology stack or platform systematically, yet those who do report 22% higher average hourly rates over three years. The Freelance Developer Dashboard in Google Sheets solves this directly — it tracks 4 KPI headline metrics, 16 pre-built charts across 6 dedicated pages, and uses interactive slicers to let you slice your business data in seconds. Setup takes under 10 minutes, and there is no subscription fee.
Whether you bill through Upwork, Fiverr, Toptal, or directly with clients, knowing which technologies and project types drive your highest revenue is the difference between stagnant rates and intentional growth. This dashboard gives freelance developers that visibility in Google Sheets — a platform already open on your screen — without paying Harvest, FreshBooks, or any other SaaS tool a recurring monthly fee.
Key Features of Freelance Developer Dashboard in Google Sheets
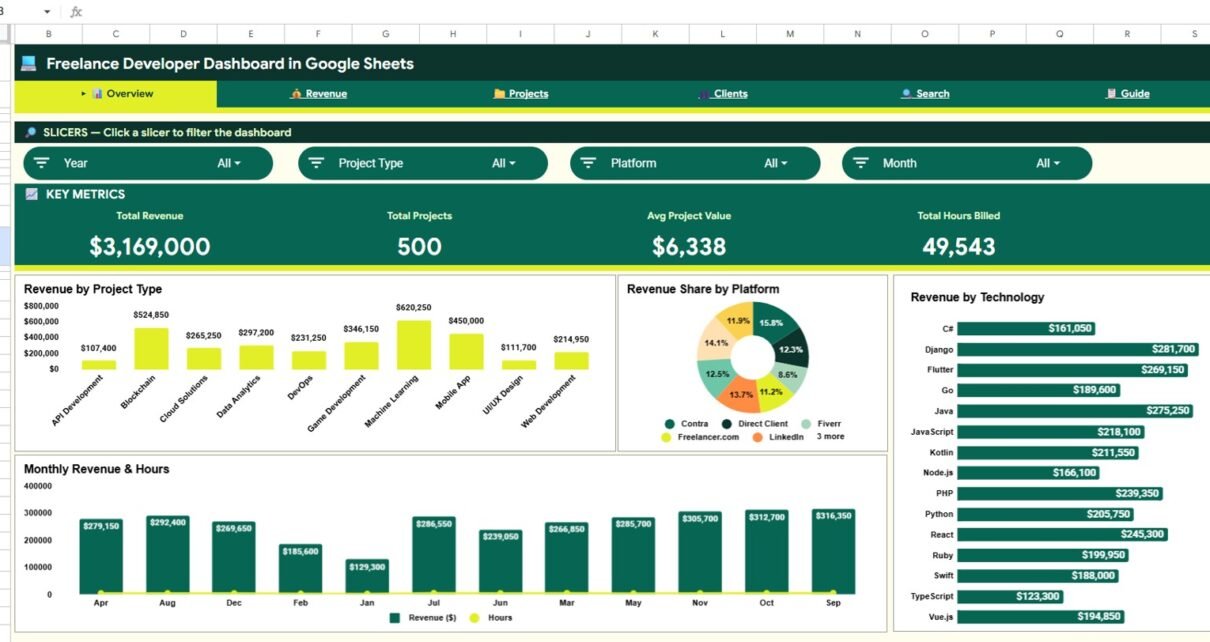
- 4 KPI headline cards on the Overview page — Total Revenue, Total Projects, Avg Project Value, and Total Hours Billed update automatically every time you refresh the pivot tables after adding new data.
- 16 pre-built charts across 4 analysis pages — The dashboard covers Revenue, Projects, Clients, and Technology dimensions, giving you a 360° view of your freelance business without writing a single formula.
- Slicer-driven filtering — Interactive slicers on the Overview page let you filter every chart and KPI card simultaneously by project type, payment status, platform, or technology with a single click.
- Revenue by Technology analysis — A dedicated chart shows which programming languages and tech stacks (React, Python, Node.js, Flutter, etc.) generate the most revenue per project and per hour, helping you focus your skills strategically.
- Platform revenue intelligence — Revenue Share by Platform reveals which marketplaces (Upwork, Fiverr, Toptal, direct) contribute most to your income, so you know where to invest your prospecting time.
- Project Search sheet — Select any Project ID from a dropdown to instantly view all 11 project fields: date, client name, project type, technology, platform, revenue, hours billed, hourly rate, payment status, project status, and client rating.
- Pivot-table backend — All charts and KPIs are driven by Google Sheets native pivot tables. Add rows to the Data sheet, refresh, and every metric across all 6 pages updates automatically.
- One-time purchase — $9.99 with lifetime access. No subscription, no per-user fees, no data sent to a third-party server.
Dashboard Pages Explanation
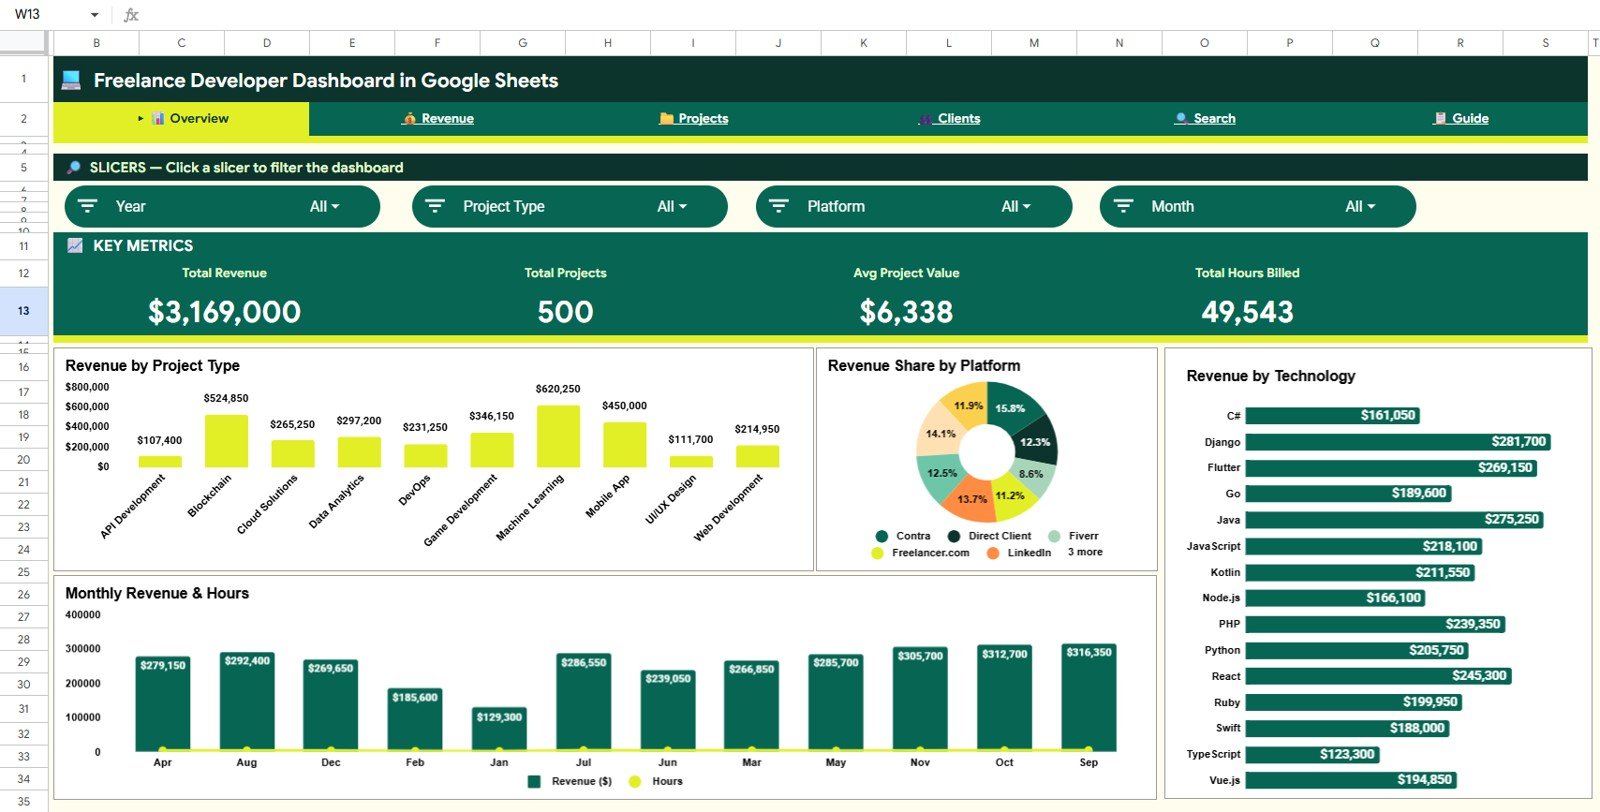
1 — Overview Page
The Overview page gives you the highest-level snapshot of your freelance business. Four KPI cards at the top display Total Revenue, Total Projects, Avg Project Value, and Total Hours Billed at a glance. Below the cards, four charts present the data broken down by dimension:
- Revenue by Project Type — Compares total revenue generated by each category of work (web development, mobile app, API integration, consulting, etc.) so you know which service type earns the most.
- Revenue Share by Platform — A breakdown of income contribution across each platform you use, making it easy to identify where your highest-value clients originate.
- Revenue by Technology — Shows which programming languages and frameworks (React, Python, Node.js, Flutter, etc.) are most profitable, helping you focus on the technologies that command premium rates.
- Monthly Revenue and Hours — A combined trend chart showing how your total revenue and hours billed change month over month, revealing seasonal patterns and growth trajectories.
Interactive slicers sit alongside the charts so you can apply filters instantly and see how any subset of your data compares to the whole.
Freelance Developer Dashboard in Google Sheets
2 — Revenue Page
The Revenue page digs deeper into the money. Four charts break revenue down across time, payment patterns, and project profitability:
- Monthly Revenue Trend — Tracks how your total monthly income changes over time, making it straightforward to spot growth months, slow seasons, and billing cycle gaps.
- Revenue by Payment Status — Compares paid, pending, and overdue revenue so you can quantify your outstanding receivables at a glance and prioritize follow-ups.
- Avg Hourly Rate by Project Type — Shows which service categories command the highest effective hourly rate, helping you make data-driven decisions about which project types to pursue next.
- Revenue by Project Type and Payment Status — A combined view that shows not just what each project type earns, but also what portion of that revenue has actually been collected versus what remains outstanding.
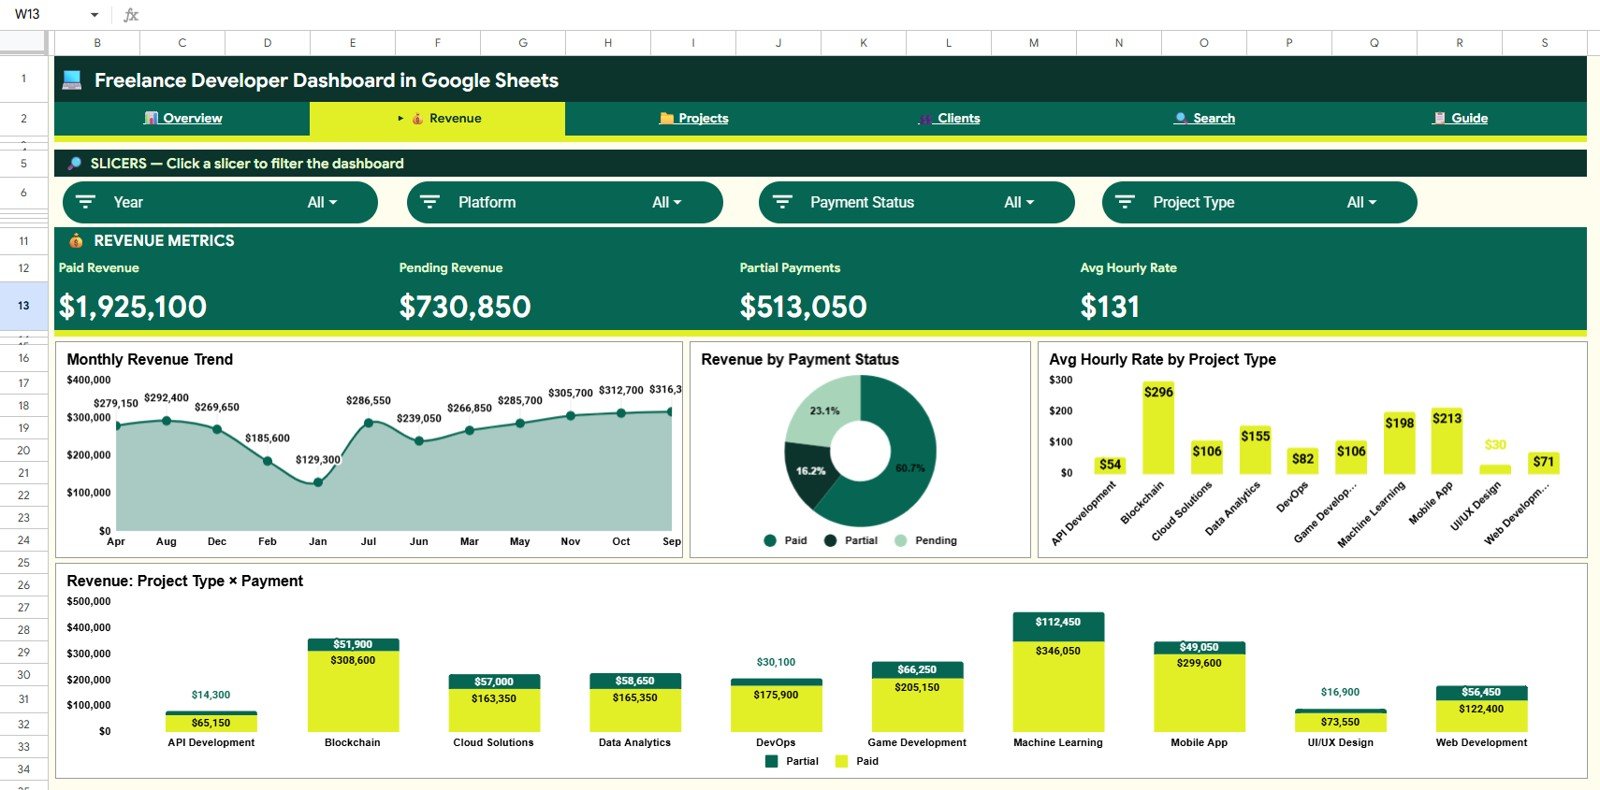
Revenue Page
3 — Projects Page
The Projects page gives you operational visibility into your active and completed work pipeline:
- Revenue by Project Type — Reinforces the overview metric with a projects-lens view, tying revenue directly to the work category context.
- Project Status Distribution — Shows how many projects are in progress, completed, on hold, or stalled, so you can identify bottlenecks in your delivery pipeline before they affect cash flow.
- Project Count by Technology — Reveals how many projects you have delivered in each technology stack, giving you a sense of your experience distribution and market depth.
- Monthly Project Count — Tracks how many new projects you started or completed each month, which when paired with the Revenue Trend chart reveals your effective revenue per project over time.
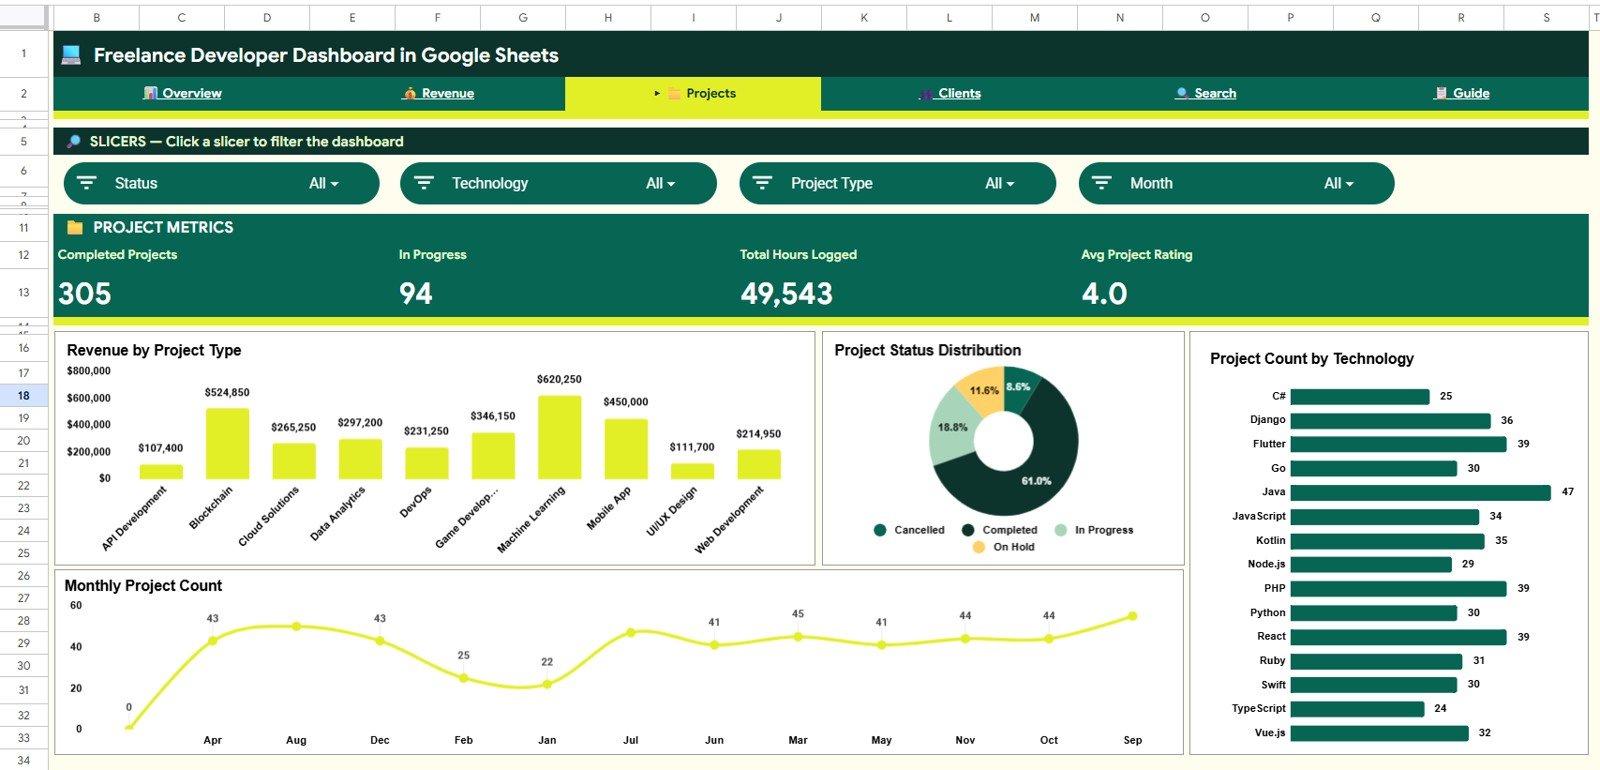
Projects Page
4 — Clients Page
The Clients page helps you understand the client relationships that drive your business:
- Revenue by Platform — Confirms which acquisition channels (Upwork, Fiverr, direct referral, Toptal) generate the most client revenue, so you can allocate your marketing effort accordingly.
- Revenue by Client — Ranks your clients by total revenue generated, making it easy to identify your top accounts and flag underperforming relationships worth nurturing or deprioritizing.
- Monthly Revenue Trend — A client-level view of how your revenue has evolved month over month, useful for spotting a client whose billing volume is growing or declining.
- Avg Rating by Project Type — Tracks your average client satisfaction rating per project type, revealing which service categories consistently earn the best feedback and which might need process improvement.
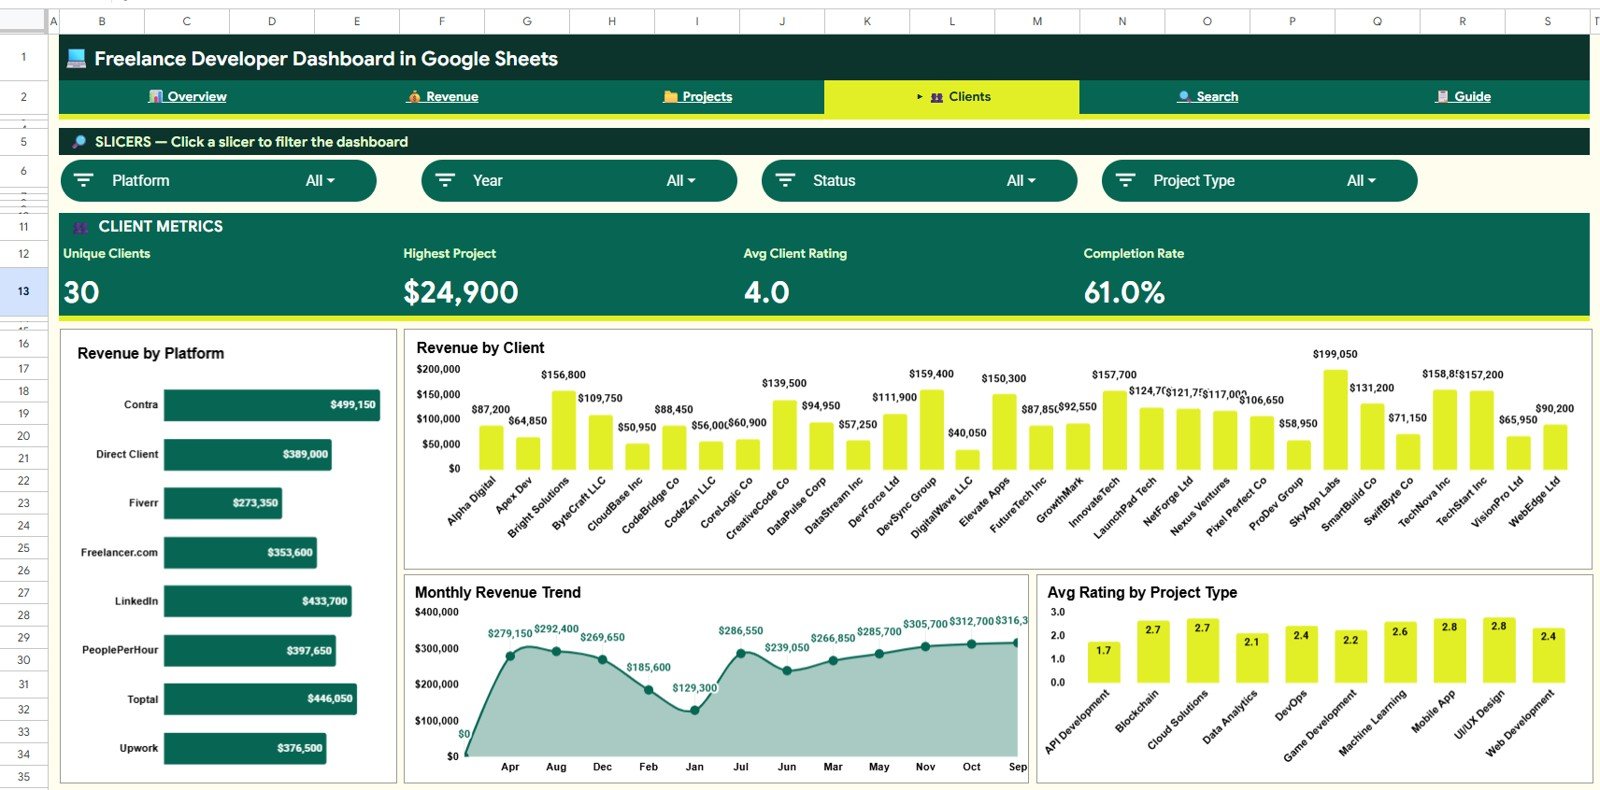
Clients Page
5 — Search Sheet
The Search Sheet provides a fast project-level lookup tool. Select any Project ID from the dropdown menu and the sheet instantly displays all 11 data fields for that project: date, client name, project type, technology used, platform, total revenue, hours billed, effective hourly rate, payment status, project status, and client rating. This is particularly useful for quickly verifying a specific project’s details when following up on invoices or preparing portfolio summaries for prospective clients.
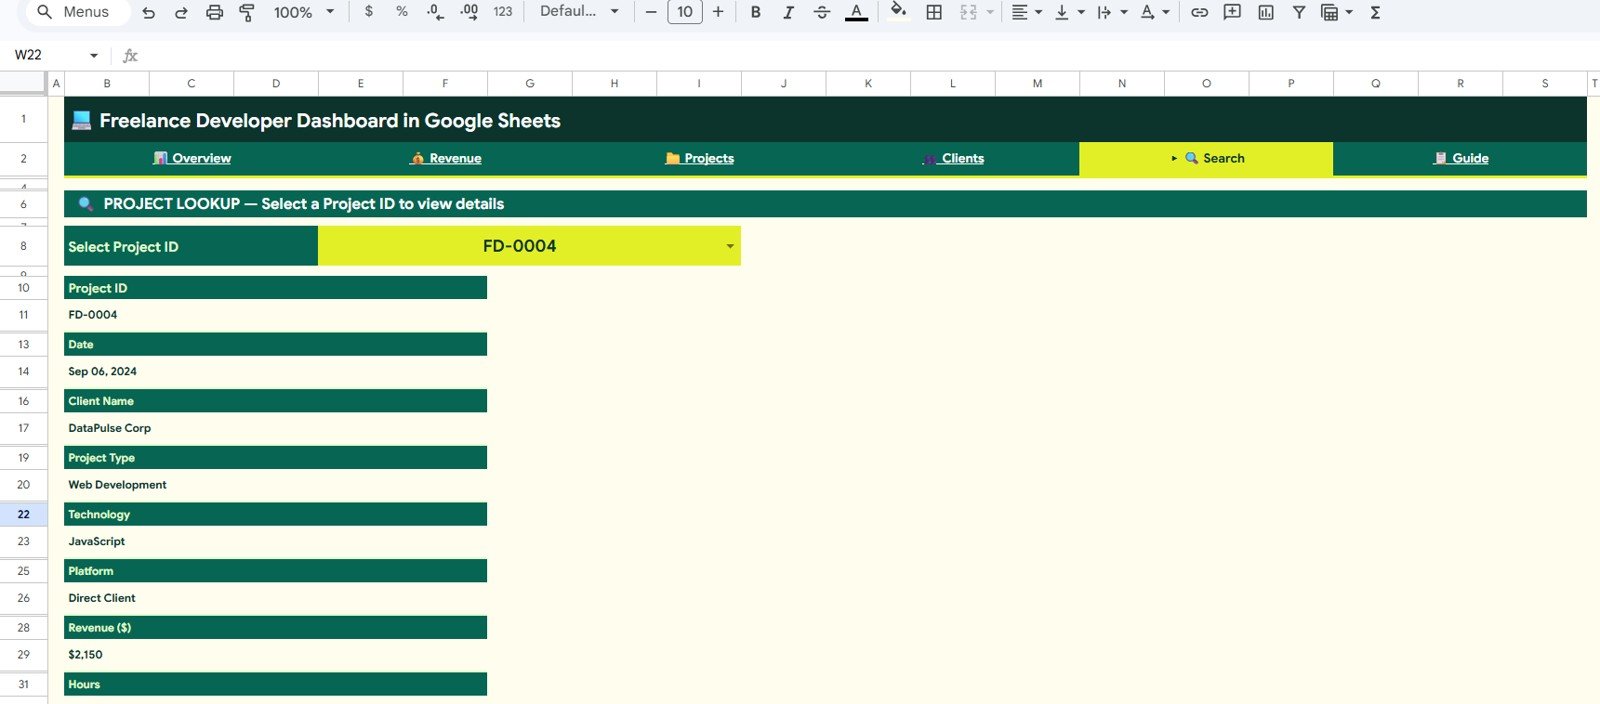
Search Sheet tab
6 — Data Sheet
The Data Sheet is where you add your project records. The sheet is formatted with predefined column headers — simply add each project as a new row in the same format as the sample data included. Once you have added your records, go to Data > Refresh All in Google Sheets and every chart, KPI card, and search lookup across all pages will update automatically. The Google Sheets pivot table documentation covers how to refresh manually if needed.
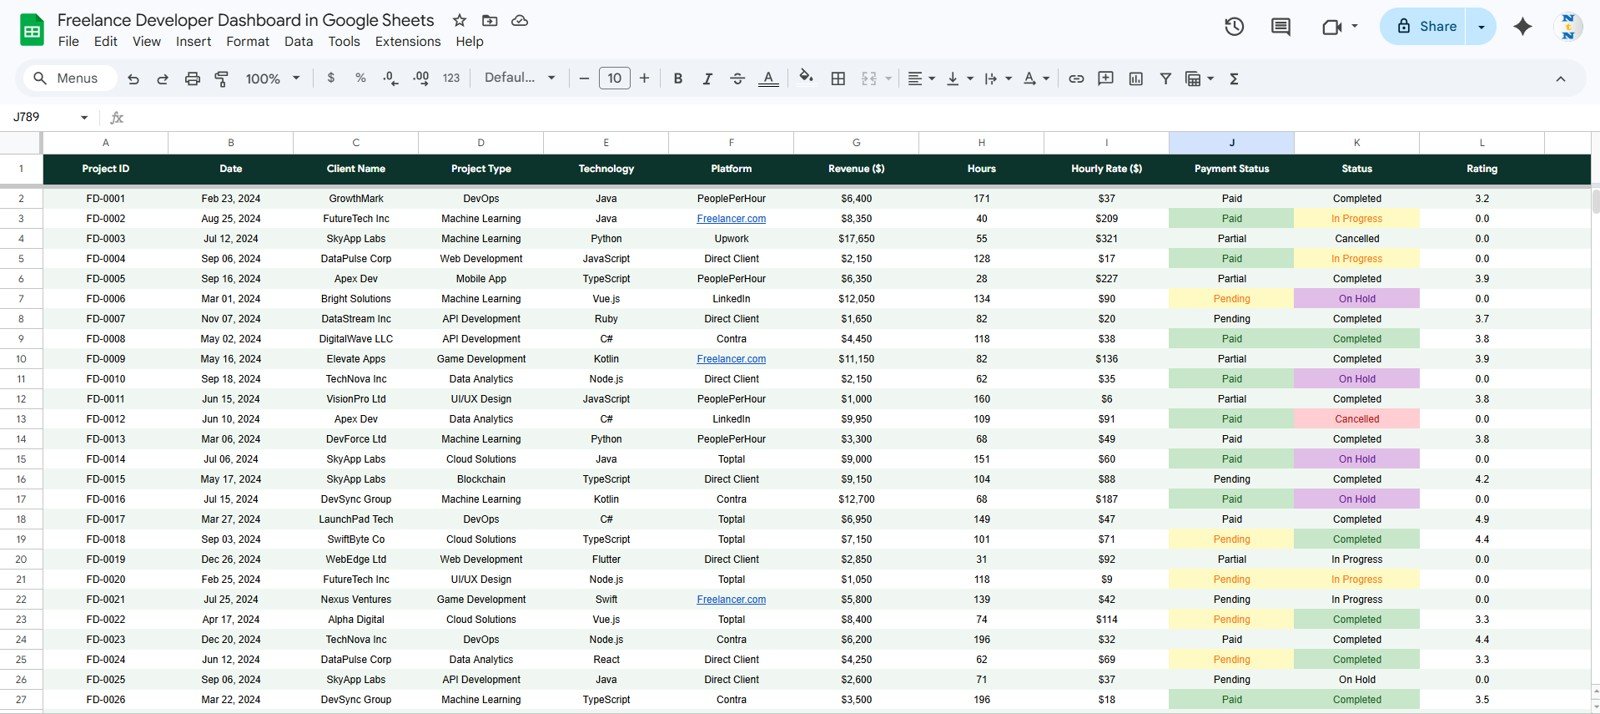
Data Sheet tab
Freelance Developer Dashboard in Google Sheets vs. Microsoft Excel Dashboard vs. Paid SaaS — Feature Comparison
| Feature | Freelance Developer Dashboard in Google Sheets | Microsoft Excel Dashboard | Paid SaaS (Harvest / FreshBooks) |
|---|---|---|---|
| Cost | $9.99 one-time | $17.99 one-time | $12–55 / user / month |
| Platform | ✅ Google Sheets (browser-based) | Requires MS Excel license | Web app, proprietary |
| Setup time | ✅ Under 10 minutes | Under 15 minutes | 1–3 hours (onboarding) |
| Internet required | Yes (Google Drive) | No | Yes |
| Real-time collaboration | ✅ Built-in (Google Drive) | Limited (OneDrive) | ✅ Built-in |
| Revenue by Technology tracking | ✅ Yes (built-in chart) | ✅ Yes (Excel version) | ❌ Not available |
| Customizable fields | ✅ Fully editable | ✅ Fully editable | Limited (plan-dependent) |
| Year-1 cost (1 user) | $9.99 total | $17.99 total | $144–660 |
| Data ownership | ✅ Stays in your Google Drive | ✅ Local file | Stored on vendor servers |
For freelance developers who want full revenue and project visibility without a monthly subscription, the Freelance Developer Dashboard in Google Sheets sits in the sweet spot.
Who Should Use This Template
Perfect for:
- Freelance developers billing across multiple platforms (Upwork, Fiverr, Toptal, direct clients)
- Solo tech consultants who want to track revenue by technology stack and project type
- Google Sheets users who need a no-code business dashboard they can set up in under 10 minutes
- Developers moving from Excel who want browser-based access and real-time sharing with accountants or business partners
- Freelancers who want to make data-driven decisions about which services to price higher
Not a fit if:
- You need automated time-tracking integrations with GitHub, Jira, or other project management tools
- Your agency has 10+ team members who all need to log their own data simultaneously
- You require offline-only access without an internet connection
Real-World Use Cases
Ravi is a full-stack developer billing clients across Upwork and Toptal. He uses the Freelance Developer Dashboard in Google Sheets to track which technologies (React, Node.js, Python) generate the most hourly revenue, which platform brings in the highest-value projects, and whether his payment collection rate is improving month over month — all without paying $35/month for a project management SaaS tool. After three months of using the Revenue by Technology chart, he identified that his React projects consistently commanded 40% higher rates than his WordPress work and shifted his service mix accordingly.
Priya runs a one-person iOS and Android development consultancy. She uses the Clients page to rank clients by total revenue, monitor her Avg Rating by Project Type, and use the Monthly Revenue Trend chart to forecast slow months and proactively pitch new clients before her pipeline empties. She shares view-only access to the dashboard with her accountant at tax time, eliminating two hours of manual reporting per quarter.
Marcus is transitioning from agency work to full-time freelancing. He uses the Projects page to analyze Project Status Distribution — how many projects are in progress vs. completed vs. stalled — and the Avg Hourly Rate by Project Type chart to identify which services he should price higher in his next proposal. Within six months, the data helped him eliminate low-margin project types and increase his effective hourly rate by 28%.
Advantages of Freelance Developer Dashboard in Google Sheets
- Zero recurring cost — One-time $9.99 vs. $144–660/year for SaaS alternatives. For a solo developer, that difference compounds significantly over time.
- Technology-level revenue visibility — Most freelance tracking tools show revenue by client or project, but not by programming language or technology. This dashboard makes that analysis native.
- Google Drive sharing — Share view-only or edit access with accountants, business partners, or mentors without creating additional user accounts or paying seat fees.
- Works in the browser — No software to install. Accessible from any device with a Google account, including tablets and phones.
- Slicer interactivity — Unlike static spreadsheets, the slicer-driven filtering lets you answer ad hoc questions (“How much did I earn from React projects on Upwork in Q3?”) in under five seconds.
Opportunities for Improvement
- The dashboard requires manual data entry — it does not connect to Upwork, Fiverr, or other platforms via API. Developers who want automated import would need to build a custom Google Apps Script integration or use a tool like Zapier.
- The pivot table refresh is a manual step (Data > Refresh All). Google Sheets does not refresh pivots automatically when new rows are added, so users need to remember to trigger it.
- The Search Sheet uses a dropdown-based lookup rather than a dynamic search bar. Users with very large project histories (500+ records) may find this slightly slower than a text-search interface.
Best Practices
- Add project records to the Data Sheet immediately after completing or invoicing a project, while the details are fresh.
- Standardize your Technology field values (e.g., always use “React” not “React.js” or “ReactJS”) so the Revenue by Technology chart groups them correctly.
- Refresh the pivot tables at the start of each week for an up-to-date Overview dashboard before client calls or rate negotiation conversations.
- Use the Payment Status field consistently (Paid / Pending / Overdue) to get accurate receivables visibility from the Revenue by Payment Status chart.
- Share view-only access with your accountant at the end of each quarter to streamline tax reporting.
Explore Relevant Templates
🔹 Freelance Developer Dashboard in Excel — The same dashboard built for Microsoft Excel with offline access and a hidden Support Sheet for the pivot engine.
🔹 Freelance Developer Dashboard in Power BI — Advanced interactive version with Power BI visualizations for developers who want richer drilldown capabilities.
🔹 Influencer Campaign Dashboard in Google Sheets — For creators and marketers managing campaign revenue across multiple platforms in Google Sheets.
🔹 Construction Project Cost Dashboard in Google Sheets — Another project-based Google Sheets dashboard, ideal for freelance project managers in construction.
🔹 Browse all Google Sheets Dashboard templates on NextGenTemplates.
Frequently Asked Questions
What KPIs does the Freelance Developer Dashboard in Google Sheets track?
The Freelance Developer Dashboard in Google Sheets tracks 4 headline KPIs: Total Revenue, Total Projects, Avg Project Value, and Total Hours Billed. All four metrics update automatically when you add project records to the Data Sheet and refresh the pivot tables. The dashboard also displays 16 secondary metrics across Revenue, Projects, Clients, and Technology analysis pages.
How does this compare to Harvest or FreshBooks for freelance tracking?
Harvest starts at $12/month ($144/year) and FreshBooks at $19/month — both charge recurring fees indefinitely and neither provides a Revenue by Technology breakdown that shows which programming languages earn the most. The Freelance Developer Dashboard in Google Sheets is a $9.99 one-time purchase with lifetime access, full data ownership, and customization freedom that SaaS tools do not offer.
Can I track revenue by programming language or technology stack?
Yes. The Overview page includes a Revenue by Technology chart and the Projects page shows Project Count by Technology. Simply add your technology (React, Python, Node.js, Flutter, Swift, etc.) to each project record in the Data Sheet and the charts update automatically after pivot refresh. There is no limit to the number of technologies you can track.
How long does setup take?
Setup takes under 10 minutes. Download the PDF guide from your purchase confirmation, click the Google Sheets copy link to create your own editable copy in Google Drive, paste your existing project records into the Data Sheet following the sample data format, and refresh the pivot tables. All 6 pages — Overview, Revenue, Projects, Clients, Search Sheet, and Data Sheet — will be ready to use immediately.
Do I need Google Sheets experience to use this dashboard?
No advanced Google Sheets knowledge is required. The Freelance Developer Dashboard is designed for non-technical users — just paste your project data into the Data Sheet in the provided column format, click Data > Refresh All, and all 16 charts and 4 KPI cards rebuild automatically. No formula writing or chart editing is needed.
Can I share this dashboard with my accountant or business partner?
Yes. Since the Freelance Developer Dashboard in Google Sheets lives in your Google Drive, you can share view-only or edit access with anyone using standard Google Drive sharing. No additional licenses or seat fees are required — Google Drive sharing is free regardless of how many people you invite to view the file.
Is there an Excel or Power BI version available?
Yes. The Freelance Developer Dashboard is available in three formats on NextGenTemplates: Google Sheets (this template), Microsoft Excel, and Power BI. All three versions track the same KPIs and use the same data structure so you can switch formats without rebuilding your data history.
About the Author
Built by PK — Microsoft Certified Professional with 15+ years of Excel, Google Sheets, and Power BI experience. Founder of NextGenTemplates, reaching 300K+ subscribers across YouTube channels (@PK-AnExcelExpert, @NextGenTemplates, @NeoTechNavigators). Every template is hand-built and tested before release.
Conclusion
Freelance developers who track their revenue by technology, platform, and project type make faster, more profitable decisions than those who rely on memory or ad hoc spreadsheets. The Freelance Developer Dashboard in Google Sheets gives you the structure to do that in under 10 minutes — with 6 interactive pages, 16 pre-built charts, and slicer-driven filtering that works without any formula knowledge.
👉 Click here to Purchase the Freelance Developer Dashboard in Google Sheets
✅ Instant download · One-time payment · No subscription · Lifetime access
🎥 Watch tutorials on YouTube.com/@NeoTechNavigators
📅 Last updated: May 2026