Campaign teams running for local, regional or statewide office rely on data to place volunteers, track fundraising and measure outreach. Most small and mid-sized campaigns, though, do not have an affordable, ready-to-use reporting tool. The Political Campaign Dashboard in Google Sheets fills that gap as a one-time purchase, with no monthly subscription, no coding and no specialist needed to set it up.
The dashboard covers campaign analytics across an Overview page and three analysis pages (Donations, Volunteers and Outreach), plus a Search sheet and a Data sheet. Each dashboard page has four KPI cards, four charts and four slicers that filter every visual on that page. Campaign teams can paste their data and be up and running in under 10 minutes.
🎥 Watch the Video Tutorial
Get the Political Campaign Dashboard
Key Features of the Political Campaign Dashboard in Google Sheets
The dashboard gives campaign teams immediate visibility into their three core areas: fundraising, volunteers and field outreach. It is built entirely in native Google Sheets, with no add-ons, macros or external APIs.
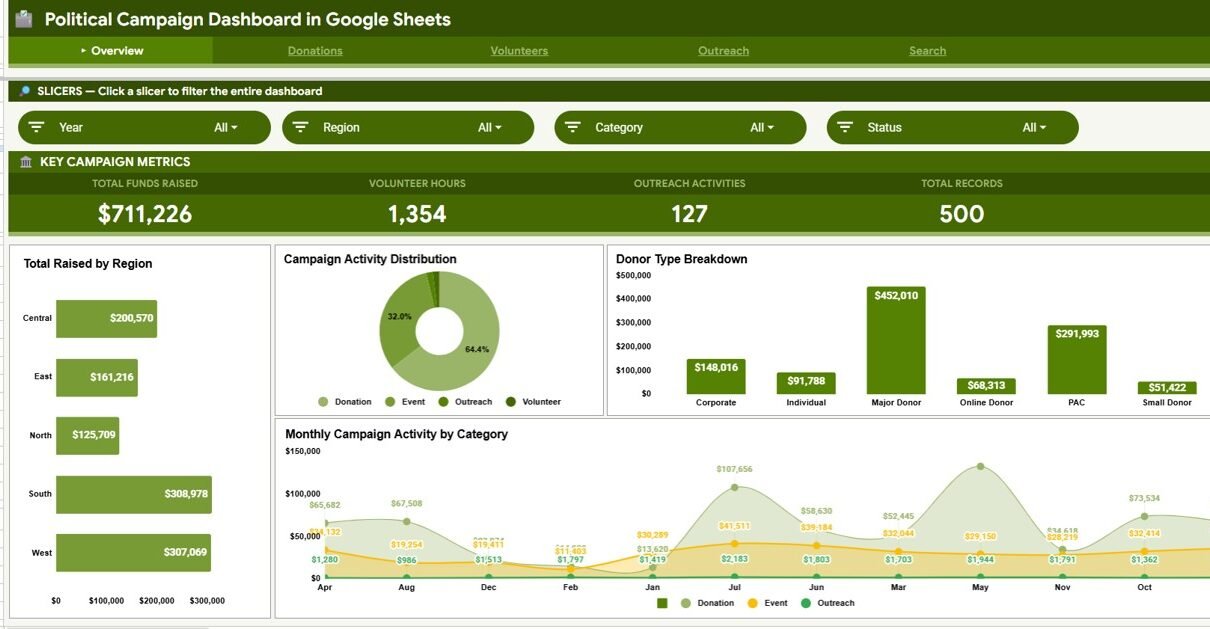
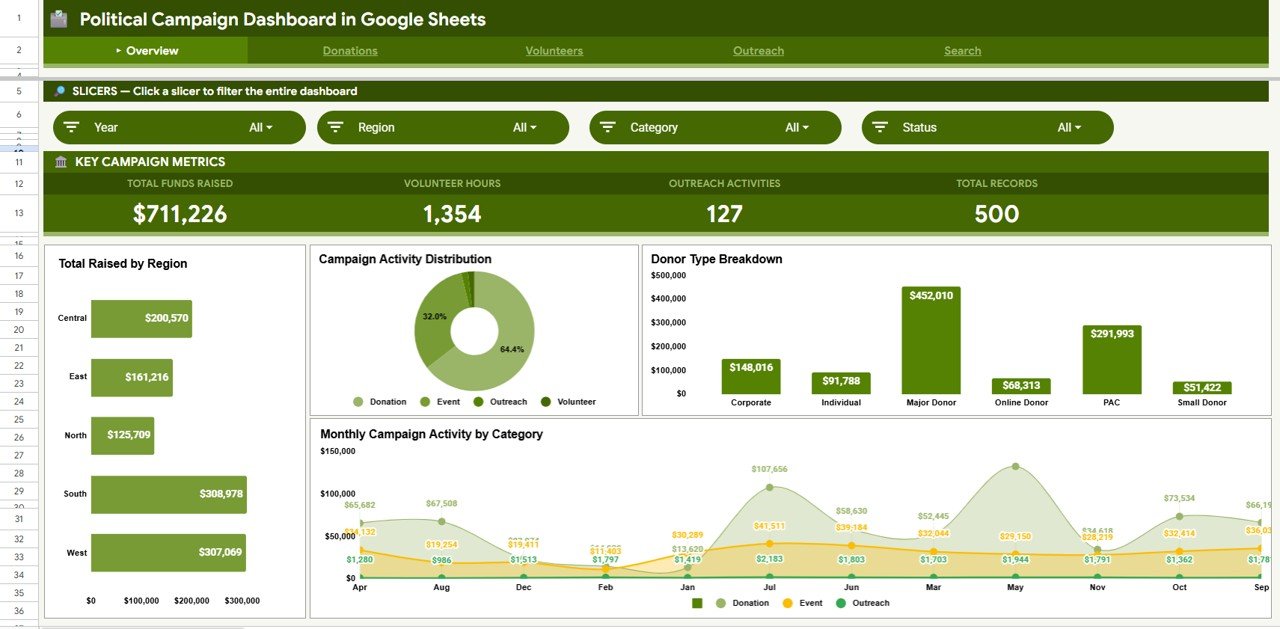
- 4 KPI cards on the Overview page: Total Funds Raised, Volunteer Hours, Outreach Activities and Total Records, all updating when data changes
- 16 pre-built charts: four on the Overview and four on each of the Donations, Volunteers and Outreach pages
- Interactive slicers on every dashboard page: filter by Year, Region, Category, Status, Donor Type, Channel, Activity Type, Staff Lead or District, depending on the page
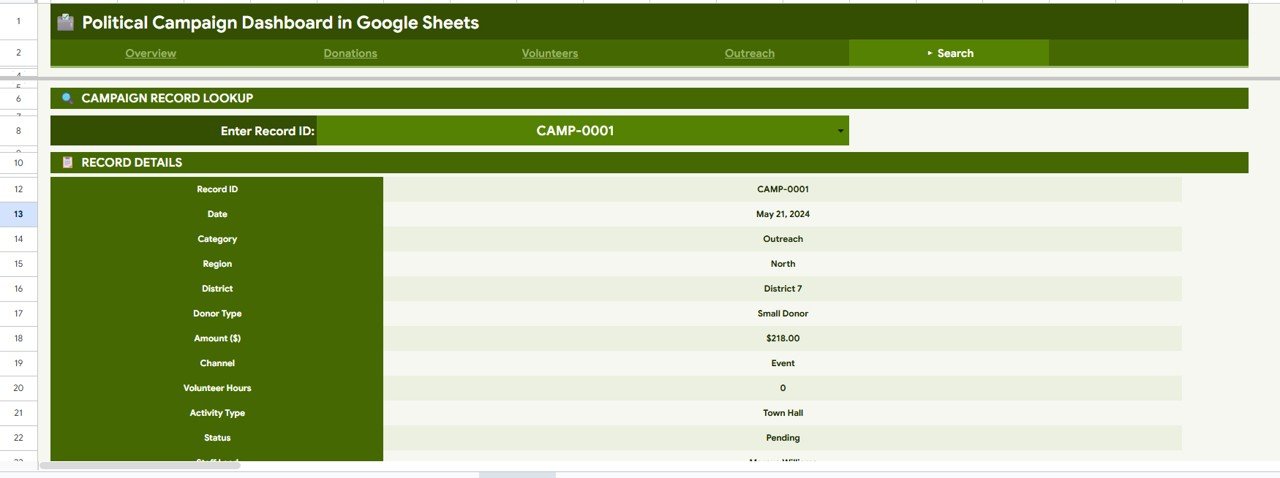
- Record ID Search sheet: pick any Record ID to see its date, category, region, district, donor type, amount, channel, volunteer hours, activity type, status and staff lead
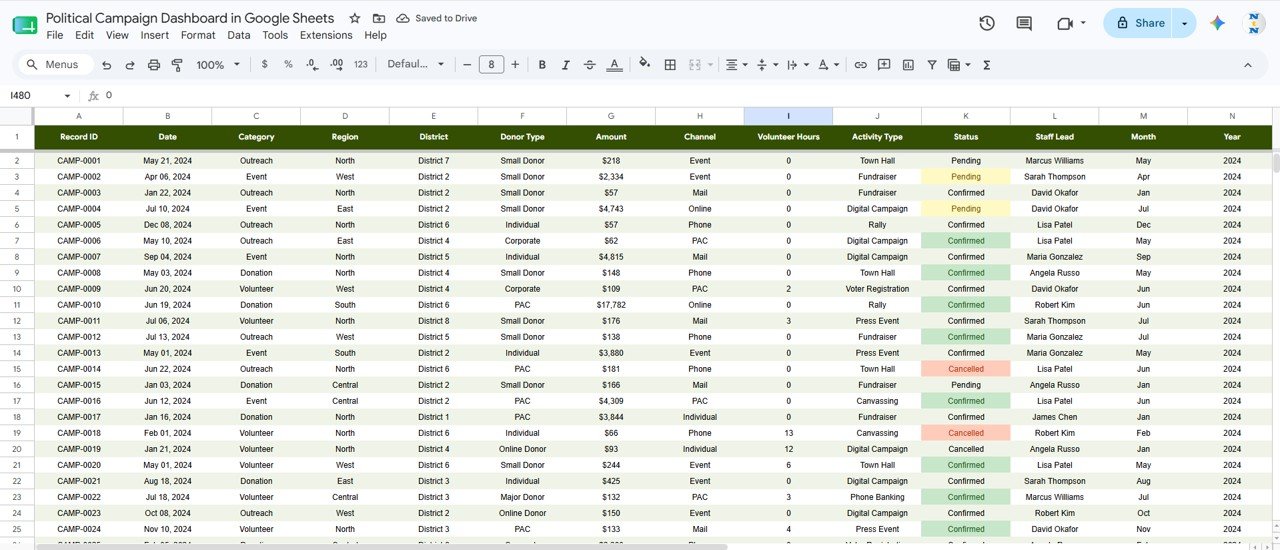
- Structured Data sheet: add records in the same column format and all charts update without formula edits
- Shareable via Google Drive: share with the whole campaign team for real-time collaboration, with no per-user fees
KPI Cards and Slicers by Page
| Page | KPI cards | Slicers |
|---|---|---|
| Overview | Total Funds Raised, Volunteer Hours, Outreach Activities, Total Records | Year, Region, Category, Status |
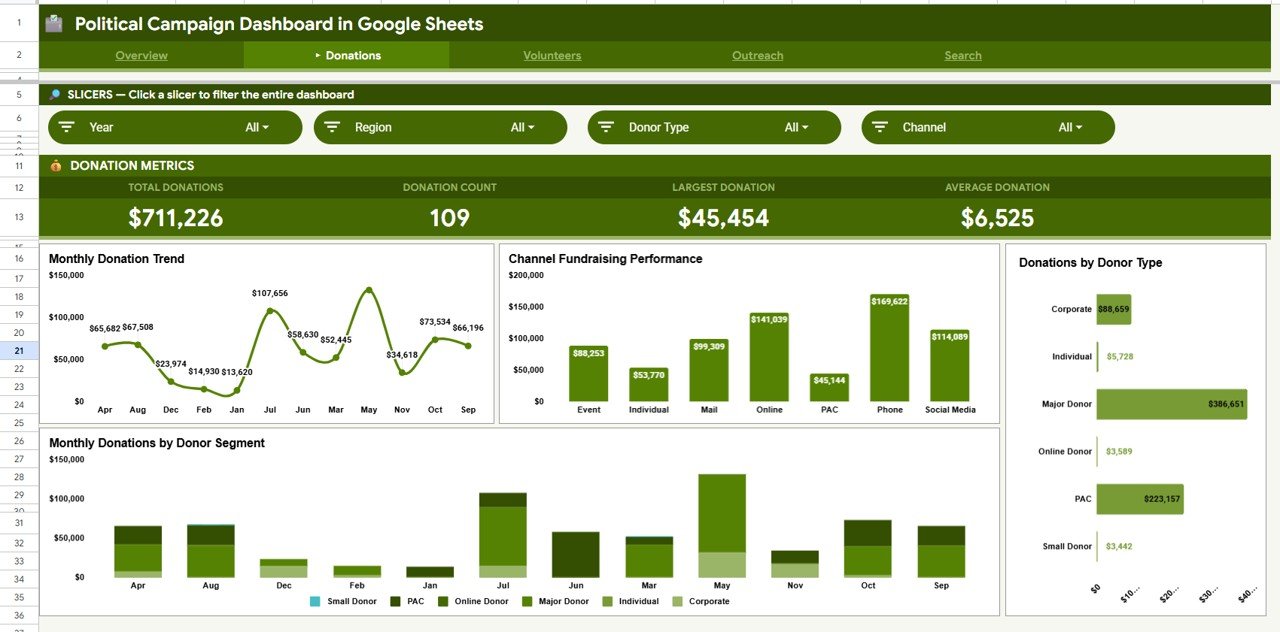
| Donations | Total Donations, Donation Count, Largest Donation, Average Donation | Year, Region, Donor Type, Channel |
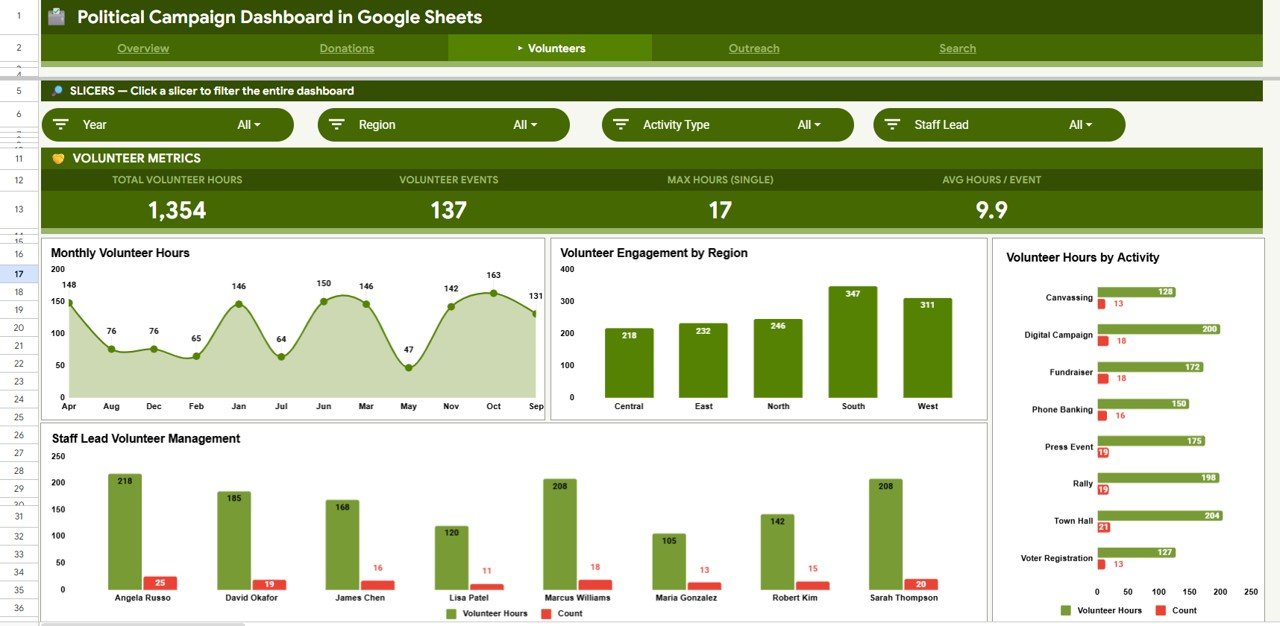
| Volunteers | Total Volunteer Hours, Volunteer Events, Max Hours (Single), Avg Hours / Event | Year, Region, Activity Type, Staff Lead |
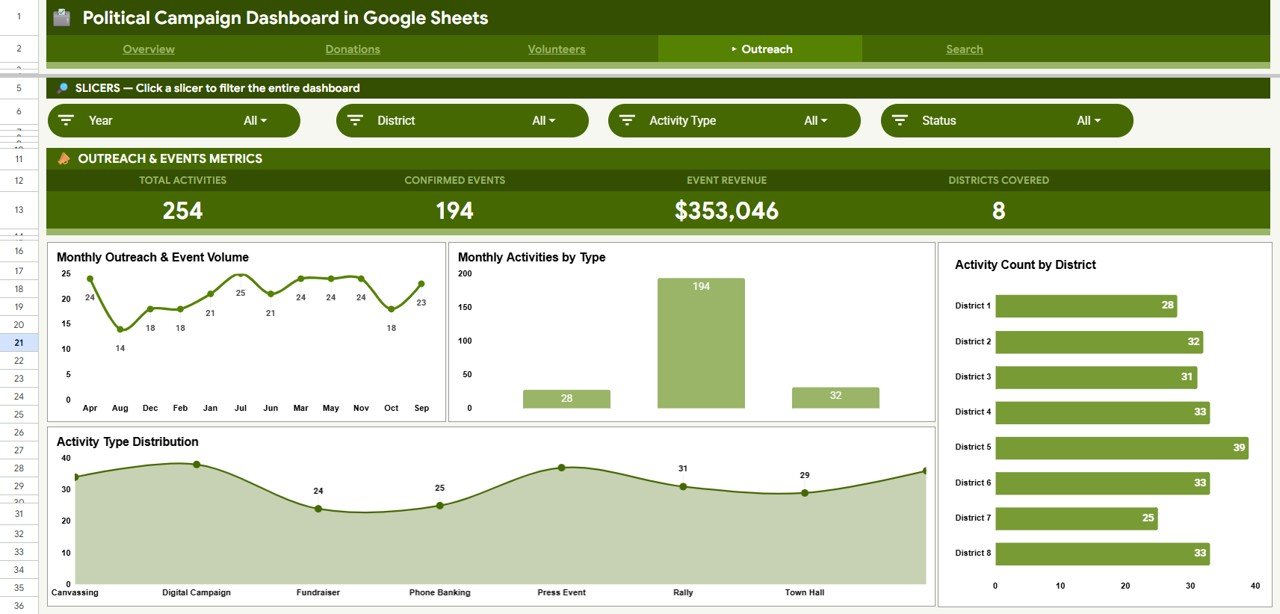
| Outreach | Total Activities, Confirmed Events, Event Revenue, Districts Covered | Year, District, Activity Type, Status |
In the sample data, Average Donation is Total Donations divided by Donation Count: $711,226 ÷ 109 = $6,525. Avg Hours / Event works the same way: 1,354 hours ÷ 137 events = 9.9.
Dashboard Pages Explained
Page 1: Overview
The Overview page shows the four high-level KPI cards with four summary charts: Total Raised by Region, Campaign Activity Distribution, Donor Type Breakdown and Monthly Campaign Activity by Category. The slicers at the top filter every visual on the page.
Page 2: Donations
The Donations page gives in-depth fundraising analytics with four charts: Monthly Donation Trend, Channel Fundraising Performance, Donations by Donor Type and Monthly Donations by Donor Segment. Channels in the sample data include Event, Individual, Mail, Online, PAC, Phone and Social Media, and donor types include Corporate, Individual, Major Donor, Online Donor, PAC and Small Donor.
Page 3: Volunteers
The Volunteers page tracks field engagement with four charts: Monthly Volunteer Hours, Volunteer Engagement by Region, Volunteer Hours by Activity and Staff Lead Volunteer Management. It shows which regions, activities (such as Canvassing, Phone Banking or Voter Registration) and staff leads generate the most volunteer capacity.
Page 4: Outreach
The Outreach page monitors field activity with four charts: Monthly Outreach & Event Volume, Monthly Activities by Type, Activity Count by District and Activity Type Distribution. It shows which districts and activity types drive the most engagement across the campaign territory.
Search Sheet
The Search sheet is an instant record lookup. Choose a Record ID from the dropdown and it returns the date, category, region, district, donor type, amount, channel, volunteer hours, activity type, status and staff lead. No filtering or scrolling through the Data sheet is needed.
Data Sheet
The Data sheet is where you add your campaign records. Its columns are Record ID, Date, Category, Region, District, Donor Type, Amount, Channel, Volunteer Hours, Activity Type, Status (Confirmed, Pending or Cancelled), Staff Lead, Month and Year. Enter data in the same structure and the charts, KPI cards and slicers update.
Political Campaign Dashboard in Google Sheets vs. Excel vs. Campaign CRM Software
| Feature | Political Campaign Dashboard in Google Sheets | Microsoft Excel Dashboard | Campaign CRM (e.g. NationBuilder, NGP VAN) |
|---|---|---|---|
| Cost | One-time purchase | One-time purchase | Monthly subscription |
| Platform | Browser, any device | Windows/Mac desktop | Web software |
| Setup time | Under 10 minutes | Under 10 minutes | Onboarding and data migration |
| Real-time collaboration | Google Drive sharing | Limited (OneDrive) | Yes |
| Mobile access | Google Sheets mobile app | Limited | Yes |
| Customizable fields | Fully editable | Fully editable | Limited without developer help |
| Voter file, email and SMS tools | No | No | Yes |
For local and regional teams that need donation, volunteer and outreach reporting without monthly software fees, the Political Campaign Dashboard in Google Sheets is a practical choice.
Who Should Use This Template
Good fit for:
- Campaign managers and political directors at local or regional level tracking donations, volunteers and outreach
- Nonprofit and advocacy organizations running fundraising and field programs on limited budgets
- Campaign finance directors who share donation summaries with a board or committee
- Google Sheets users who want a ready-made analytics framework instead of building from scratch
Not a fit if:
- You run a large campaign that needs voter-file integration with platforms like NGP VAN or Salesforce
- You need email, SMS or call workflows built into the tool
Real-World Use Cases
Maria manages a state senate campaign. She tracks weekly donation totals by region, monitors volunteer hours by staff lead and presents outreach activity counts to the campaign director. The shared Google Drive link means the whole field team sees the same live data without version conflicts.
David runs a nonprofit voter-registration drive. He enters each outreach event in the Data sheet and uses the Outreach page to see which districts are behind on activity count. He then moves volunteers to those districts based on the Activity Count by District chart before the registration deadline.
A local PAC treasurer uses the Donations page to compare channels month by month and see whether online, mail or event contributions are rising. She shares the live sheet with the PAC board for quarterly review without exporting or emailing files.
Advantages of the Political Campaign Dashboard in Google Sheets
- No recurring cost: one purchase instead of a monthly software fee
- Instant collaboration: share via a Google Drive link and the whole team sees live data
- Short learning curve: anyone familiar with spreadsheets can update data and read the charts
- All three campaign pillars in one file: donations, volunteers and outreach, so you need fewer separate spreadsheets
Limitations to Know
- No automated data import: data is entered manually. Connecting to donation platforms would need custom scripting.
- No voter file integration: the template tracks campaign activities, not voter contact history or GOTV status.
- Single-file design: very large datasets may render charts more slowly in Google Sheets than in a dedicated BI tool.
Best Practices
- Keep the Data sheet column headers intact. Renaming headers can break the references the dashboard pages use.
- Use the slicers one at a time at first to see how each filter affects the charts.
- Make a backup copy in Google Drive before large data entry sessions.
- Give board members Viewer access and only the data entry team Editor access.
- Keep Record IDs unique so the Search sheet always returns the right record.
Related Templates and Guides
The same dashboard is available as the Political Campaign Dashboard in Excel and the Political Campaign Dashboard in Power BI.
On NeoTech Navigators, campaigns and advocacy groups may also find these useful: the Fundraising Campaign KPI Dashboard, the Nonprofit Fundraising Dashboard in Google Sheets, the Volunteer Program KPI Dashboard and the Donation Management Tracker.
If you want to learn how dashboards like this are built with pivots, slicers and charts, the Excel Pivot Tables and Dashboards course on NextGenTemplates Academy covers it step by step.
Frequently Asked Questions
What KPIs does the Political Campaign Dashboard in Google Sheets track?
The Overview page tracks Total Funds Raised, Volunteer Hours, Outreach Activities and Total Records. The Donations, Volunteers and Outreach pages add their own cards, such as Average Donation, Avg Hours / Event and Districts Covered.
Do I need any Google Sheets add-ons?
No. The dashboard uses only native Google Sheets features. It works in any browser with a standard Google account, including the Google Sheets mobile app.
How long does setup take?
Under 10 minutes. Open the included PDF, use the copy link to create your own editable copy in Google Drive, then paste your campaign data into the Data sheet.
How does this compare to NationBuilder or NGP VAN?
Those are full campaign CRM platforms with monthly fees, voter files, email tools and event management. This dashboard is a one-time purchase focused on donation, volunteer and outreach reporting, which suits local and regional campaigns that do not need a full CRM.
Can I filter the dashboard by region or donor type?
Yes. Every dashboard page has four slicers. You can filter by Region and Donor Type on the Donations page, by Activity Type and Staff Lead on the Volunteers page, and by District and Status on the Outreach page.
Can multiple team members use it at the same time?
Yes. Share the Google Sheets link and several people can view and edit at once, with no per-seat fees.
About the Author
Built by PK, a Microsoft Certified Professional with 15+ years of Excel, Google Sheets and Power BI experience. He founded NextGenTemplates, and its YouTube channels reach 300K+ subscribers. Every template is built by hand and tested before release.
Wrapping Up
The Political Campaign Dashboard in Google Sheets gives campaign managers, nonprofit directors and field organizers one shareable view of donations, volunteers and outreach. Paste your records into the Data sheet, filter by region or district, and take the Overview page into your next campaign meeting.
Get the Political Campaign Dashboard in Google Sheets
📅 Last updated: October 2026