The global cannabis retail market surpassed $33 billion in 2024 and is projected to exceed $60 billion by 2028, yet most independent dispensaries still track revenue in basic spreadsheets or rely on expensive POS analytics add-ons costing $200–$500 per month. Google Sheets now handles 100+ million active business users worldwide, making it one of the most accessible platforms for operational reporting. The Cannabis Dispensary Dashboard in Google Sheets bridges that gap — giving dispensary owners and managers a professional, multi-page analytics solution for a one-time cost of $9.99.Cannabis Dispensary Dashboard in Google Sheets
From budtender performance and strain-level revenue to customer segmentation and instant sale lookup, this dashboard consolidates the data dispensary operators need most — without vendor lock-in, per-user fees, or recurring subscriptions. If you manage a dispensary and export your POS data to CSV, this template transforms that raw data into actionable insights in under 10 minutes.Cannabis Dispensary Dashboard in Google Sheets
Key Features of the Cannabis Dispensary Dashboard in Google Sheets
Click here to Purchase the Cannabis Dispensary Dashboard in Google Sheets
- 4 KPI Summary Cards on the Overview page — Total Revenue, Transactions, Average Transaction Value, and Units Sold update instantly when slicers are applied. This dashboard tracks these 4 core metrics across all 6 pages simultaneously.
- Dynamic Slicers for one-click filtering — Native Google Sheets slicers let you filter by Date, Category, Payment Method, and Budtender in a single click. The entire dashboard refreshes without editing any formulas.Cannabis Dispensary Dashboard in Google Sheets
- Budtender performance tracking — Revenue and Transactions by Budtender charts on the Sales page make it easy to identify top performers, set improvement targets, and plan scheduling — a feature unavailable in standard spreadsheet templates.
- Strain-level product analysis — Revenue by Strain, Revenue and Units by Category, and Revenue by Category and Month give buyers and category managers the data needed to optimize stock and run targeted promotions.
- Customer segmentation — Revenue by Customer Type and Revenue by Payment Method reveal whether loyalty customers outspend walk-ins and which payment methods are gaining adoption.
- Instant sale lookup via Search Sheet — Enter any Sale ID and the dashboard returns Date, Category, Product Name, Strain, Budtender, Customer ID, Revenue, Units Sold, Payment Method, Customer Type, and Status in under 5 seconds.
- Zero ongoing cost — One-time purchase, lifetime access, runs in free Google Sheets with no paid add-ons, no macros requiring special permissions, and no account setup beyond a standard Google account.
Dashboard Pages Explanation
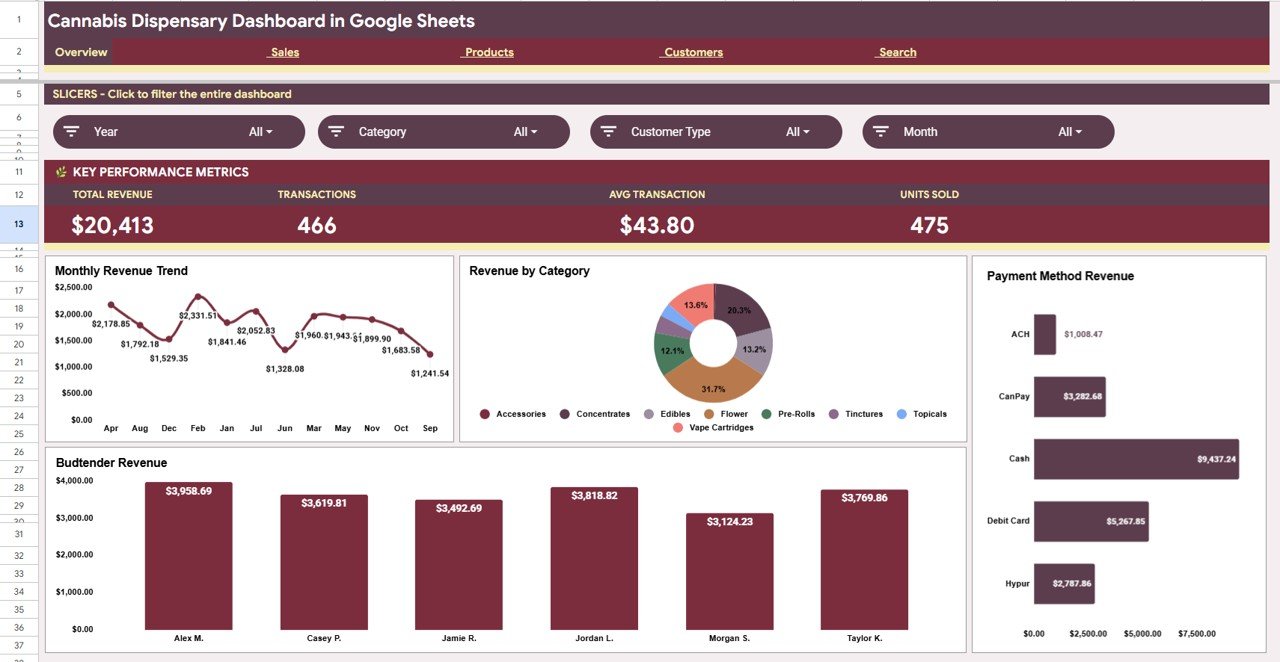
Page 1: Overview
The Overview page is the command center of the Cannabis Dispensary Dashboard in Google Sheets. At the top, 4 KPI cards display Total Revenue, Transactions, Avg Transaction, and Units Sold for the selected period. Below the KPIs, 4 charts provide immediate visual context: Revenue by Month (to spot seasonal trends), Revenue by Category (to see which product lines dominate), Revenue by Payment Method (to understand how customers pay), and Revenue by Budtender (to track staff-level contribution). Dynamic slicers sit at the top of the page and filter all four charts simultaneously.
Page 2: Sales Analysis
Click here to Purchase the Cannabis Dispensary Dashboard in Google Sheets
The Sales page deepens the revenue picture with three focused analyses: Revenue by Customer Type (to compare recreational vs. medical spend), Revenue and Transactions by Budtender (to benchmark staff performance side by side), and Revenue and Units Sold by Month (to view volume and revenue trends together on the same timeline). Managers can use this page to run monthly team reviews and set data-driven targets.

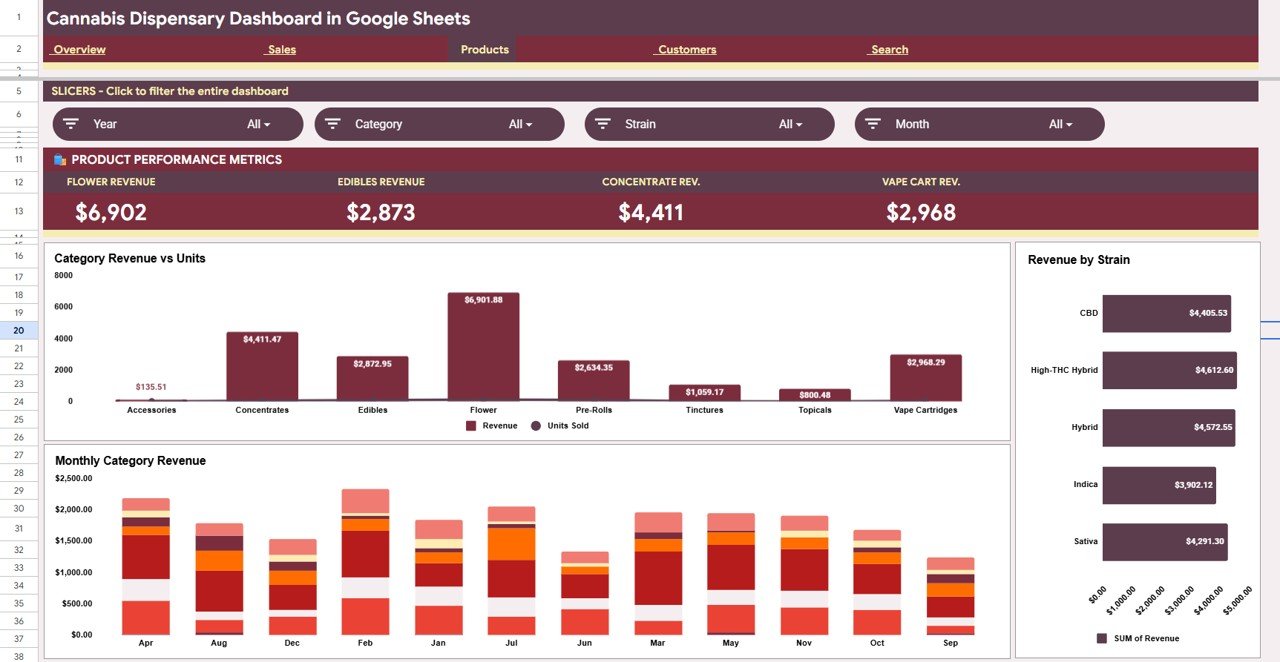
Page 3: Products Analysis
The Products page is designed for buyers, category managers, and merchandising decisions. Three views give a full picture of the product portfolio: Revenue and Units by Category (to identify which product lines generate the most volume and value), Revenue by Strain (to pinpoint which strains are bestsellers), and Revenue by Category and Month (to track how product mix shifts over time and plan seasonal inventory accordingly).
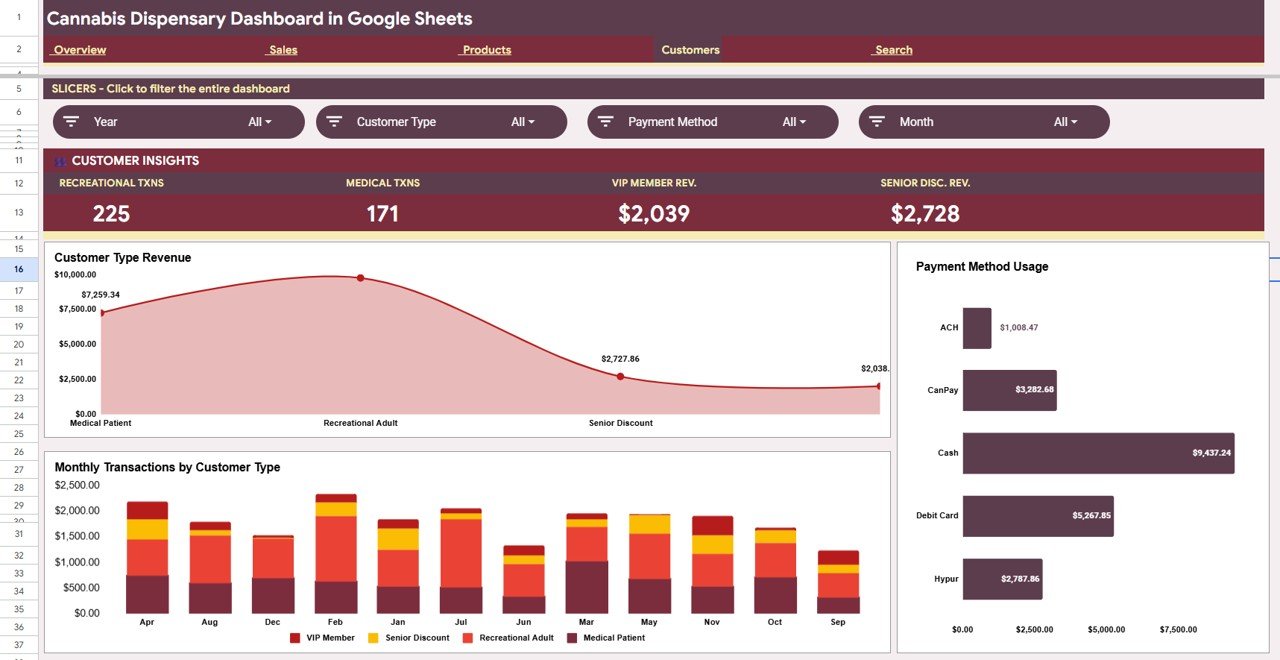
Page 4: Customers Analysis
Click here to Purchase the Cannabis Dispensary Dashboard in Google Sheets
The Customers page breaks down the revenue base into customer segments. Revenue by Customer Type reveals the financial weight of each customer segment (e.g., recreational vs. medical vs. loyalty members). Revenue by Payment Method shows whether cash, card, or digital payments dominate, informing payment terminal decisions. Transactions by Customer Type highlights which segment visits most frequently, helping loyalty program design and promotional targeting.
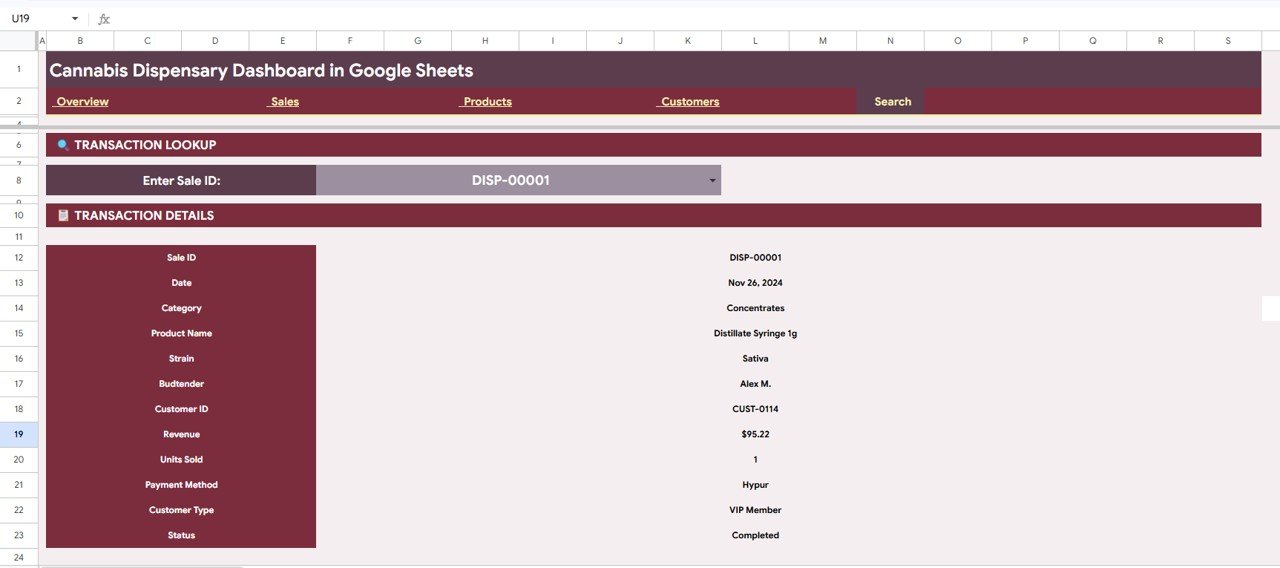
Page 5: Search Sheet
The Search Sheet is a transaction-level lookup tool built directly into the dashboard. Enter or select any Sale ID from the dropdown and the sheet instantly populates with the complete transaction record: Date, Category, Product Name, Strain, Budtender, Customer ID, Revenue, Units Sold, Payment Method, Customer Type, and Status. This feature is particularly valuable for compliance audits, customer service queries, and internal investigations requiring transaction-level evidence.
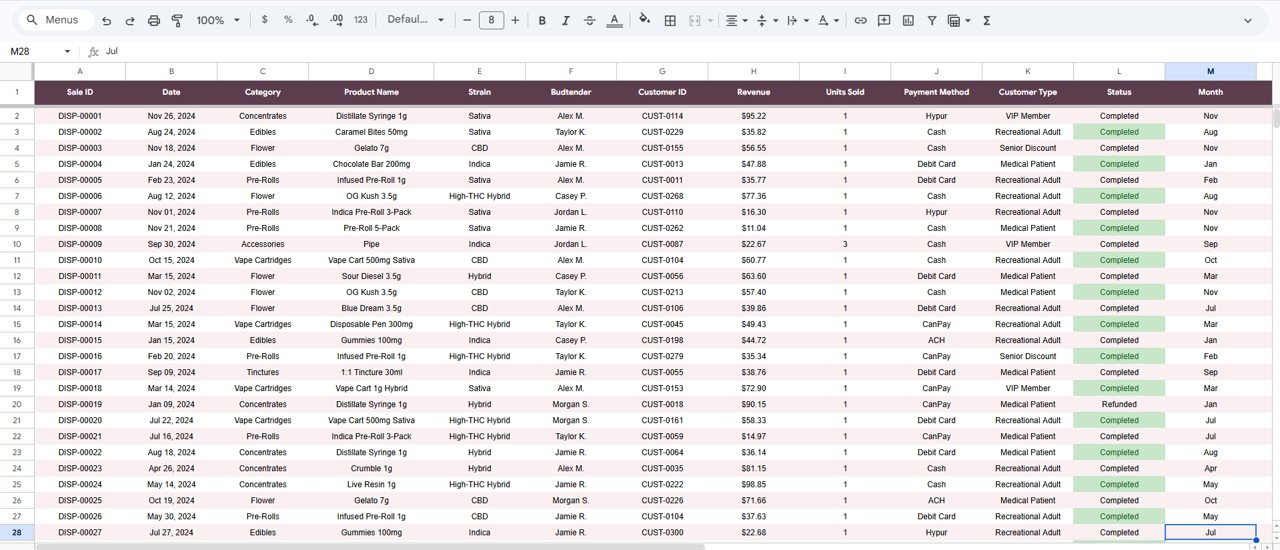
Data Sheet
Click here to Purchase the Cannabis Dispensary Dashboard in Google Sheets
The Data Sheet is the single source of truth for the entire dashboard. Add or paste your dispensary sales records into the structured table format with columns for Date, Category, Product Name, Strain, Budtender, Customer ID, Revenue, Units Sold, Payment Method, Customer Type, and Status. Once data is entered, all five analysis pages and the Search Sheet update automatically.
Cannabis Dispensary Dashboard in Google Sheets vs. Excel Dashboard vs. Paid Cannabis POS — Feature Comparison
| Feature | Cannabis Dispensary Dashboard (Google Sheets) | Excel Dashboard | Paid Cannabis POS/Analytics (Leafly, Flowhub) |
|---|---|---|---|
| Cost | $9.99 one-time | $17.99 one-time | $200–$500+ per month |
| Platform | ✅ Google Sheets (browser + mobile) | Requires MS Excel desktop | Proprietary SaaS platform |
| Setup time | ✅ Under 10 minutes | Under 15 minutes | Days to weeks (onboarding + POS setup) |
| Real-time team collaboration | ✅ Yes — native Google Sheets sharing | Limited (OneDrive required) | ✅ Yes (cloud-native) |
| Budtender performance tracking | ✅ Built-in | ✅ Built-in | ✅ Built-in |
| Strain-level revenue analysis | ✅ Revenue by Strain | ✅ Yes | ✅ Yes |
| Customizable fields | ✅ Fully customizable | ✅ Fully customizable | Limited to platform fields |
| Year-1 cost at 5 users | $9.99 total | $17.99 total | $12,000–$30,000+ |
| No vendor lock-in | ✅ Your data, your file | ✅ Your data | ❌ Data held by vendor |
For dispensary operators who want professional revenue and performance analytics without paying SaaS prices, the Cannabis Dispensary Dashboard in Google Sheets sits in the sweet spot.
Who Should Use This Template
Click here to Purchase the Cannabis Dispensary Dashboard in Google Sheets
Perfect for:
- Cannabis dispensary owners and managers tracking daily and monthly revenue
- Budtenders and sales supervisors who want transparent performance data
- Multi-location operators who export POS data to CSV and need a consolidated reporting layer
- Finance and compliance teams preparing monthly revenue summaries by category, strain, or payment method
- Small dispensaries replacing expensive SaaS analytics add-ons with a one-time-purchase alternative
Not a fit if:
- You need a full POS system with real-time inventory management — use Leafly, Flowhub, or Cova instead
- Your operation requires automatic data sync without manual CSV export/import workflows
- You need enterprise-grade SSO, SOC 2, or multi-tenant data isolation
Real-World Use Cases
Maria manages operations at a 3-location cannabis dispensary in Colorado. She exports weekly POS data and pastes it into the Data Sheet. Within seconds she can compare which strains are driving revenue by location, which budtenders are hitting targets, and whether recreational vs. medical customer mix is shifting — without paying $300/month for a BI platform. The comparison table above shows her saving over $30,000 per year at 5 staff users compared to a paid SaaS solution.
Jordan runs a single-location dispensary and prepares his own investor reports. He uses the Cannabis Dispensary Dashboard in Google Sheets to build monthly slide deck visuals. The Revenue by Month and Revenue by Category charts copy cleanly into Google Slides, and the Customer Type breakdown shows his loyalty program is converting walk-ins — a data point his investors specifically asked for.
A dispensary compliance officer relies on the Search Sheet daily. When state auditors request transaction-level records, she enters the Sale ID and pulls Date, Product, Strain, Payment Method, and Status in under 5 seconds. What used to take 20 minutes of spreadsheet hunting now takes less time than making a cup of coffee.
Advantages of the Cannabis Dispensary Dashboard in Google Sheets
Click here to Purchase the Cannabis Dispensary Dashboard in Google Sheets
- No recurring cost — $9.99 once vs. $2,400–$6,000 per year for comparable SaaS analytics
- Runs on free infrastructure — Google Sheets is free; no Excel license, Power BI Pro subscription, or additional software required
- Instant team access — share via Google Drive link; no account provisioning, no per-seat licenses
- Fully auditable data trail — Google Sheets version history logs every change, giving compliance teams a reliable audit trail
- Easy to extend — add new columns to the Data Sheet and pivot tables update; no dashboard rebuild required
Opportunities for Improvement
- The dashboard requires manual data entry or CSV paste from a POS export — it does not auto-connect to POS systems like Flowhub, Dutchie, or Cova
- Real-time inventory tracking (current stock levels, reorder alerts) is outside the scope of this sales analytics dashboard
- Advanced statistical forecasting (regression models, predictive demand planning) would require a more specialized analytics environment like Python or Power BI
Best Practices
- Export POS data weekly — consistent weekly data entry gives the monthly trend charts meaningful granularity
- Standardize strain names — consistent strain naming in the Data Sheet ensures the Revenue by Strain chart groups correctly (e.g., avoid mixing “OG Kush” and “OGKush”)
- Use the Search Sheet for audit prep — before any compliance review, verify transaction records by pulling key Sale IDs through the Search Sheet
- Share with view-only access for staff — give budtenders view-only access to the Sales page so they can self-monitor performance without editing the data
Explore Relevant Templates
Looking for more Google Sheets Dashboard templates? You might also like:
- Drop Shipping Dashboard in Google Sheets — track orders, suppliers, and e-commerce revenue in Google Sheets.
- Social Media Influencer Tracking Dashboard in Google Sheets — monitor influencer KPIs and campaign ROI.
- Regional Franchise Performance Dashboard in Google Sheets — track multi-location performance across regions.
Also available as an Excel Dashboard or Power BI Dashboard for similar retail and sales analytics topics.
Frequently Asked Questions
Click here to Purchase the Cannabis Dispensary Dashboard in Google Sheets
What KPIs does the Cannabis Dispensary Dashboard in Google Sheets track?
The Cannabis Dispensary Dashboard in Google Sheets tracks 4 core KPIs — Total Revenue, Transactions, Average Transaction Value, and Units Sold — displayed as cards on the Overview page. All four update instantly when you filter via slicers or add new data to the Data Sheet.
Do I need a paid Google Workspace subscription to use this dashboard?
No. The Cannabis Dispensary Dashboard in Google Sheets works with a free personal Google account. No Google Workspace subscription, no paid add-ons, and no desktop installation are required.
How does this compare to paid cannabis analytics platforms like Leafly or Flowhub?
Paid platforms like Leafly and Flowhub charge $200–$500+ per month and are built around real-time POS integration. The Cannabis Dispensary Dashboard in Google Sheets costs $9.99 once and is designed for dispensaries that export POS data to CSV and want professional reporting without recurring fees.
Can I track budtender performance with this template?
Yes. The Sales page includes Revenue and Transactions by Budtender charts that let you compare individual staff performance, identify top earners, and set data-driven targets — all from your existing sales export data.
How long does setup take?
Setup takes under 10 minutes. After copying the template to your Google Drive via the PDF guide link, open the Data Sheet, paste your dispensary sales records into the provided format, and every chart and KPI card updates automatically. Slicers are pre-configured.
Can I customize the template to add new product categories or payment methods?
Yes. Because the dashboard is built on native Google Sheets pivot tables, adding new categories, strains, payment methods, or customer types to the Data Sheet means they automatically appear in all charts and slicer options without any manual dashboard rebuild.
Is the Cannabis Dispensary Dashboard available in Excel or Power BI?
The current version is built for Google Sheets. NextGenTemplates offers a wide range of Excel dashboards and Power BI dashboards for retail and sales analytics topics if you prefer those platforms.
About the Author
Built by PK — Microsoft Certified Professional with 15+ years of Excel, Google Sheets, and Power BI experience. Founder of NextGenTemplates, reaching 300K+ subscribers across YouTube channels. Every template is hand-built and tested before release.
Conclusion
The Cannabis Dispensary Dashboard in Google Sheets gives dispensary owners and managers a professional, 6-page analytics solution covering revenue, budtender performance, product and strain analysis, customer segmentation, and instant sale lookup — for a one-time payment of $9.99.
Click here to Purchase the Cannabis Dispensary Dashboard in Google Sheets
Instant download · One-time payment · No subscription
For video walkthroughs and tutorials, visit YouTube.com/@NeoTechNavigators
📅 Last updated: June 2026