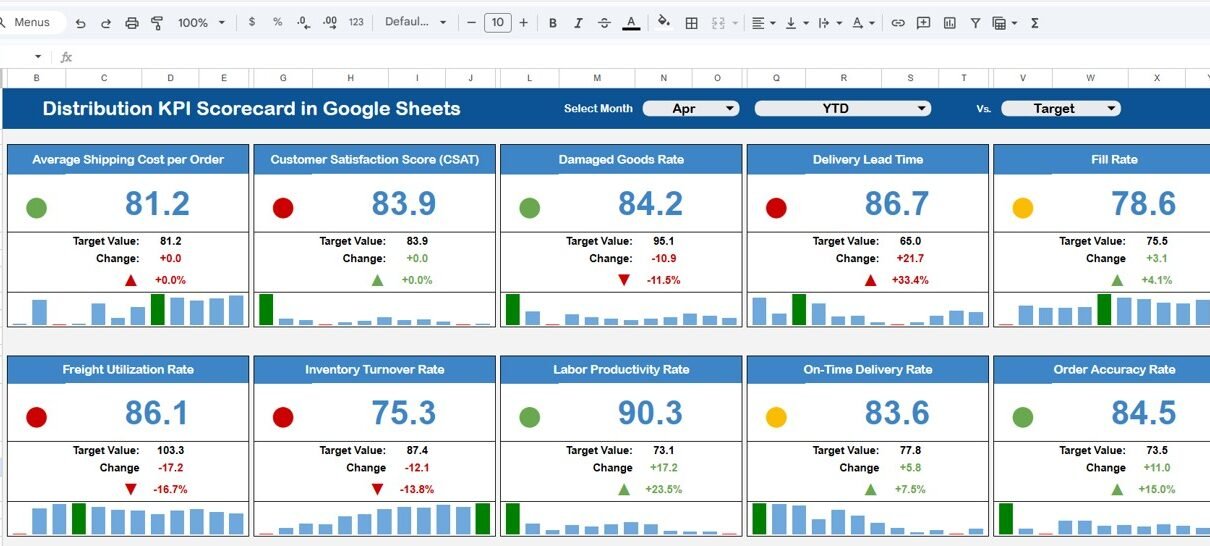
Track 10+ distribution KPIs with MTD and YTD trend charts, color-coded performance indicators, and dropdown-driven filtering in Google Sheets. Ready-to-use scorecard template with 4 worksheets.
Online Tutorial for Data Analysis and Automation
Track 10+ distribution KPIs with MTD and YTD trend charts, color-coded performance indicators, and dropdown-driven filtering in Google Sheets. Ready-to-use scorecard template with 4 worksheets.
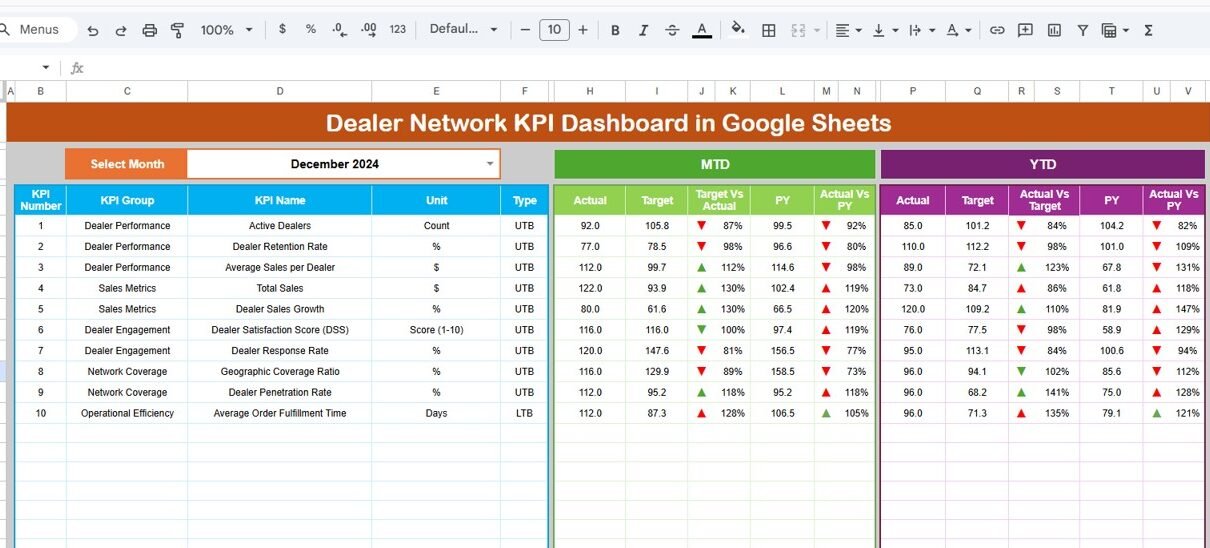
Managing a dealer network without clear performance metrics creates confusion and slow decision-making. Sales managers often struggle to track dealer productivity, market coverage, sales performance, and growth trends. As a result, they miss opportunities to improve dealer performance and expand market reach. However, a Dealer Network KPI Dashboard in Google Sheets solves this problem effectively. […]
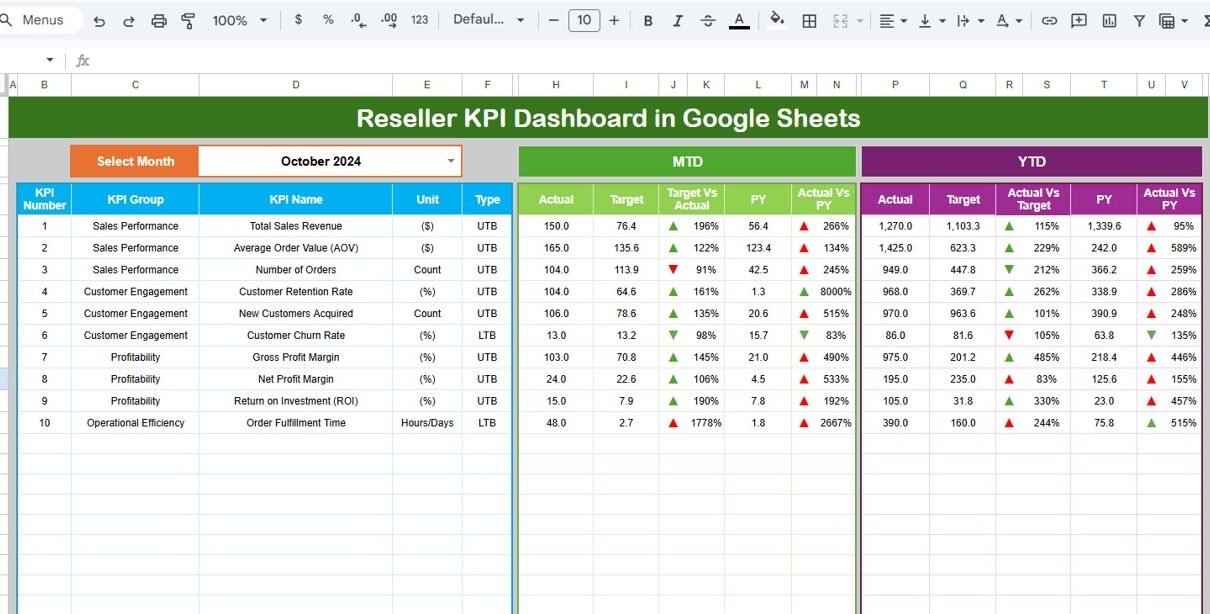
Managing reseller performance requires clear tracking, strong visibility, and timely decision-making. However, many businesses still rely on scattered reports and manual calculations. As a result, managers struggle to identify underperforming resellers, revenue gaps, and growth opportunities. Therefore, companies now prefer structured digital dashboards. The Reseller KPI Dashboard in Google Sheets provides a powerful yet simple […]