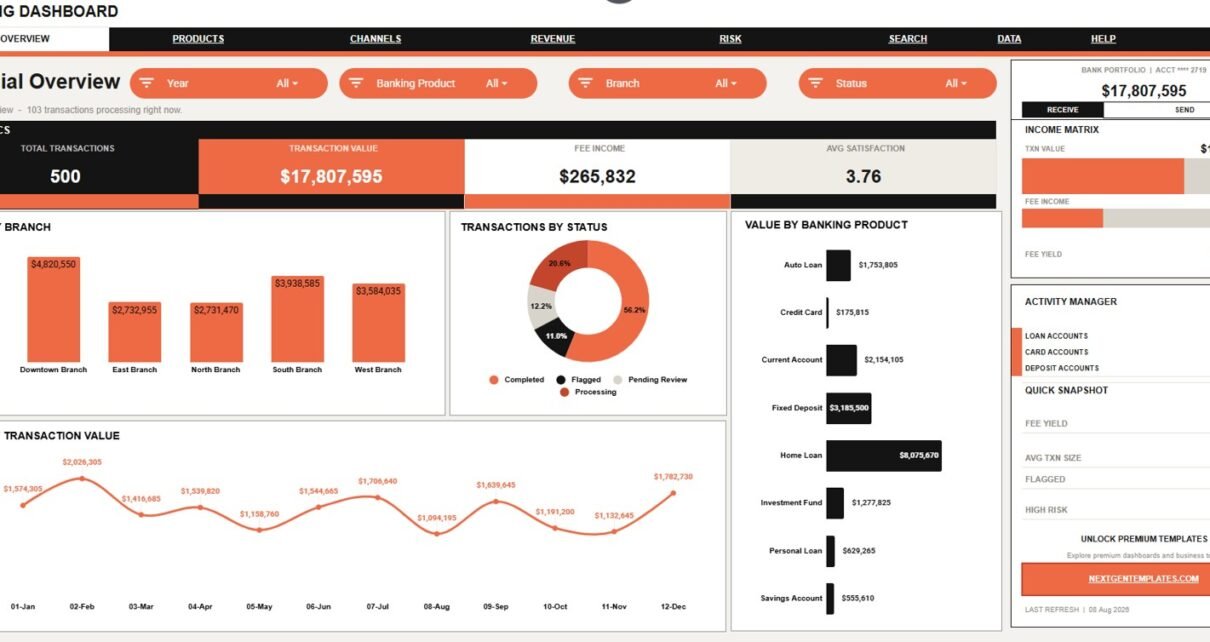
Banking Dashboard in Google Sheets is a ready-to-use Google Sheets template for banking teams that need visibility into transaction activity, fee revenue, banking product performance, channels, customer segments, satisfaction, risk, and processing time. The workbook includes 7 sheet tabs, 4 headline KPI cards, 21 chart views, native slicers, a Transaction Lookup screen, and an editable Data Sheet. Instead of rebuilding reports from exports each week, users can add rows once and review the banking story through organized dashboard pages.Banking Dashboard in Google Sheets
Many banking reports live across branch exports, product files, transaction systems, and service notes. This template gives teams a spreadsheet-based way to review those records by branch, product, channel, segment, manager, risk level, status, and month.
Get the Banking Dashboard in Google Sheets
Key Features of Banking Dashboard in Google Sheets
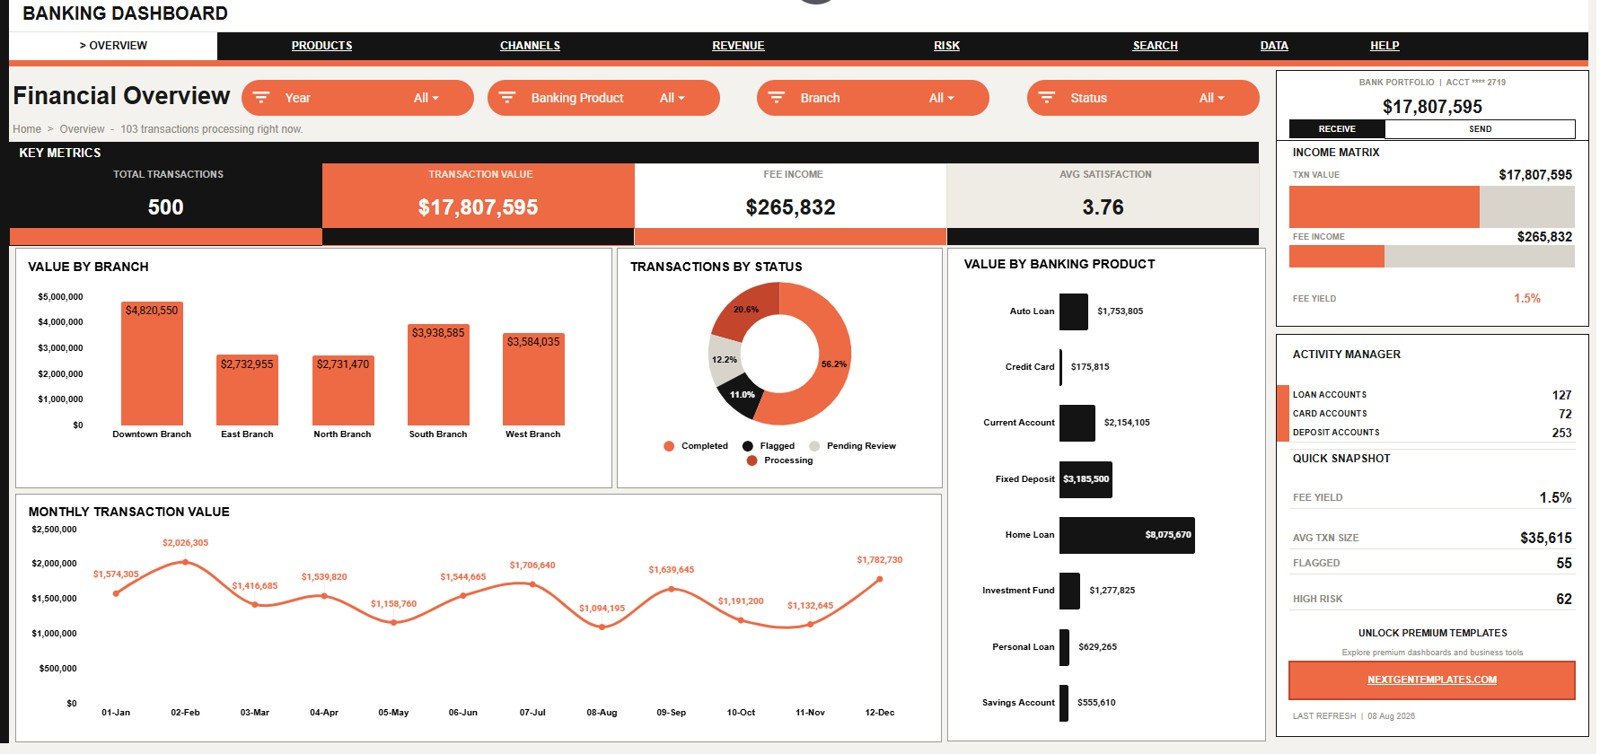
The Overview page starts with Total Transactions, Transaction Value, Fee Income, and Avg Satisfaction, giving managers a balanced view of activity, value, revenue, and customer experience. Slicers let users filter results by operational dimensions without building separate reports.
The workbook separates analysis into Overview, Product Portfolio, Channel Analysis, Fee Revenue, Risk & Compliance, Transaction Lookup, and Data Sheet tabs, so each review has a clear purpose.
Dashboard Pages Explanation
1 – Overview Page
Total Transactions: Shows the number of records in the filtered view. It helps confirm whether branch, product, or channel filters are changing the transaction base.
Transaction Value: Shows total monetary value for selected transactions. It separates high-volume activity from high-value activity.
Fee Income: Summarizes fees generated by selected records. Finance teams can compare fee contribution by branch, product, segment, or channel.
Avg Satisfaction: Shows average satisfaction score. It keeps customer experience visible beside volume and revenue.
Transaction Value by Branch: Compares value across branches. Managers can spot high-value locations and branches needing review.
Transactions by Status: Breaks records into status groups. Teams can quickly see pending, failed, or completed activity.
Transaction Value by Banking Product: Ranks products by value contribution. It shows which banking products are moving the most money.
Monthly Transaction Value by Month: Tracks value over time. Teams can identify growth, seasonality, and unusual months.
2 – Product Portfolio
Monthly Transactions by Branch: Tracks branch workload over time. This helps managers see changing transaction patterns.
Average Satisfaction by Banking Product: Compares customer experience across products. Low scores can point to service or process issues.
Transaction Value by Banking Product: Shows value contribution by product. It helps finance and product teams prioritize attention.
Fee Income by Banking Product: Compares revenue contribution by product. It reveals products that earn more fees even with lower volume.
Transactions by Banking Product: Shows usage by count. It helps teams understand demand and workload by product line.

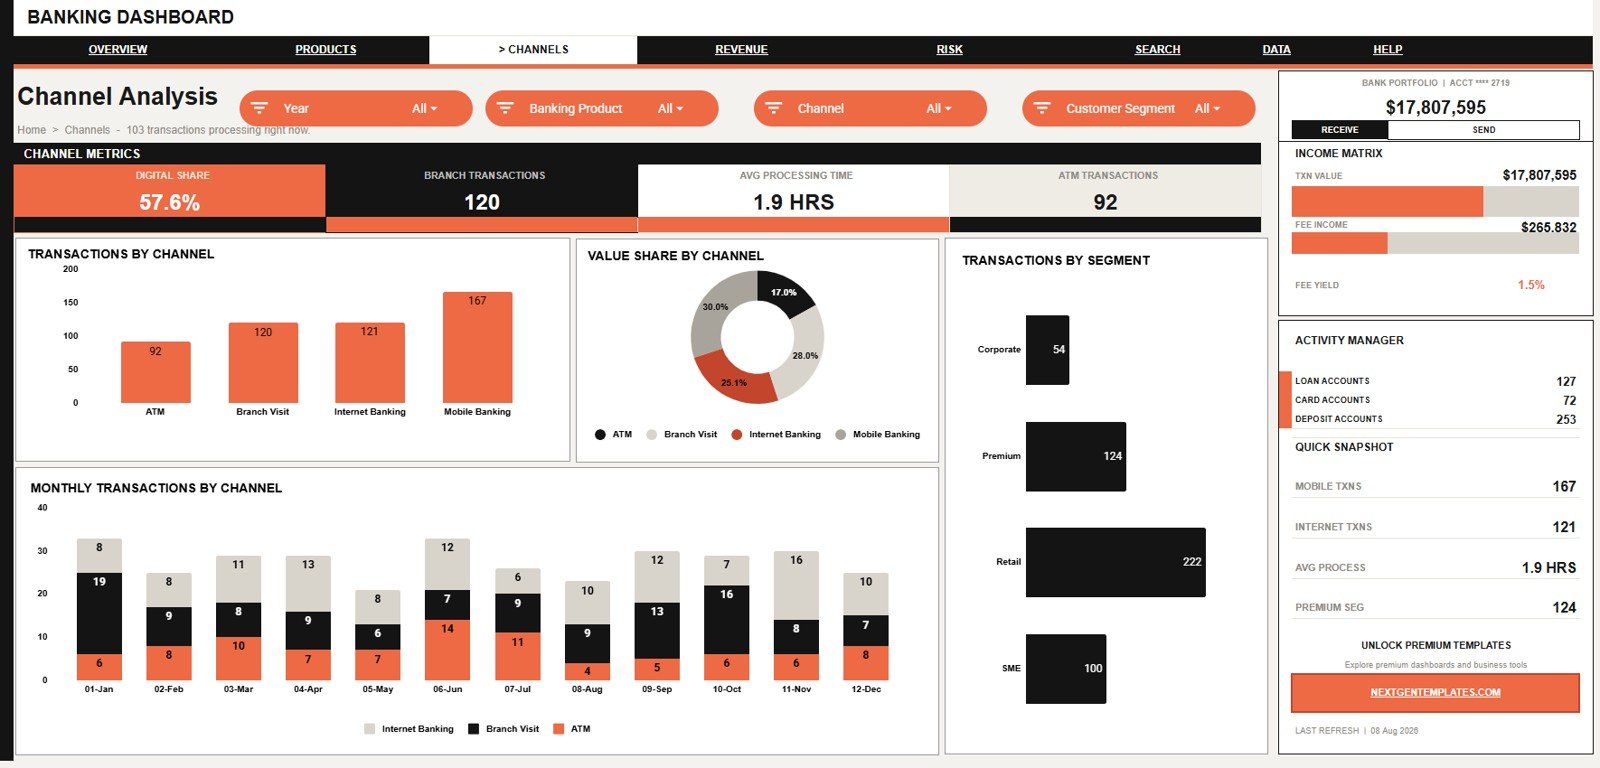
3 – Channel Analysis
Transactions by Channel: Shows volume by channel. Teams can compare branch, digital, ATM, mobile, and assisted activity.
Transaction Value Share by Channel: Shows each channel’s value share. It reveals channels that drive more value than their count suggests.
Transactions by Customer Segment: Groups volume by segment. Relationship teams can see where activity is concentrated.
Monthly Transactions by Channel: Tracks channel behavior over time. It highlights customer movement between service paths.
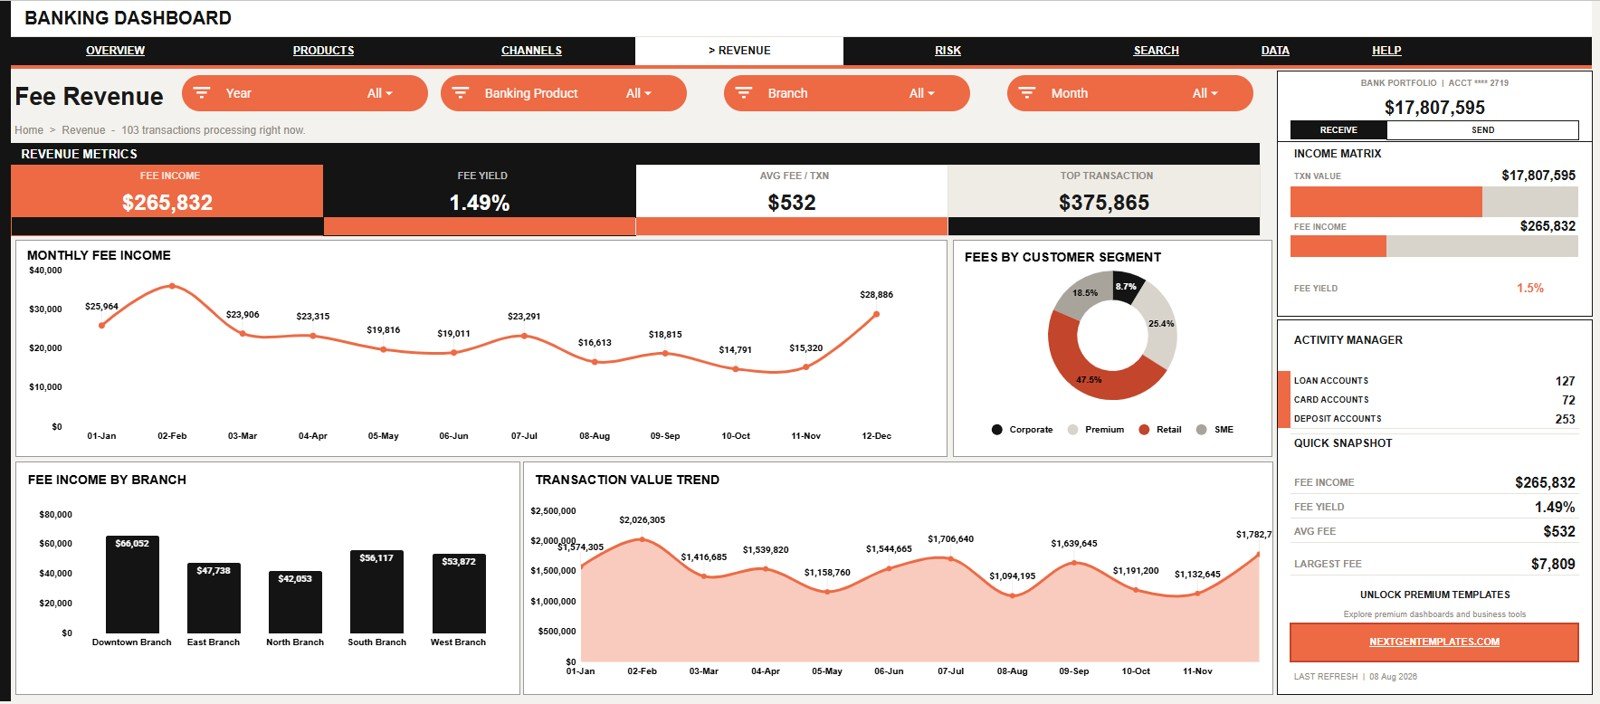
4 – Fee Revenue
Fee Income by Month: Tracks monthly fee revenue. Finance teams can see whether income is growing, slowing, or uneven.
Fee Income by Customer Segment: Compares fee income by segment. It shows which customer groups contribute more fees.
Fee Income by Branch: Ranks branches by fee contribution. This supports branch performance review.
Transaction Value by Month: Tracks monthly value. It helps compare whether fee income is moving with transaction value.
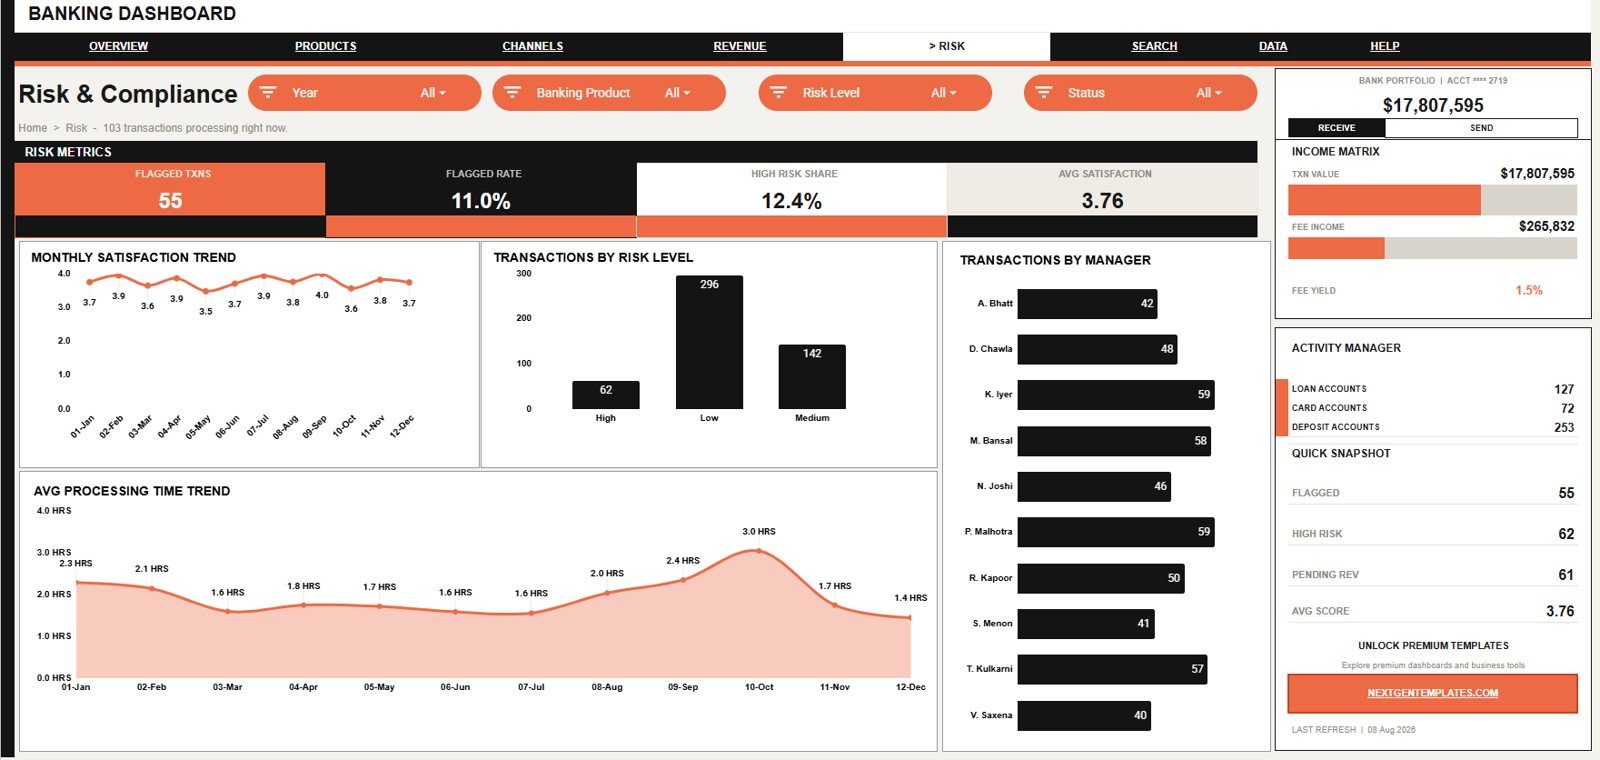
5 – Risk & Compliance
Satisfaction Score by Month: Tracks satisfaction over time. Teams can see whether service quality is improving or slipping.
Transactions by Risk Level: Shows records by risk group. Reviewers can focus on higher-risk activity.
Transactions by Relationship Manager: Compares activity by manager. It supports workload review and follow-up planning.
Average Processing Time by Month: Tracks processing speed. Operations teams can catch slowdowns before they affect customers.
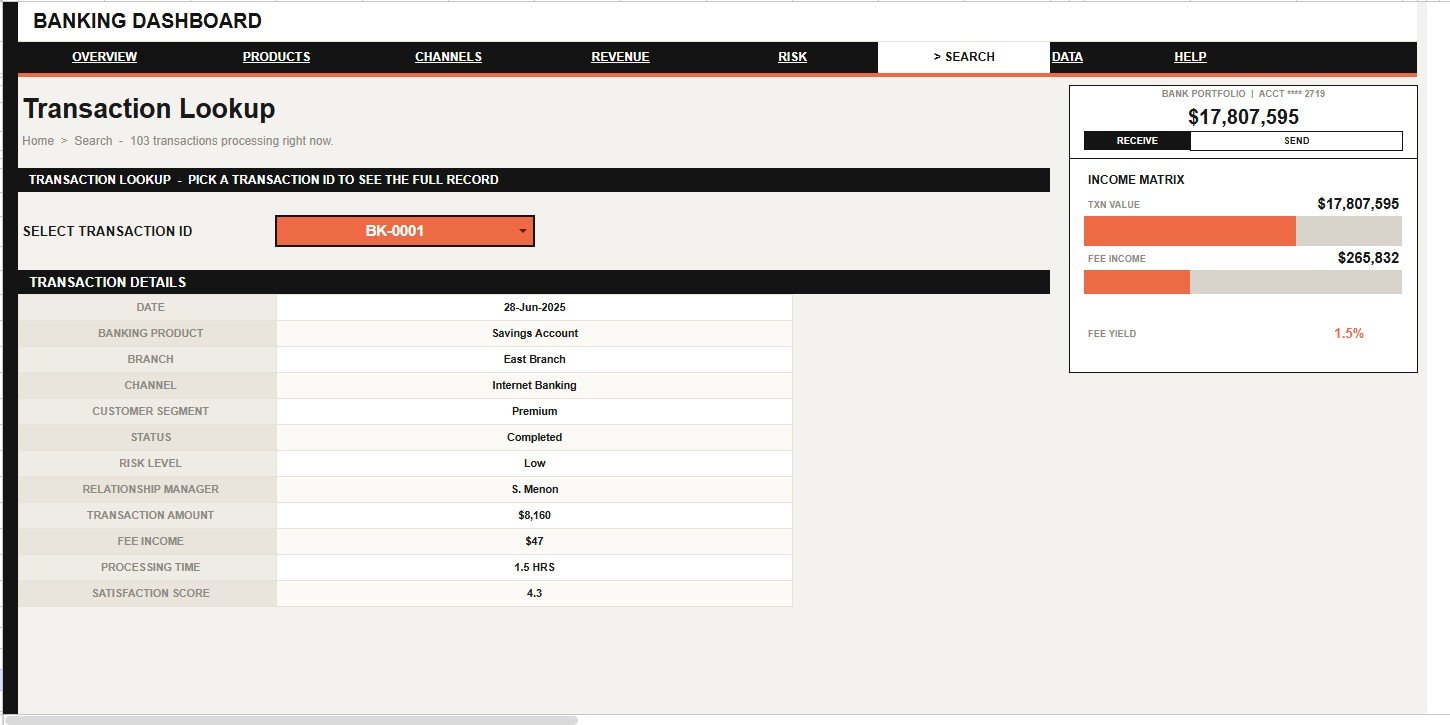
6 – Transaction Lookup
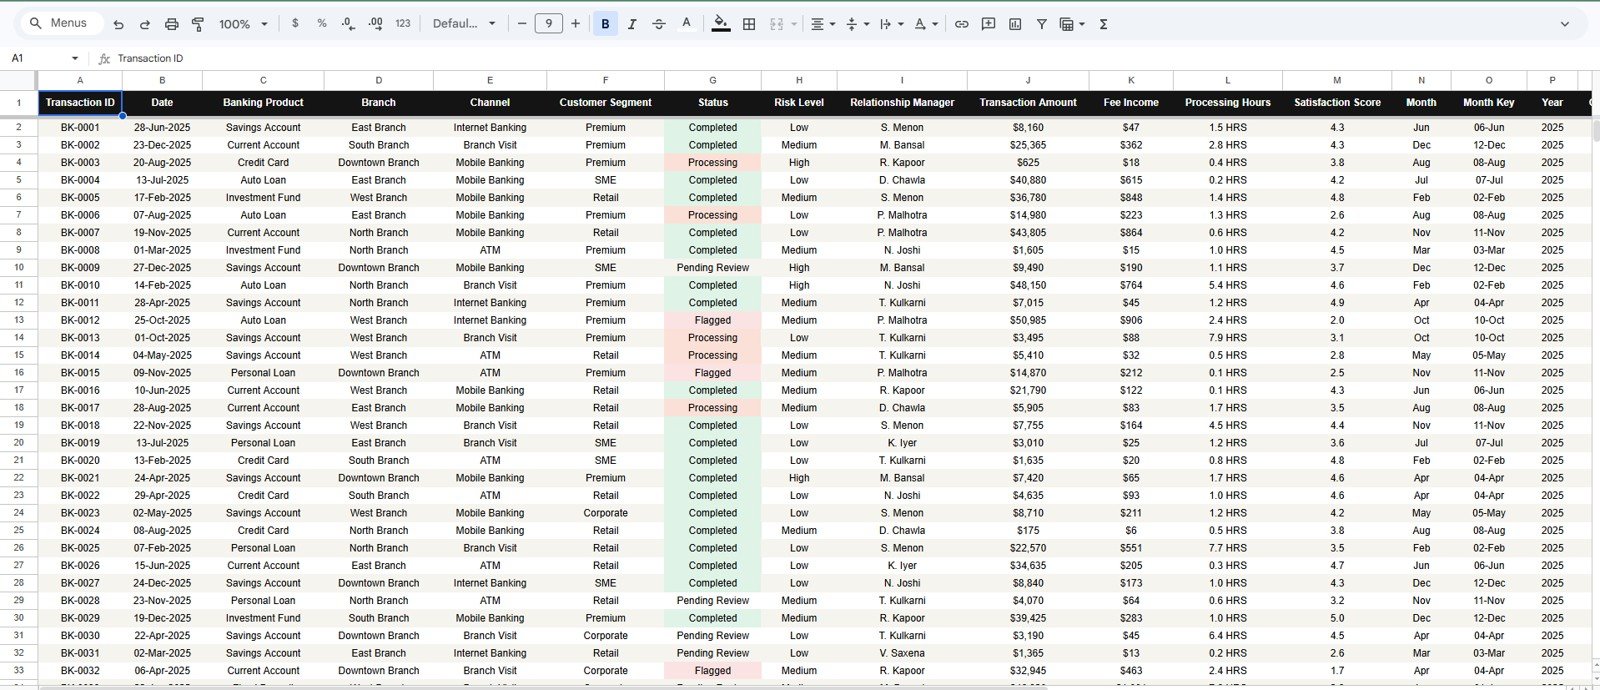
This search sheet lets users pick a transaction ID and view the full banking record, including date, banking product, branch, channel, customer segment, status, risk level, relationship manager, amount, fee income, processing time, and satisfaction score.
7 – Data Sheet Tab
This is where users add banking data in the same format as the sample records. Clean rows keep every card, slicer, chart, and lookup view consistent.
Banking Dashboard in Google Sheets vs. Microsoft Excel Dashboard vs. Paid CRM/SaaS – Feature Comparison
| Feature | Google Sheets template | Excel dashboard | Paid SaaS |
|---|---|---|---|
| Cost | One-time purchase | Template plus Excel license | Subscription |
| Platform | Google Sheets | Excel desktop or web | Vendor app |
| Setup time | Copy and paste data | Download and refresh | Implementation |
| Collaboration | Native sharing | OneDrive or SharePoint | License based |
| Mobile access | Google Sheets app | Depends on setup | Usually included |
| Custom fields | Editable | Editable | Vendor controlled |
| Share with link | Google permissions | Microsoft permissions | Account based |
| Year-1 cost at 5 users | $9.99 before Workspace licensing | Template plus licenses | Often higher |
| Transaction lookup | Included | Depends on template | Usually included |
| Best use case | Spreadsheet reporting | Excel-first teams | Enterprise systems |
Who Should Use This Template
Use it if you are a branch manager, banking operations analyst, finance reviewer, relationship manager, product analyst, service quality lead, or compliance reviewer working from spreadsheet exports. It is also useful for consultants and trainers who need a realistic banking analytics example in Google Sheets.
Real-World Use Cases
Branch review meeting: Filter by month and branch to review transaction value, status, fee income, and satisfaction.
Product portfolio review: Compare value, fee income, count, and satisfaction across banking products.
Risk follow-up: Filter high-risk transactions, review manager activity, then inspect specific records through lookup.
Channel planning: Compare channel volume and value share to see where customers are moving.
Advantages of Banking Dashboard in Google Sheets
The main advantage is speed. Teams can start from an editable spreadsheet instead of waiting for a custom dashboard project. The second advantage is transparency: users can see the data structure, adjust fields, and adapt charts. The third advantage is collaboration through Google Sheets sharing.
Opportunities for Improvement
This template does not automatically connect to core banking systems unless your team builds an import process. It also does not replace audit trails, fraud detection, regulatory reporting, or access controls. For live customer data, use only approved records and follow your internal governance policy.
Best Practices
Keep the Data Sheet clean. Do not mix comments, merged cells, or unrelated summaries inside the transaction table. Use consistent names for branches, products, channels, customer segments, statuses, risk levels, and relationship managers.
Review slicer behavior with your team. Google provides official guidance for filtering charts and tables with slicers. For sensitive data, also review sharing permissions before inviting collaborators.
Explore Relevant Templates
You can purchase the Banking Dashboard in Google Sheets from NextGenTemplates after the product draft is published. Related templates include Banking Operations KPI Dashboard in Google Sheets, Fintech Dashboard in Google Sheets, Banking Dashboard in Excel, and Mobile Banking Dashboard in Excel.
If you want to build dashboards like this yourself, the Excel Pivot Tables & Dashboards course on NextGenTemplates Academy teaches the reporting techniques step by step with practice files.
Get the Banking Dashboard in Google Sheets
Frequently Asked Questions
What is a Banking Dashboard in Google Sheets?
It is an editable Google Sheets template that converts banking transaction rows into KPI cards, charts, slicers, and lookup views.
Which KPI cards are included?
Total Transactions, Transaction Value, Fee Income, and Avg Satisfaction.
Can I analyze transaction value by branch?
Yes. The Overview page includes Transaction Value by Branch.
Does it analyze banking products?
Yes. It tracks product count, value, fee income, and satisfaction.
Can I use it for channel analysis?
Yes. It includes channel volume, value share, segment, and monthly channel charts.
Does it include risk analysis?
Yes. It includes risk level, relationship manager, satisfaction, and processing time views.
Is there a transaction lookup sheet?
Yes. Users can select a transaction ID and see the full record.
Can I replace the sample data?
Yes. Add records to the Data Sheet tab using the same structure.
About the Author
Built by PK – Microsoft Certified Professional with 15+ years of Excel, Google Sheets, and Power BI experience. Founder of NextGenTemplates, reaching 300K+ subscribers across YouTube channels. Every template is hand-built and tested before release.
Conclusion
The Banking Dashboard in Google Sheets gives banking teams a clear way to review transaction volume, value, fee income, satisfaction, product performance, channels, risk, managers, and processing time from one spreadsheet structure.