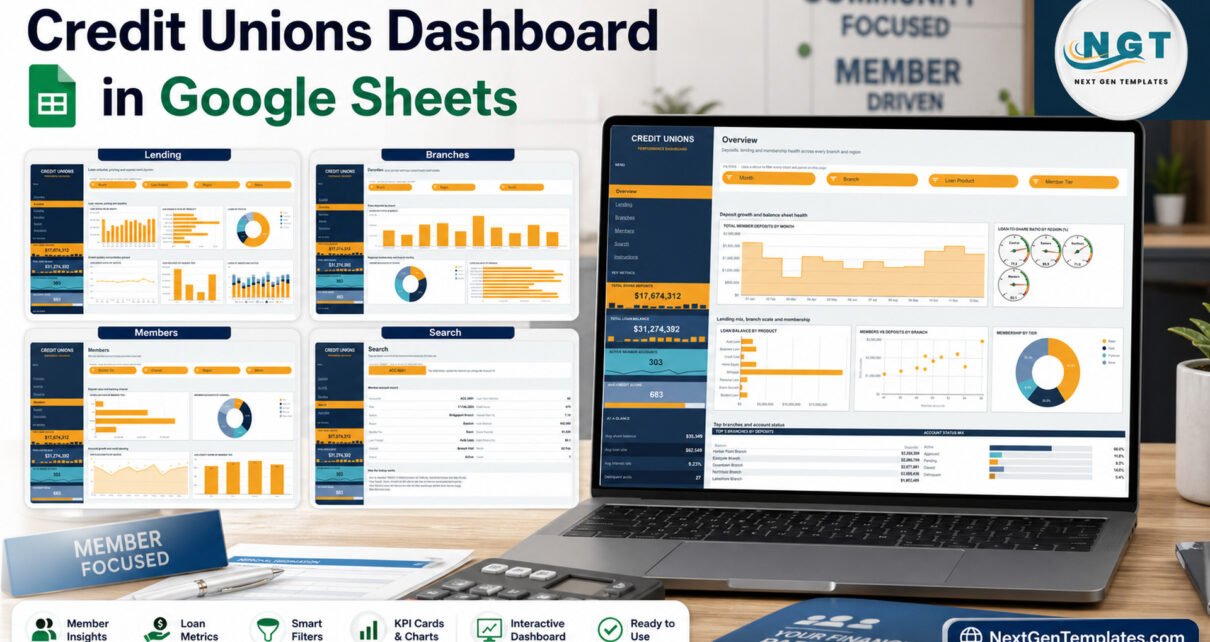
A six-tab Google Sheets credit union dashboard with 18 chart panels, 15 slicers, loan-to-share gauges by region and an Account ID lookup, built on fictional sample data.
Online Tutorial for Data Analysis and Automation
A six-tab Google Sheets credit union dashboard with 18 chart panels, 15 slicers, loan-to-share gauges by region and an Account ID lookup, built on fictional sample data.
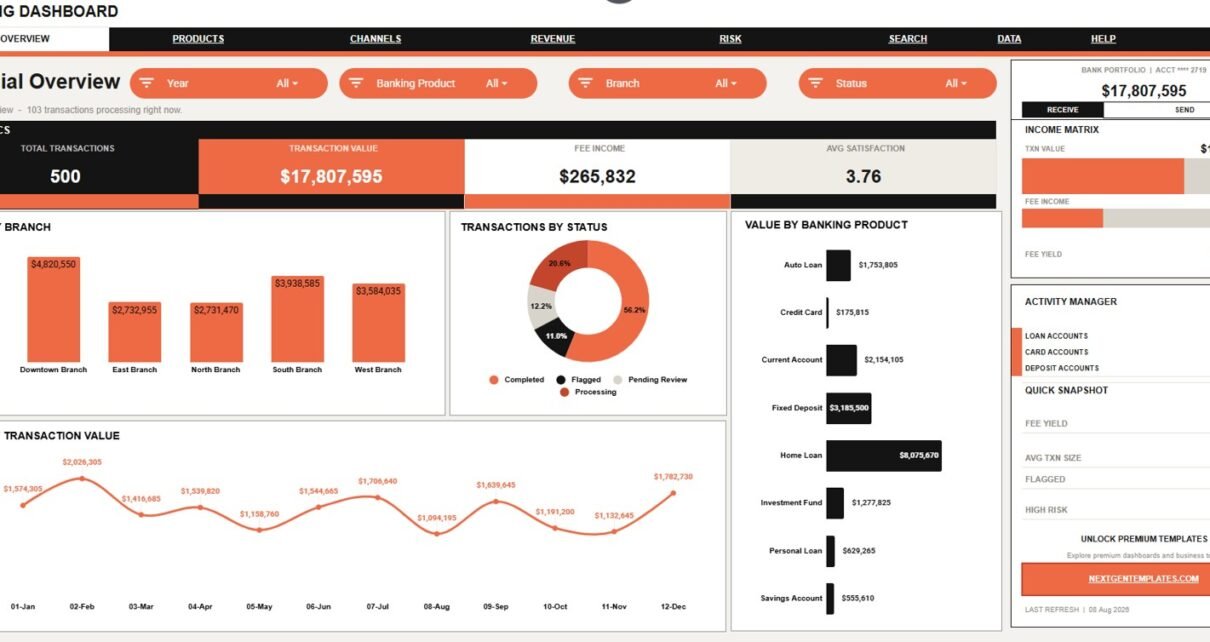
Banking Dashboard in Google Sheets is a ready-to-use Google Sheets template for banking teams that need visibility into transaction activity, fee revenue, banking product performance, channels, customer segments, satisfaction, risk, and processing time. The workbook includes 7 sheet tabs, 4 headline KPI cards, 21 chart views, native slicers, a Transaction Lookup screen, and an editable […]
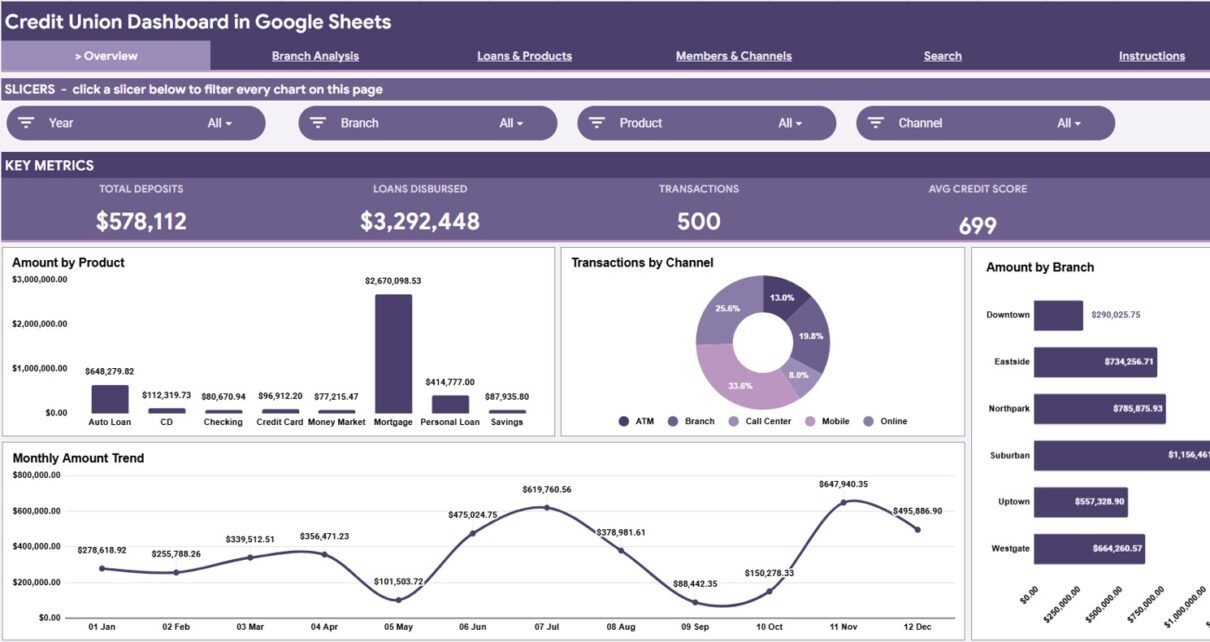
Credit union reporting template for deposits, loans, branches, products, member segments, channels, credit scores, lookup, and data entry in Google Sheets.
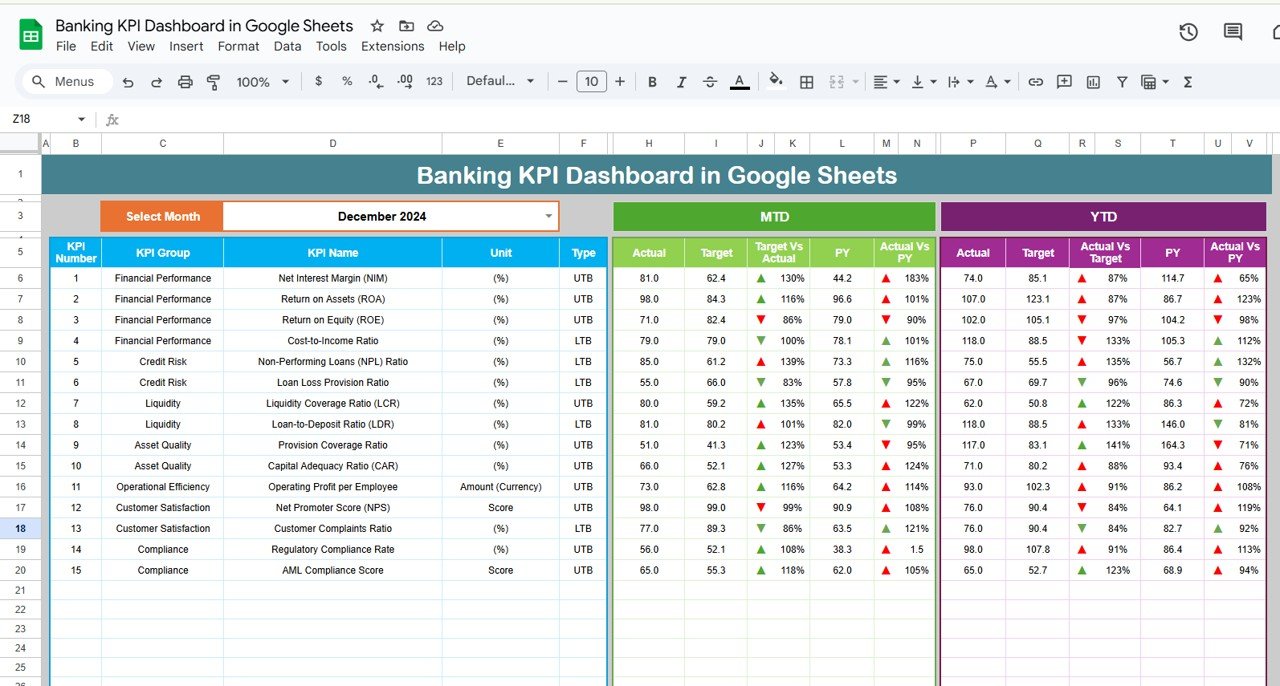
In the banking industry, key performance indicators (KPIs) are crucial for assessing financial health, customer satisfaction, operational efficiency, and more. A well-structured KPI dashboard helps bank managers monitor key metrics in real-time, making informed decisions that drive growth and ensure compliance. In this article, we will explore the Banking KPI Dashboard in Google Sheets—a ready-to-use […]