Blockchain and Cryptocurrency Dashboard in Google Sheets is a ready-to-use dashboard template for tracking crypto transactions, wallet value, portfolio allocation, fees, exchange volume, and market trends in one editable Google Sheets workbook. Crypto markets run 24 hours a day, 7 days a week, so manual records can become difficult to review when transactions are spread across coins, wallets, exchanges, and months. This dashboard organizes the workflow into 6 sheet tabs, 4 high-level overview cards, 16 chart views, multiple slicers, a transaction lookup page, and a structured data sheet.
The template is built for users who want spreadsheet control without building charts, slicers, formulas, and search logic from scratch. You can review the product on NextGenTemplates here: Blockchain and Cryptocurrency Dashboard in Google Sheets.
Get the Blockchain and Cryptocurrency Dashboard
Blockchain and Cryptocurrency Dashboard in Google Sheets
Key Features of Blockchain and Cryptocurrency Dashboard in Google Sheets
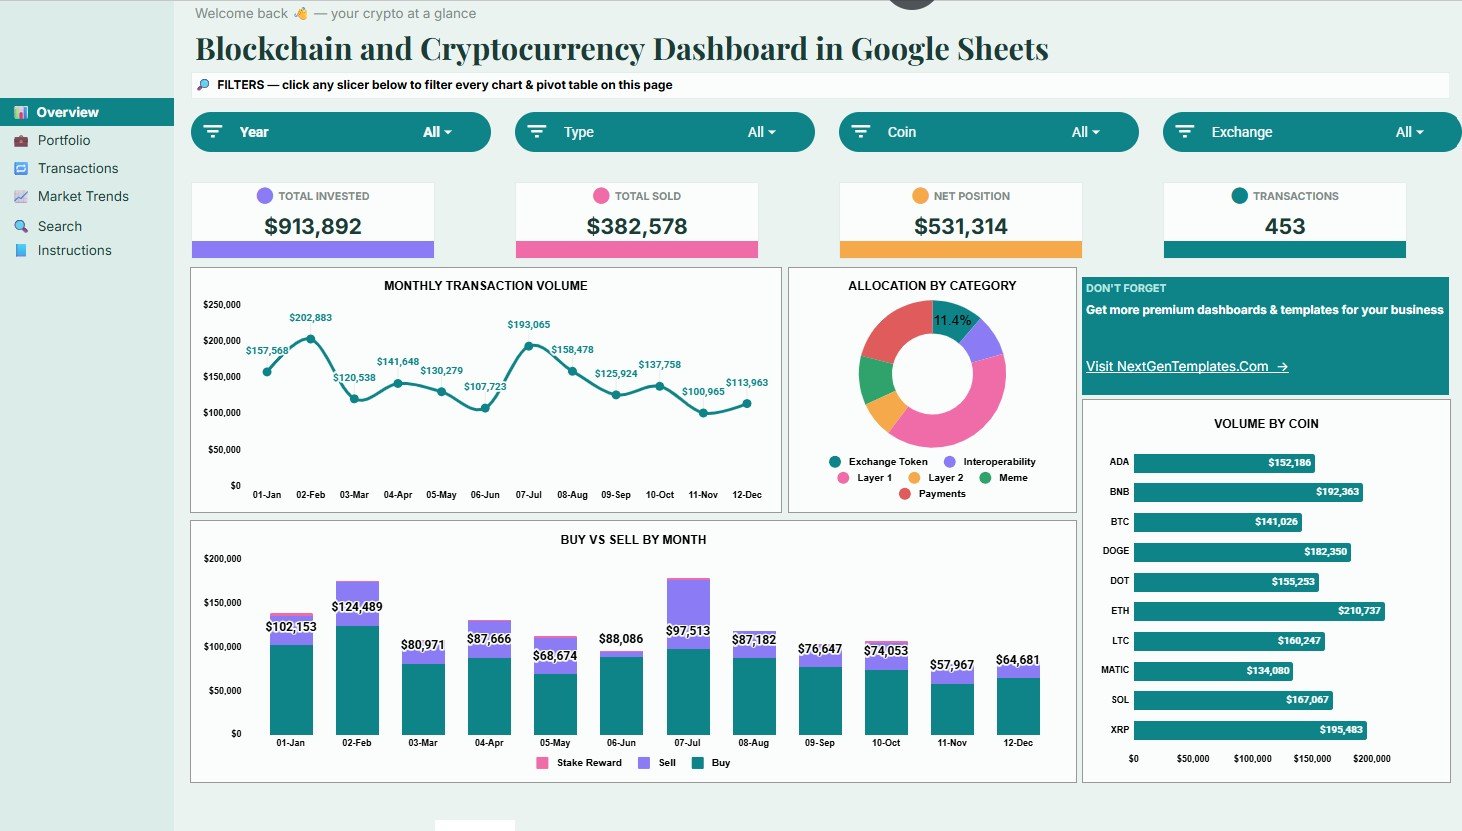
- Overview Page: Track Total Invested, Total Sold, Net Position, and Transactions in one high-level view.
- Portfolio Page: Analyze wallet value, category allocation, activity by coin, and category mix over time.
- Transactions Page: Review exchange volume, monthly fees, transaction status, and fee count patterns.
- Market Trends Page: Track BTC average price, ETH average price, average price by coin, and staking rewards.
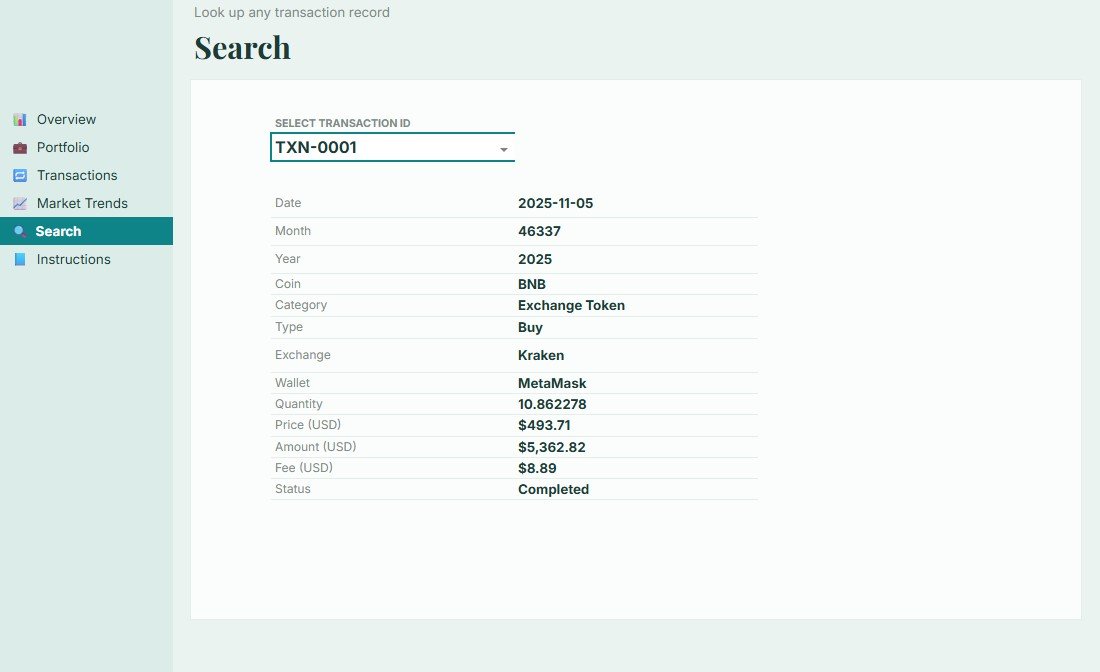
- Search Sheet: Select a transaction ID and return the complete matching record instantly.
- Data Sheet: Enter records in the same format and let dashboard pages update from the source data.
- Google Sheets sharing: Copy the file into Drive and share it with trusted collaborators using standard permissions.
Dashboard Pages Explanation
Blockchain and Cryptocurrency Dashboard in Google Sheets.
1 – Overview Page
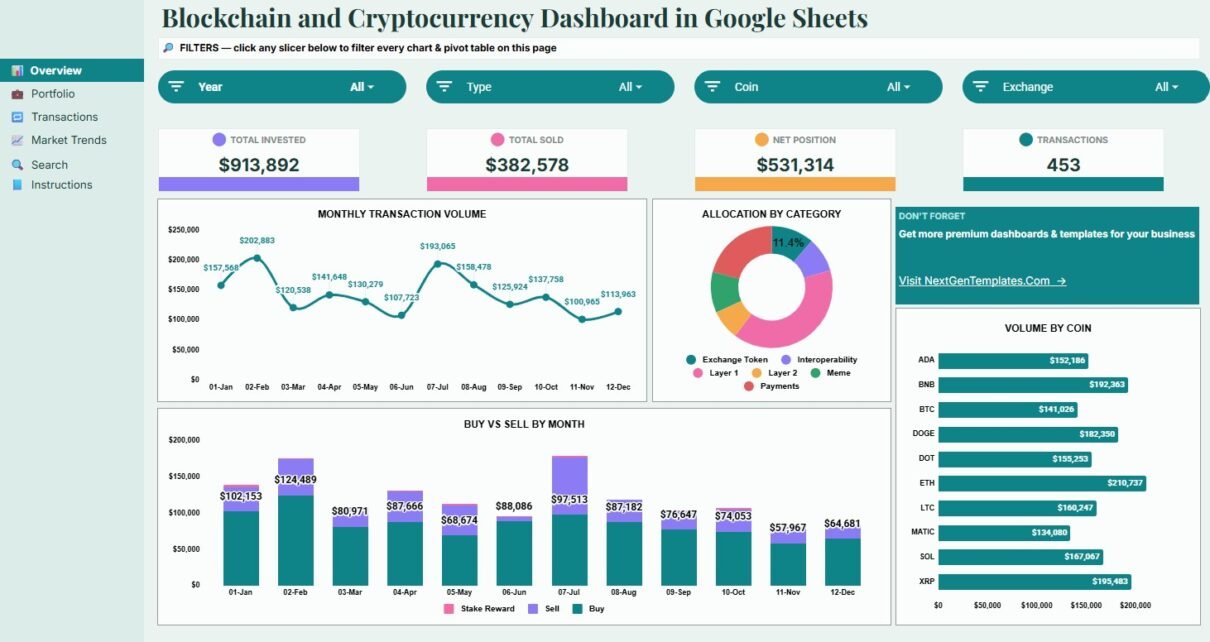
The Overview Page starts with four cards: Total Invested, Total Sold, Net Position, and Transactions. These cards give a fast read on portfolio movement before you review the detailed charts.
Transaction Volume by Month: This chart shows how transaction activity changes from month to month. It helps users identify busy trading periods, low-activity months, and seasonal transaction patterns.
Allocation by Category: This chart shows how crypto value is distributed across categories such as BTC, ETH, DeFi, stablecoins, or custom groups. It helps users see whether a portfolio is diversified or concentrated in a few categories.
Volume by Coin: This chart compares transaction volume by individual coin. It helps users identify which assets are driving the most recorded activity.
Buy and Sell Amount by Month: This chart compares monthly buying activity against monthly selling activity. It helps users understand whether they are accumulating, reducing, or rotating positions over time.
2 – Portfolio
The Portfolio tab focuses on where value is held and how the portfolio mix changes. It is helpful for investment reviews, treasury check-ins, and personal portfolio summaries.
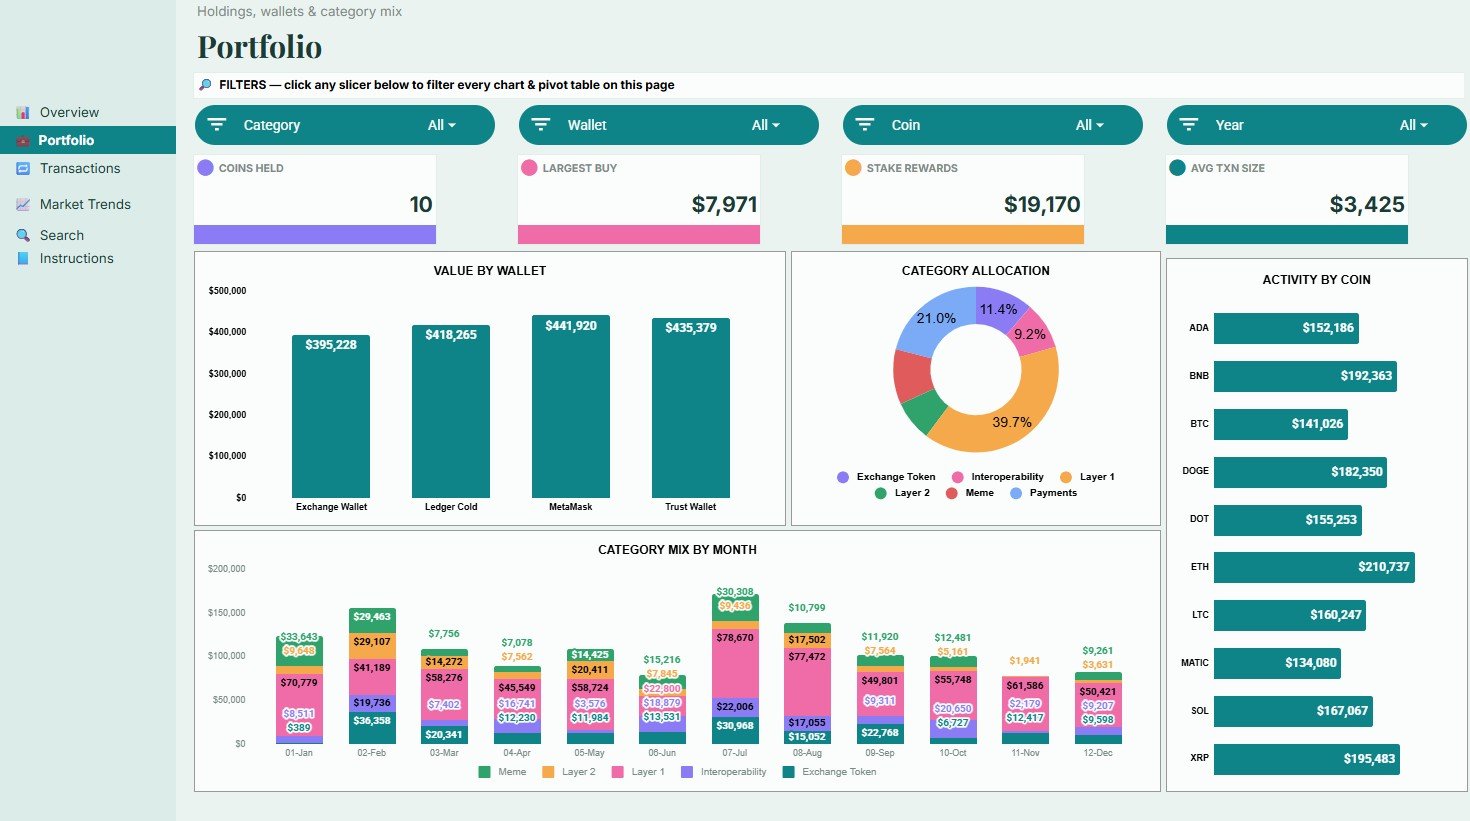
Value by Wallet: This chart compares crypto value across exchange wallets, hot wallets, cold wallets, or custom wallet labels. It helps users review custody spread and wallet concentration.
Allocation by Category: This chart summarizes portfolio exposure by category. It gives a quick view of whether value is weighted toward major coins, altcoins, staking assets, or other groups.
Activity by Coin: This chart shows which coins generate the most activity. It helps distinguish high-touch trading assets from long-term holdings.
Category Mix by Month: This chart shows how category exposure changes month by month. It helps users see portfolio rotation and shifts in strategy.
3 – Transactions
The Transactions tab turns raw transaction rows into operational analysis. It is especially useful for reviewing exchanges, fees, status, and transaction counts without scrolling through the source data.
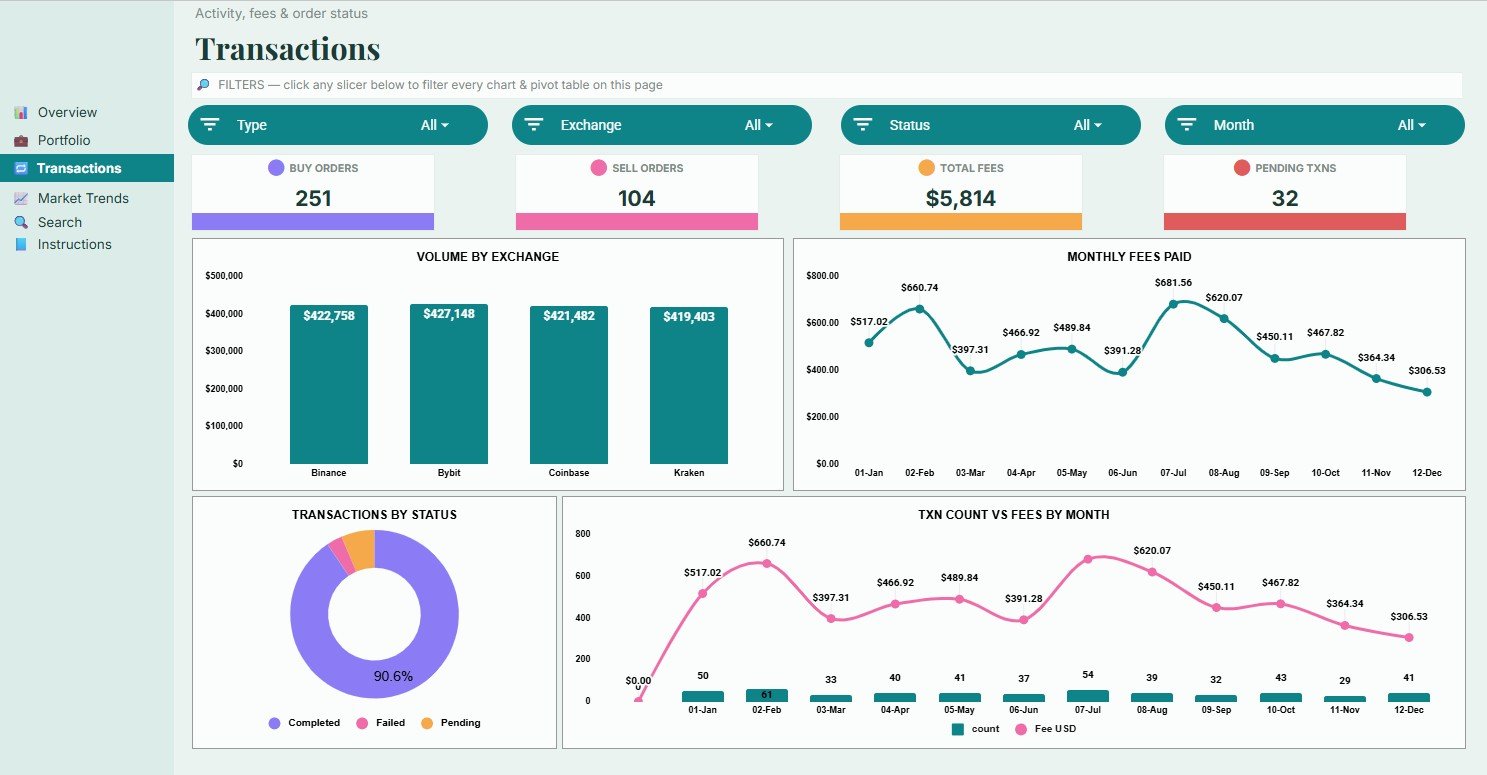
Volume by Exchange: This chart compares transaction volume across exchanges or platforms. It helps users understand where most activity is taking place.
Monthly Fees Paid by Month: This chart tracks fee spend over time. It helps users see when transaction costs rise and whether those increases match higher activity.
Transactions by Status: This chart groups transactions by status such as completed, pending, failed, or custom values. It gives a fast quality check on transaction processing.
Txn Count and Fees by Month: This chart compares monthly transaction count with monthly fees. It helps users tell whether fee increases are caused by more transactions or by costlier transactions.
4 – Market Trends
The Market Trends tab adds market context to the transaction and portfolio views. It lets users review BTC, ETH, staking, and average price movement from the data they maintain.
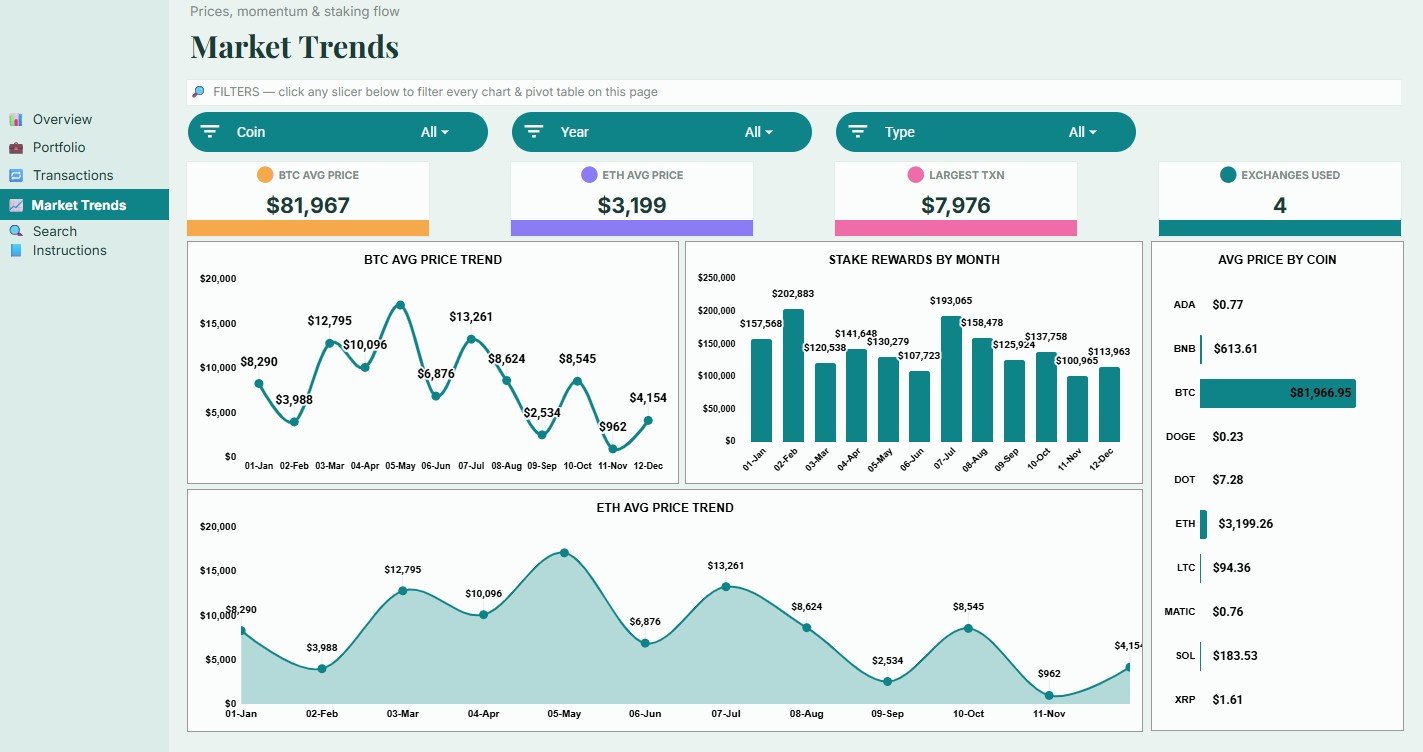
BTC Avg Price by Month: This chart tracks average Bitcoin price by month based on the entered records. It helps users compare portfolio activity with Bitcoin movement.
Stake Rewards by Month: This chart summarizes staking rewards over time. It helps users review passive crypto income without searching transaction rows manually.
Average Price by Coin: This chart compares average price across tracked coins. It gives a simple reference view for price levels across assets.
ETH Avg Price by Month: This chart tracks average Ethereum price by month. It gives ETH-specific context for users who hold, buy, sell, or stake Ethereum.
5 – Search Sheet Tab
The Search Sheet tab lets users select a transaction ID and review the full matching record. The lookup includes date, coin, category, type, exchange, wallet, quantity, price, amount, fee, and status.
6 – Data Sheet Tab
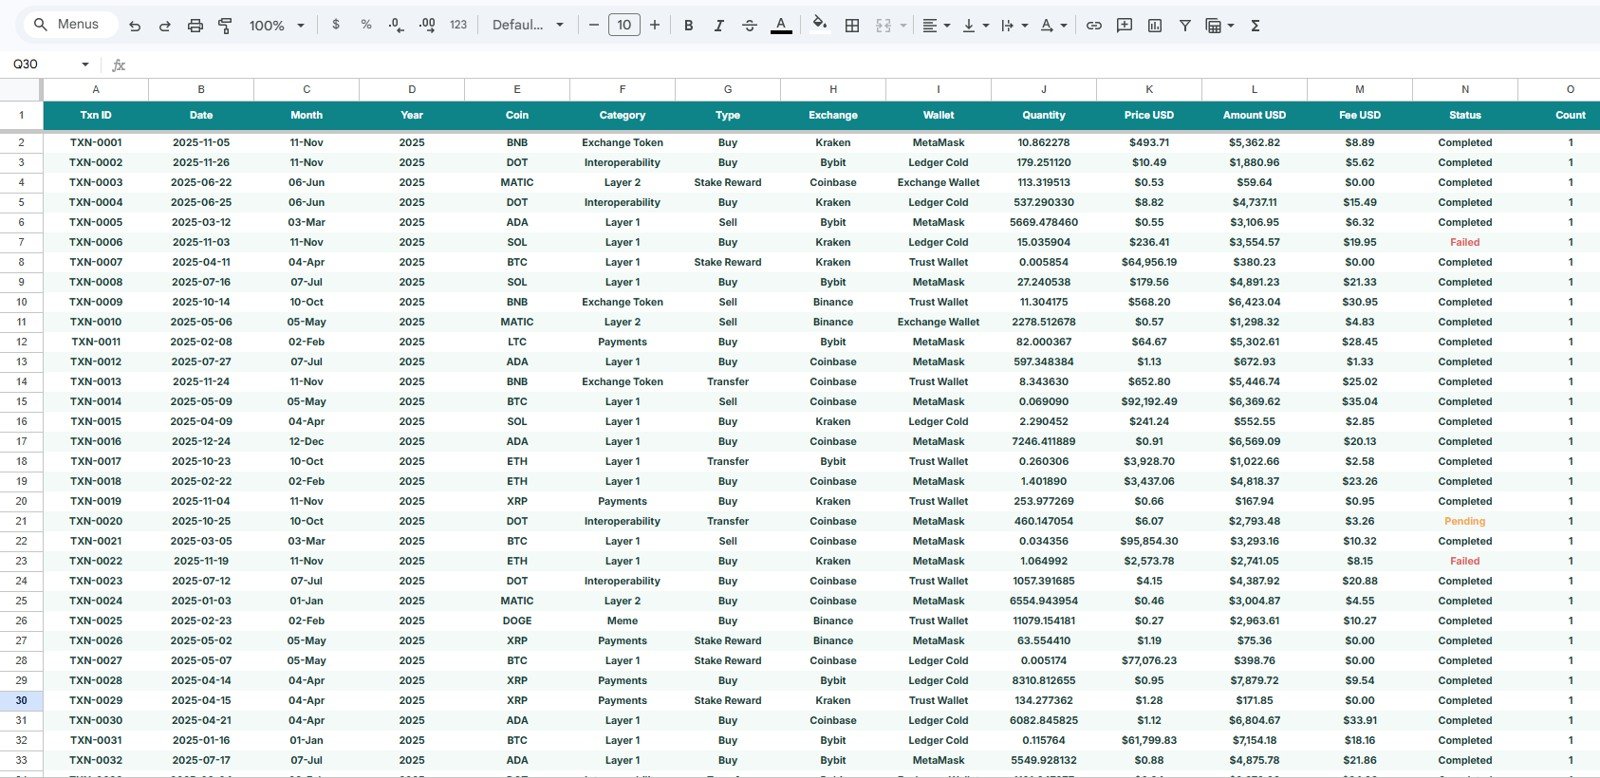
The Data Sheet tab is the source table for the dashboard. Users add data in the same format as the sample records so cards, charts, slicers, and the Search Sheet continue to update correctly.
Blockchain and Cryptocurrency Dashboard in Google Sheets vs. Microsoft Excel Dashboard vs. Paid CRM/SaaS – Feature Comparison
| Feature | This Google Sheets Dashboard | Microsoft Excel Dashboard | Paid Crypto SaaS |
|---|---|---|---|
| Cost | $9.99 one-time sale price | One-time template or manual build | Usually recurring subscription |
| Platform | Google Sheets in Drive | Excel desktop or web | Vendor-hosted web app |
| Setup time | Copy file, paste records, use slicers | Open file or build charts manually | Create account and configure sources |
| Real-time team collaboration | Google Sheets sharing | Depends on Microsoft 365 setup | Depends on provider and plan |
| Mobile access | Google Sheets app or browser | Excel mobile app or browser | Usually available through provider app |
| Customizable fields | Edit coins, wallets, exchanges, categories, and statuses | Editable if workbook is unlocked | Often limited by provider schema |
| Share with link | Yes, through Drive permissions | Yes, through Microsoft sharing | Usually account based |
| Year-1 cost at 5 users | $9.99 before any Google Workspace costs | Template cost plus any Microsoft licensing | Varies by provider and plan |
| Transaction search | Included | Requires formula or filter setup | Usually included but less editable |
| Market trend charts | BTC, ETH, average price, and stake rewards | Requires similar chart setup | May include live pricing depending on provider |
Who Should Use This Template
This template is useful for retail crypto investors, Web3 founders, finance analysts, treasury teams, crypto accounting consultants, and spreadsheet users who want a clear dashboard without connecting exchange accounts. It is also useful for teams that need a client-friendly or management-friendly summary of crypto activity.
It is not a replacement for exchange connectivity, crypto tax filing, custody monitoring, automated wallet screening, or institutional compliance tools. Treat it as a flexible reporting workbook, not a live trading or tax platform.
Real-World Use Cases
Blockchain and Cryptocurrency Dashboard in Google Sheets.
Aarav, a personal crypto investor: uses the Overview and Portfolio pages each weekend to review whether his net position is growing and which coin categories dominate his allocation.
Maya, a Web3 finance analyst: checks the Transactions page before monthly reporting so she can explain exchange volume, transaction status, and monthly fee changes.
Daniel, a crypto bookkeeping consultant: uses the Search Sheet to locate transaction IDs quickly when reconciling records for clients.
Advantages of Blockchain and Cryptocurrency Dashboard in Google Sheets
- Editable structure: You can adapt fields, categories, and labels to match your workflow.
- Cloud access: Google Sheets lets you work from a browser or mobile app and share with trusted users.
- Clear visual flow: The dashboard separates overview, portfolio, transactions, market trends, search, and source data.
- No exchange login required: You control what data goes into the file.
- One-time cost: The template does not require a recurring dashboard subscription.
Opportunities for Improvement
The main limitation is that this is a manual dashboard. Users who need live exchange API sync, automated coin pricing, tax-lot calculations, or wallet-level on-chain monitoring should use a specialist crypto platform alongside the spreadsheet.
Another improvement area is data discipline. The dashboard works best when transaction records are entered in a consistent format, with clean coin names, category values, exchange names, wallet labels, and status values.
Best Practices
- Keep a backup copy before making heavy customization changes.
- Use consistent transaction IDs so the Search Sheet lookup stays reliable.
- Standardize category, wallet, exchange, and status values before pasting large datasets.
- Review fees monthly to catch unusual transaction cost spikes.
- Use Google Drive permissions carefully when sharing sensitive portfolio data.
For general spreadsheet editing, formatting, and sharing help, refer to Google’s official Google Sheets Help guide.
Explore Relevant Templates
You may also like Crypto Portfolio Dashboard in Google Sheets, Crypto Portfolio Tracker in Google Sheets, Blockchain & Cryptocurrency Report in Excel, and Blockchain & Cryptocurrency Dashboard in Power BI.
If you want to get comfortable building dashboards like this yourself, the Excel Pivot Tables & Dashboards course on NextGenTemplates Academy walks through the approach with practice files.
Get the Blockchain and Cryptocurrency Dashboard
Frequently Asked Questions
Blockchain and Cryptocurrency Dashboard in Google Sheets.
Does the Blockchain and Cryptocurrency Dashboard in Google Sheets connect to crypto exchanges?
No. It is a manual Google Sheets dashboard. You enter or paste transaction records into the Data Sheet tab.
What dashboard pages are included?
The file includes Overview, Portfolio, Transactions, Market Trends, Search Sheet, and Data Sheet tabs.
Can I track multiple coins?
Yes. You can add multiple coins to the data sheet and use charts and slicers to review coin-level activity.
Can I customize categories and wallet labels?
Yes. You can edit the values in your copied Google Sheet as long as the source data format remains consistent.
Is this template suitable for crypto tax filing?
No. It can help organize records, but it is not tax software and does not provide tax advice.
Can my team collaborate on this dashboard?
Yes. After copying it into Google Drive, you can share it through standard Google Sheets permissions.
About the Author
Built by PK – Microsoft Certified Professional with 15+ years of Excel, Google Sheets, and Power BI experience. Founder of NextGenTemplates, reaching 300K+ subscribers across YouTube channels. Every template is hand-built and tested before release.
Conclusion
The Blockchain and Cryptocurrency Dashboard in Google Sheets gives crypto users a practical way to turn transaction rows into portfolio, fee, wallet, exchange, and market trend insights. It is best for people who want an editable spreadsheet dashboard, a searchable transaction record, and a one-time purchase instead of another recurring tool.
Get the template here: Blockchain and Cryptocurrency Dashboard in Google Sheets.