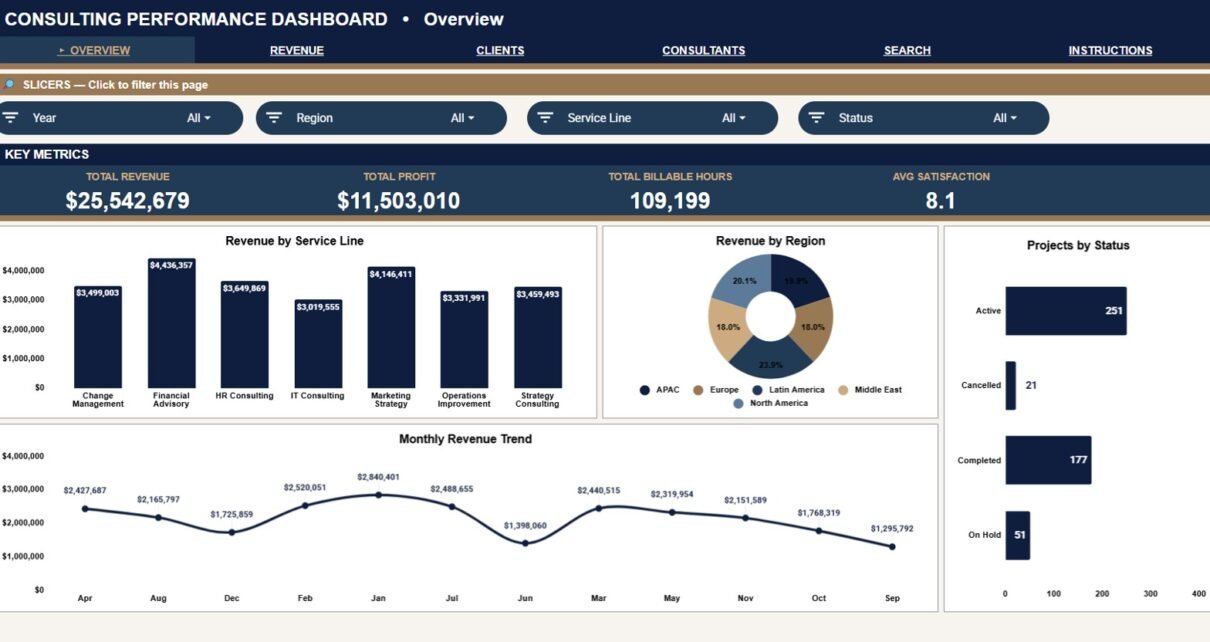
Review the Consulting Performance Dashboard in Google Sheets for revenue, profit, billable hours, client analysis, consultant performance, Project ID lookup, and data sheet reporting.
Tag: Business Analytics Google Sheets
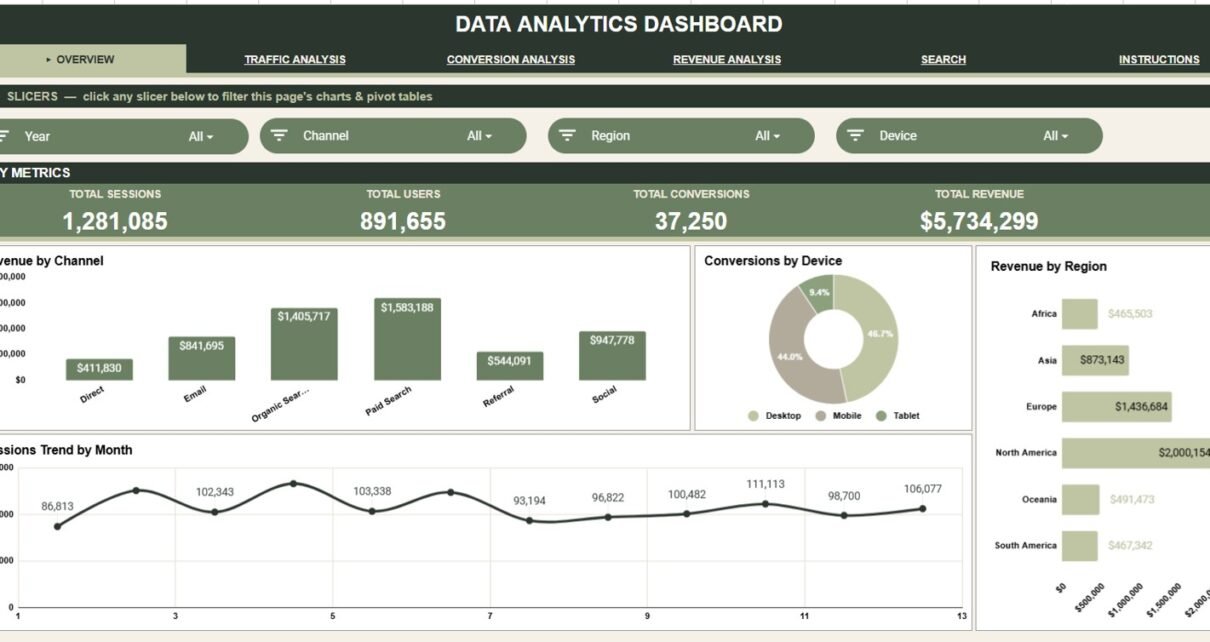
Data Analytics Dashboard in Google Sheets Template
Track sessions, users, conversions, revenue, cost, channels, devices, campaigns, regions, and categories with this editable Data Analytics Dashboard in Google Sheets.
Business Development Performance Dashboard in Google Sheets
Track pipeline value, deal stages, sales reps, lead sources, win rate, regions, and monthly trends with this Business Development Dashboard in Google Sheets.
Drop Shipping Dashboard in Google Sheets
Track your dropshipping KPIs with the Drop Shipping Dashboard in Google Sheets. Monitor revenue by channel, category, country, and supplier across 6 interactive tabs with 10+ charts and interactive slicers.
Event Management KPI Scorecard In Google Sheets
Event management has evolved significantly in recent years. Today, organizers must track performance, monitor budgets, evaluate attendee satisfaction, and measure event success using data-driven insights. However, many event teams still rely on manual spreadsheets and scattered reports. As a result, they struggle to evaluate performance accurately and make timely improvements. Therefore, organizations increasingly adopt structured […]
Food and Beverage Dashboard in Google Sheets
The food and beverage industry operates in a fast-moving and highly competitive environment. Businesses must continuously monitor production, sales performance, inventory availability, costs, and profitability. However, many organizations still rely on disconnected spreadsheets and manual reports. As a result, managers struggle to gain real-time insights and make timely decisions. Therefore, businesses increasingly adopt centralized analytics […]
Electronics KPI Scorecard in Google Sheets
In today’s competitive electronics industry, companies must track performance with accuracy and speed. However, many businesses still rely on scattered spreadsheets and manual reports. As a result, managers struggle to monitor sales, production efficiency, inventory movement, and profitability in one place. Therefore, organizations need a centralized and dynamic KPI monitoring system. More importantly, they need […]