AI programs are no longer side experiments. According to the Stanford HAI 2026 AI Index Report, U.S. private AI investment reached $285.9 billion in 2025, which makes clear tracking more important for teams managing AI projects, model runs, compute costs, requests, and adoption.
The Artificial Intelligence AI Dashboard in Google Sheets is built for that reporting need. It gives AI teams, founders, analysts, engineers, product leaders, and operations managers a ready-made workspace for monitoring projects, model performance, GPU usage, cost trends, team workload, platform usage, and run-level details in one editable spreadsheet dashboard.
Because it is designed in Google Sheets, the template is easy to share, filter, customize, and review without a complex BI setup. Teams can use slicers, charts, KPI cards, and structured data tabs to turn everyday AI operations data into clear decisions.
Get the Artificial Intelligence AI Dashboard in Google Sheets
Key Features of Artificial Intelligence AI Dashboard in Google Sheets
- AI operations dashboard: Track AI projects, runs, model types, engineers, departments, platforms, requests, accuracy, GPU hours, and cost.
- Executive overview page: Review total projects, completed runs, assigned runs, team members, work progress, GPU time, monthly results, and current project metrics.
- Model performance analytics: Compare average accuracy, requests, model types, monthly trends, and run status distribution.
- Compute and cost reporting: Monitor cost by project, platform spend, GPU hours, and monthly compute movement.
- Team and project tracking: Understand runs by engineer, project workload, run priority, and monthly run status.
- Adoption and usage tracking: Analyze requests by project, platform, department, and month to identify where AI usage is growing.
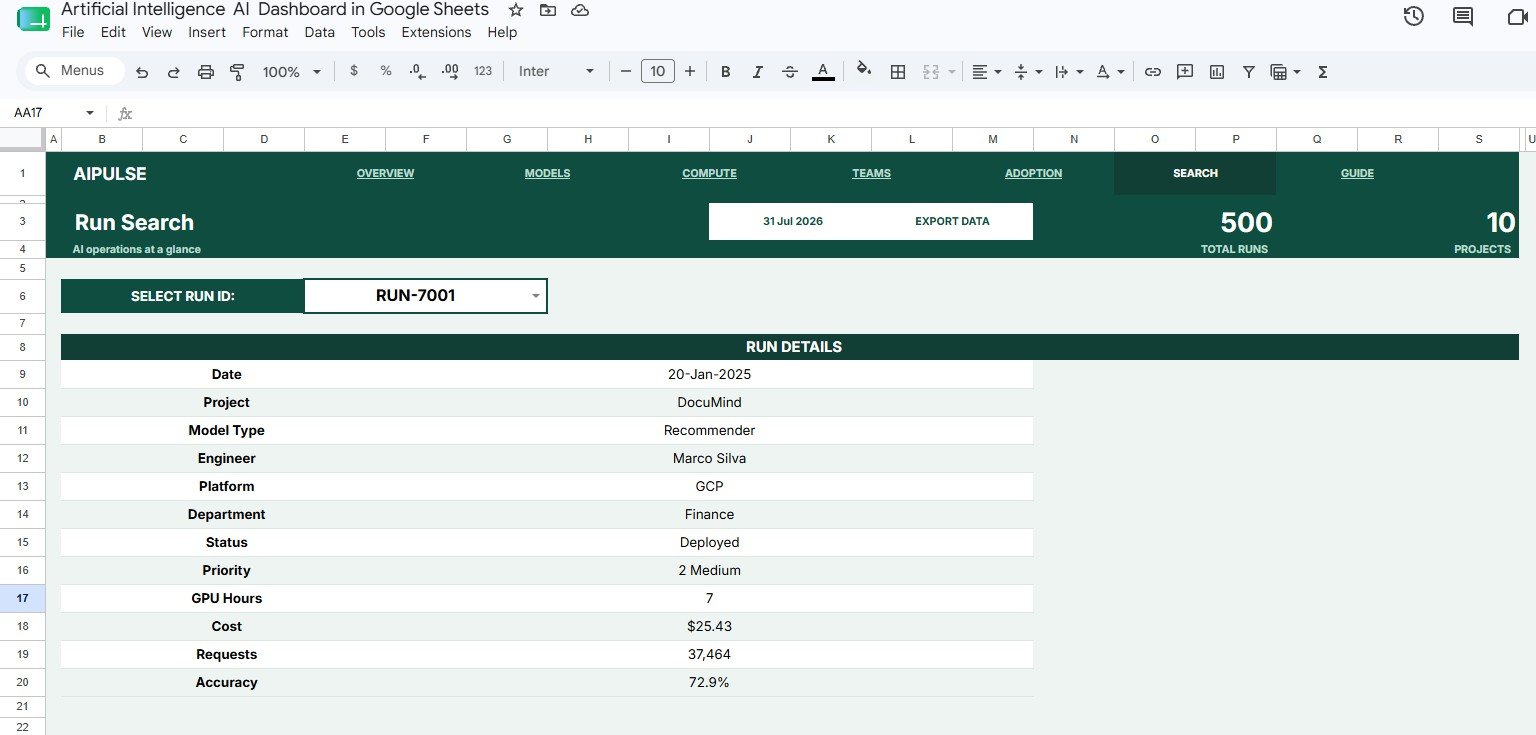
- Search sheet: Select a Run ID and instantly view the related Date, Project, Model Type, Engineer, Platform, Department, Status, Priority, GPU Hours, Cost, Requests, and Accuracy.
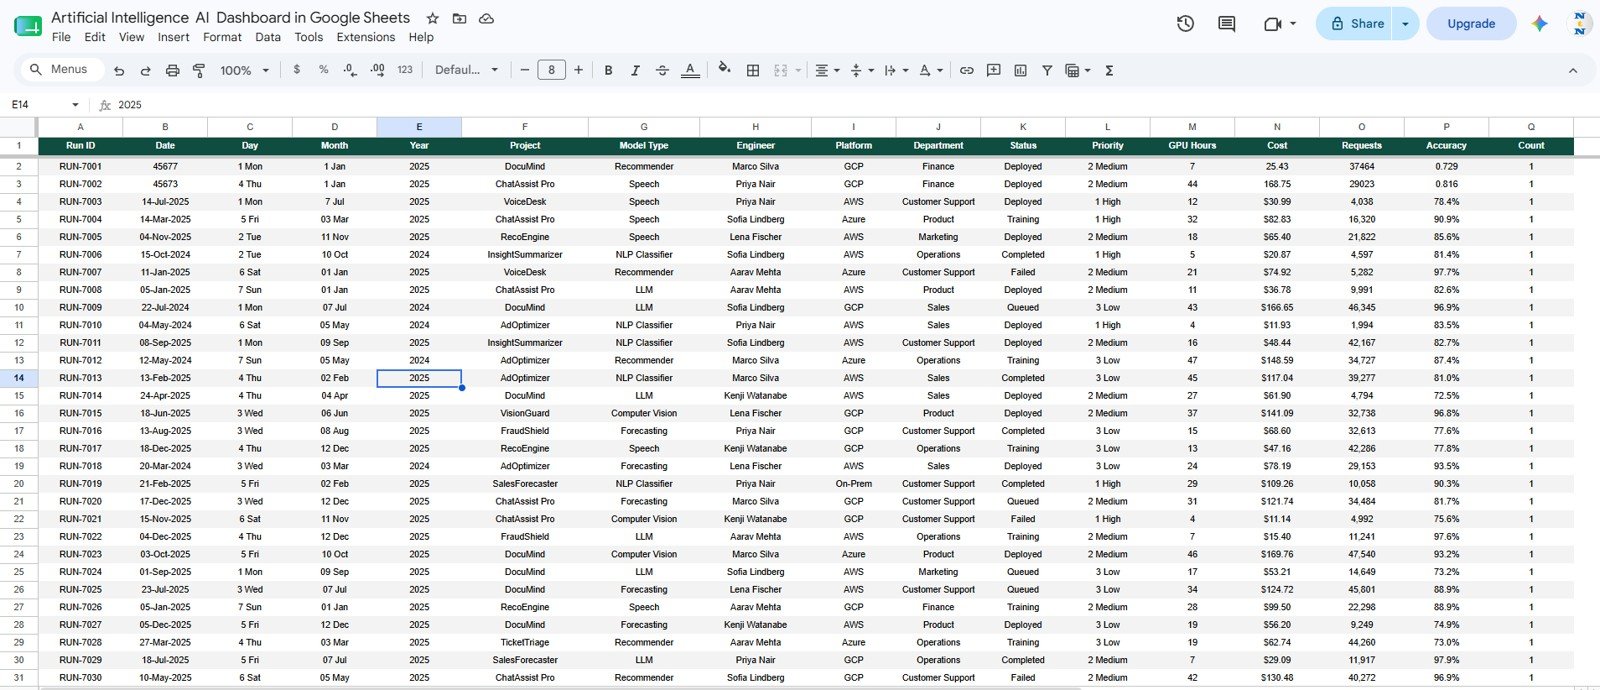
- Data sheet: Maintain the source data in the same structured format used by the dashboard charts and filters.
Dashboard Pages Explanation
Overview Page
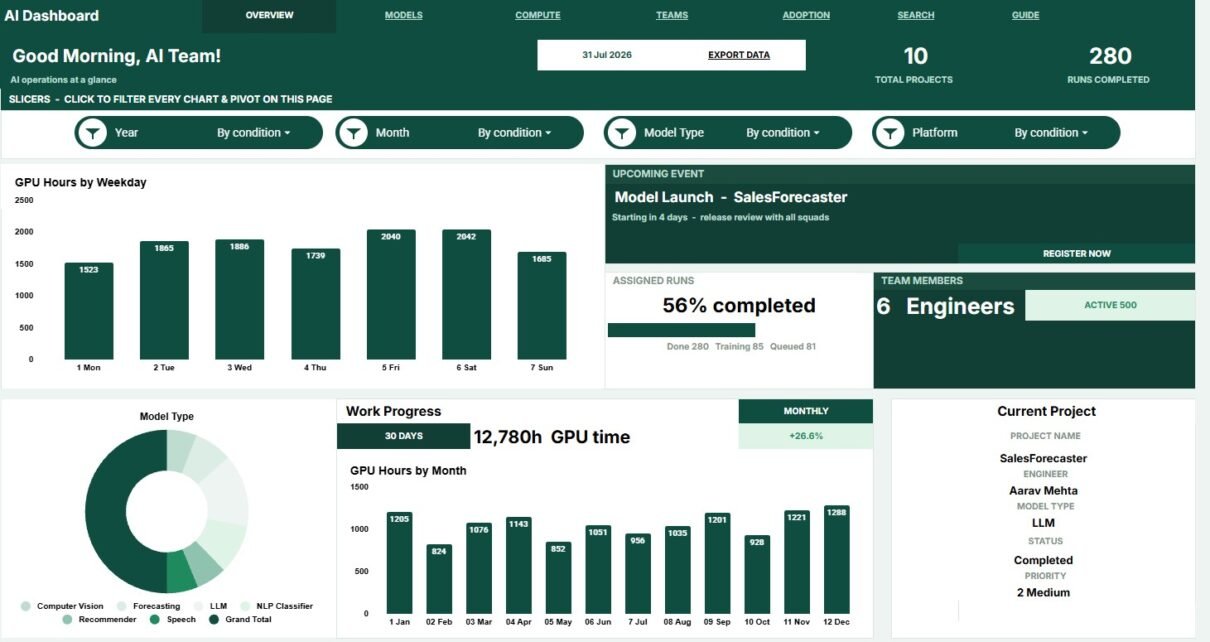
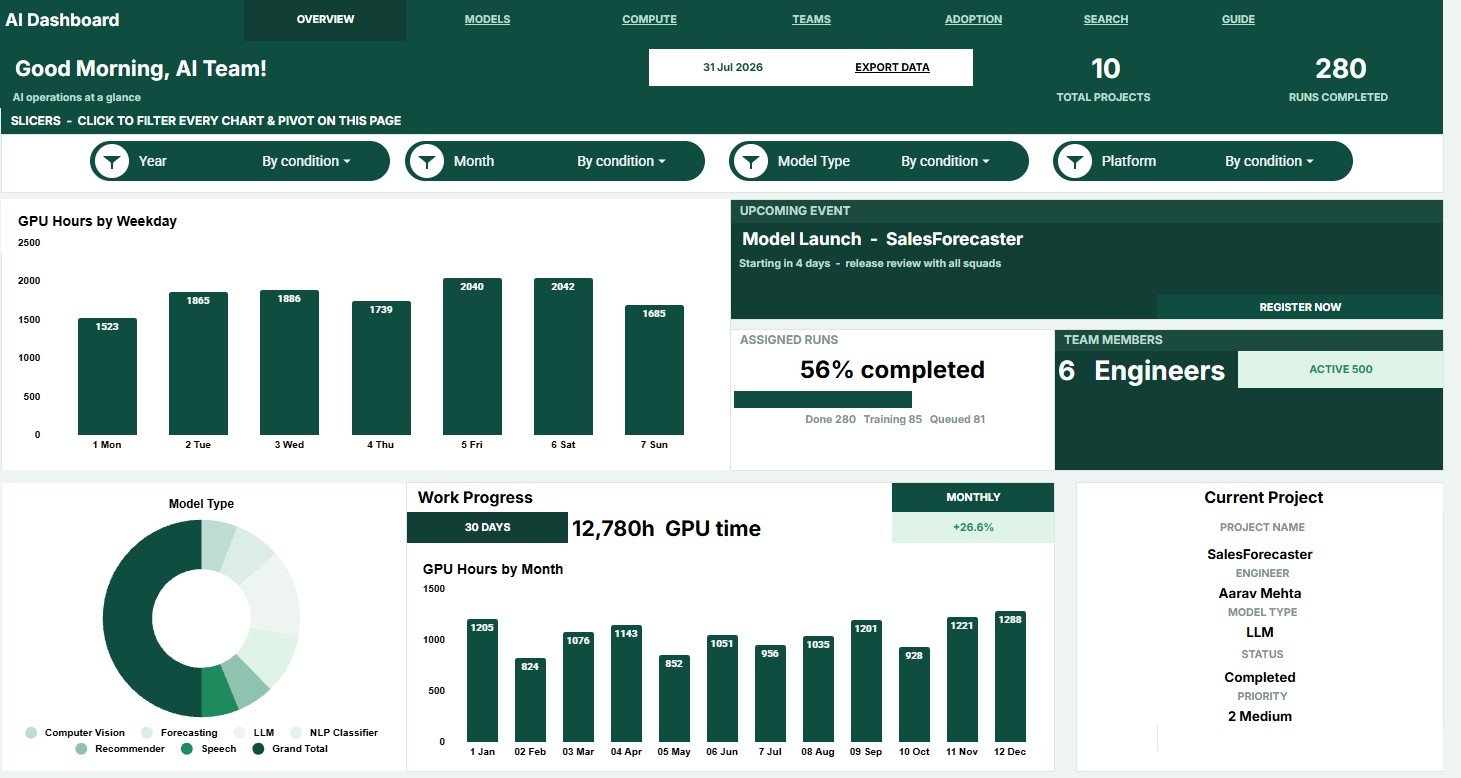
The Overview page gives a high-level snapshot of AI project activity and performance. It includes KPI cards for Total Projects, Runs Completed, Assigned Runs, Team Members, Work Progress, GPU Time, Monthly, and Current Project.
Multiple slicers help users filter the dashboard quickly by key fields, so leaders can review the same AI portfolio from different angles without editing formulas.
- GPU Hours by Weekday: Shows which weekdays consume the most GPU time across AI runs. Use it to spot heavy compute days and plan resource allocation before queues become a bottleneck.
- Assigned Runs by Status: Breaks assigned runs into status groups such as completed, pending, or in progress. This helps teams see whether AI work is moving steadily or getting stuck in specific workflow stages.
- Projects by Model Type: Compares how many projects use each model type. It helps identify whether the team is concentrated around a few AI models or spreading work across different model categories.
- GPU Hours by Month: Tracks monthly GPU consumption over time. This is useful for budgeting, capacity planning, and explaining cost changes during monthly reviews.
- Current Project Details by Project: Summarizes current project metrics at the project level. It gives managers a fast way to compare active AI initiatives and decide where follow-up is needed.
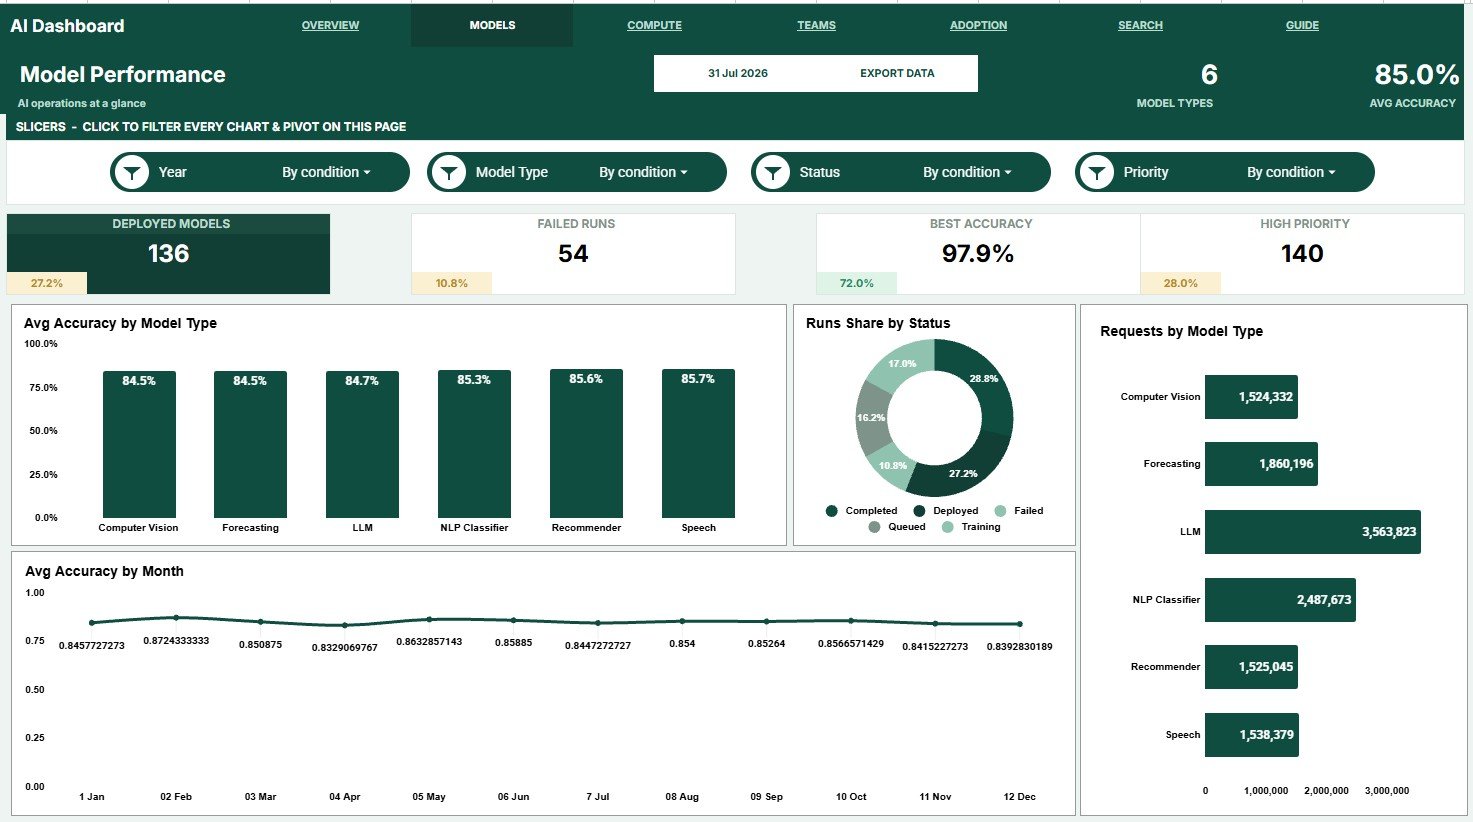
Model Performance
The Model Performance page focuses on AI quality, model mix, requests, and status patterns. It is useful for teams that want to review not just how much AI work is happening, but how well the models are performing.
- Avg Accuracy by Model Type: Compares average accuracy across model categories. Use it to identify which model types are producing stronger performance and which may need tuning.
- Runs Share by Status: Shows the proportion of AI runs by status. This helps explain whether most runs are completed, pending, blocked, or still active.
- Requests by Model Type: Measures request volume across different model types. It helps teams understand demand patterns and decide which models need more support or optimization.
- Avg Accuracy by Month: Tracks average accuracy trends over time. This makes it easier to see whether model performance is improving, declining, or staying stable month by month.
Compute and Costs
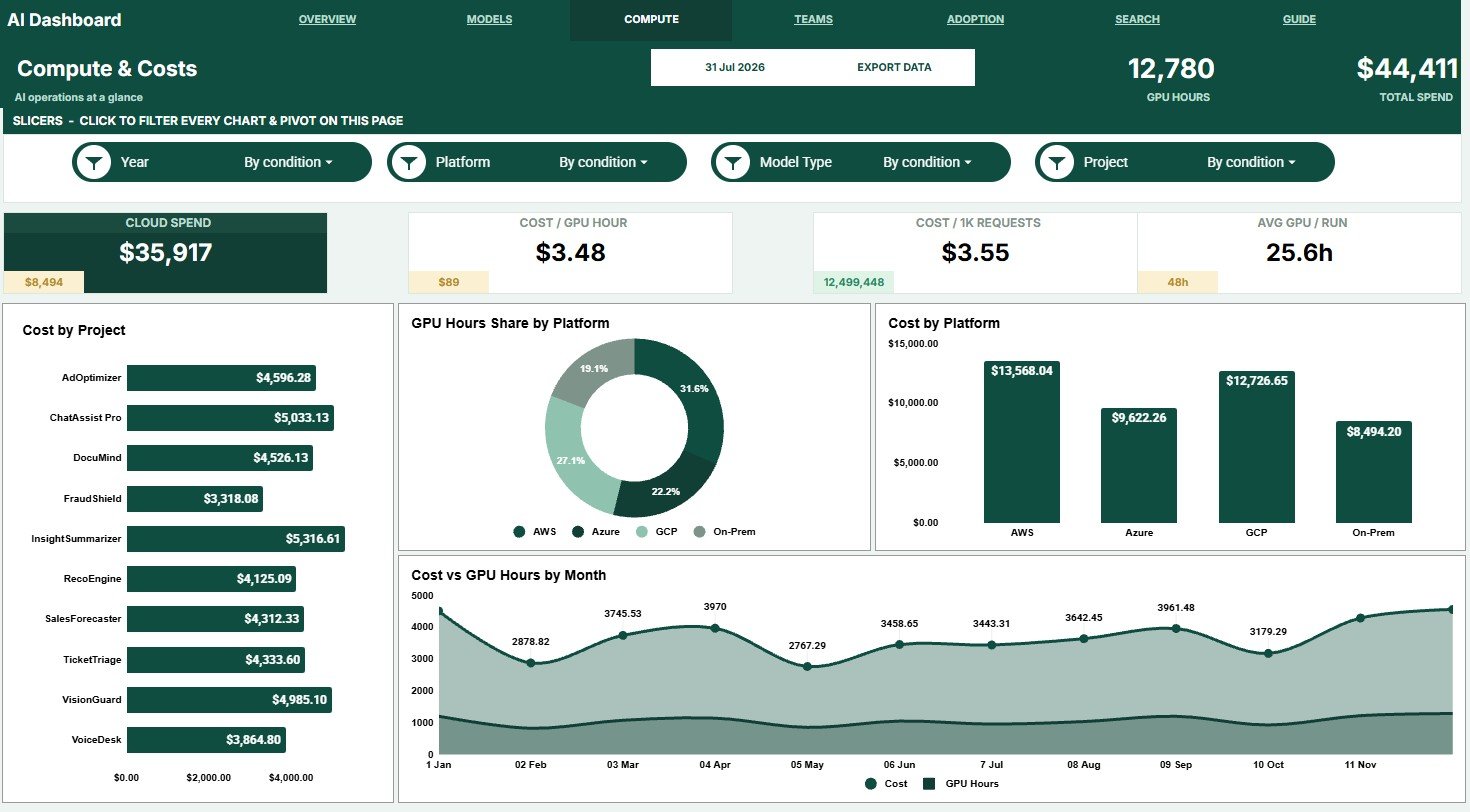
The Compute and Costs page helps AI teams connect technical workload with financial impact. It gives a practical view of how GPU time, platforms, projects, and monthly usage translate into cost.
- Cost by Project: Shows which projects are responsible for the highest AI costs. This helps managers review ROI and decide where spend needs closer control.
- GPU Hours Share by Platform: Displays how GPU time is distributed across platforms. It helps teams understand platform dependency and whether compute load is balanced.
- Cost by Platform: Compares spending across AI platforms or infrastructure providers. Use it to identify high-cost platforms and support vendor or budget discussions.
- Cost and GPU Hours by Month: Places monthly cost and GPU hours together in one trend view. This makes it easier to see whether spend is rising because of more usage, higher rates, or both.
Teams and Projects
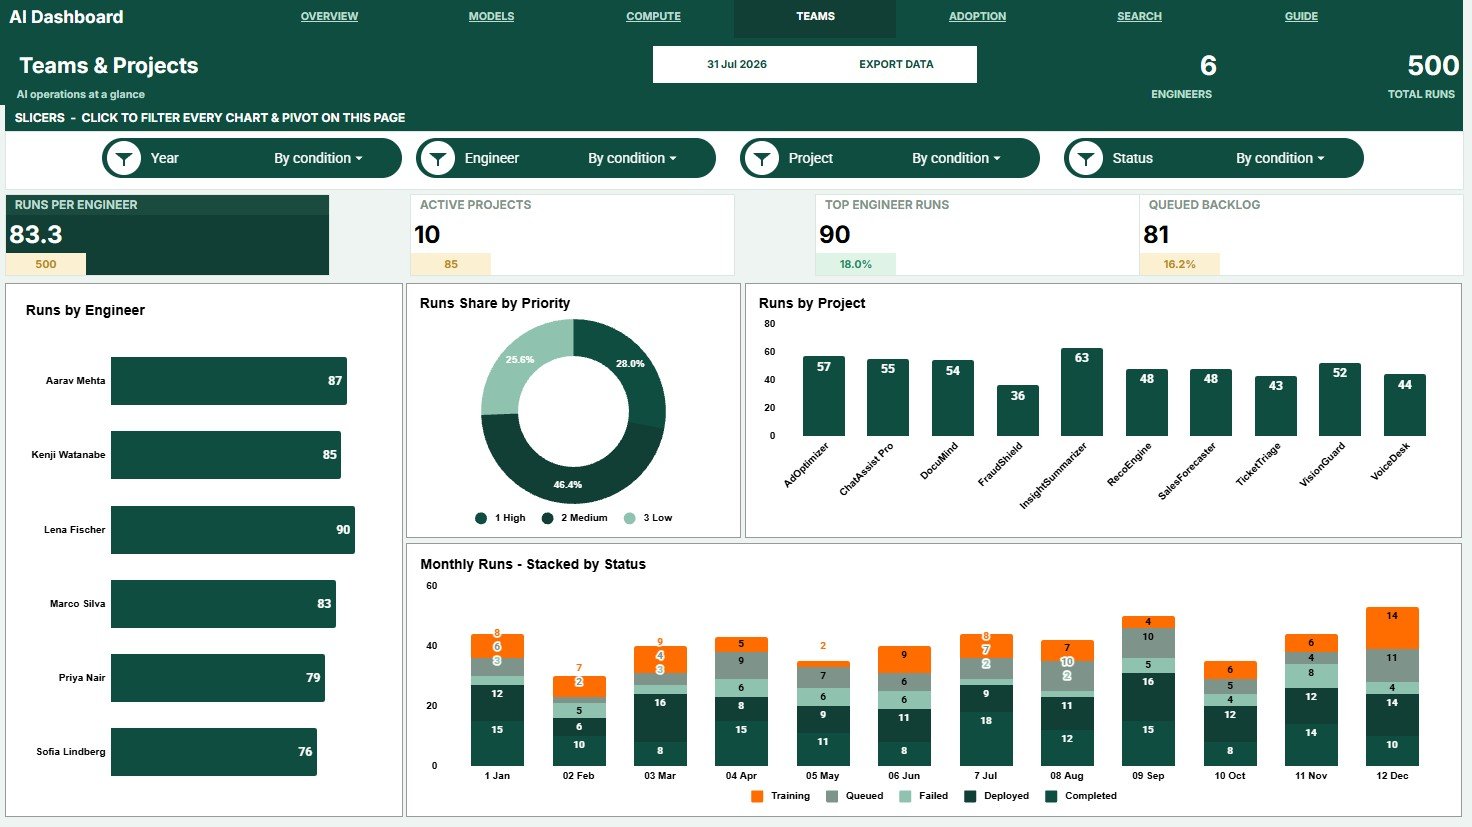
The Teams and Projects page is designed for workload and ownership analysis. It helps managers see who is handling runs, which projects are active, and how priorities are distributed.
- Runs by Engineer: Shows AI run volume assigned to each engineer. This helps balance workload and recognize where capacity may be stretched.
- Runs Share by Priority: Breaks runs into priority levels. It helps teams see whether urgent work is dominating the queue or whether priorities are balanced.
- Runs by Project: Compares run volume across AI projects. This makes it easy to identify the most active projects and where resources are being consumed.
- Monthly Runs by Status: Tracks run status by month. It helps teams review operational flow and spot months where completion rates or backlog changed.
Adoption and Usage
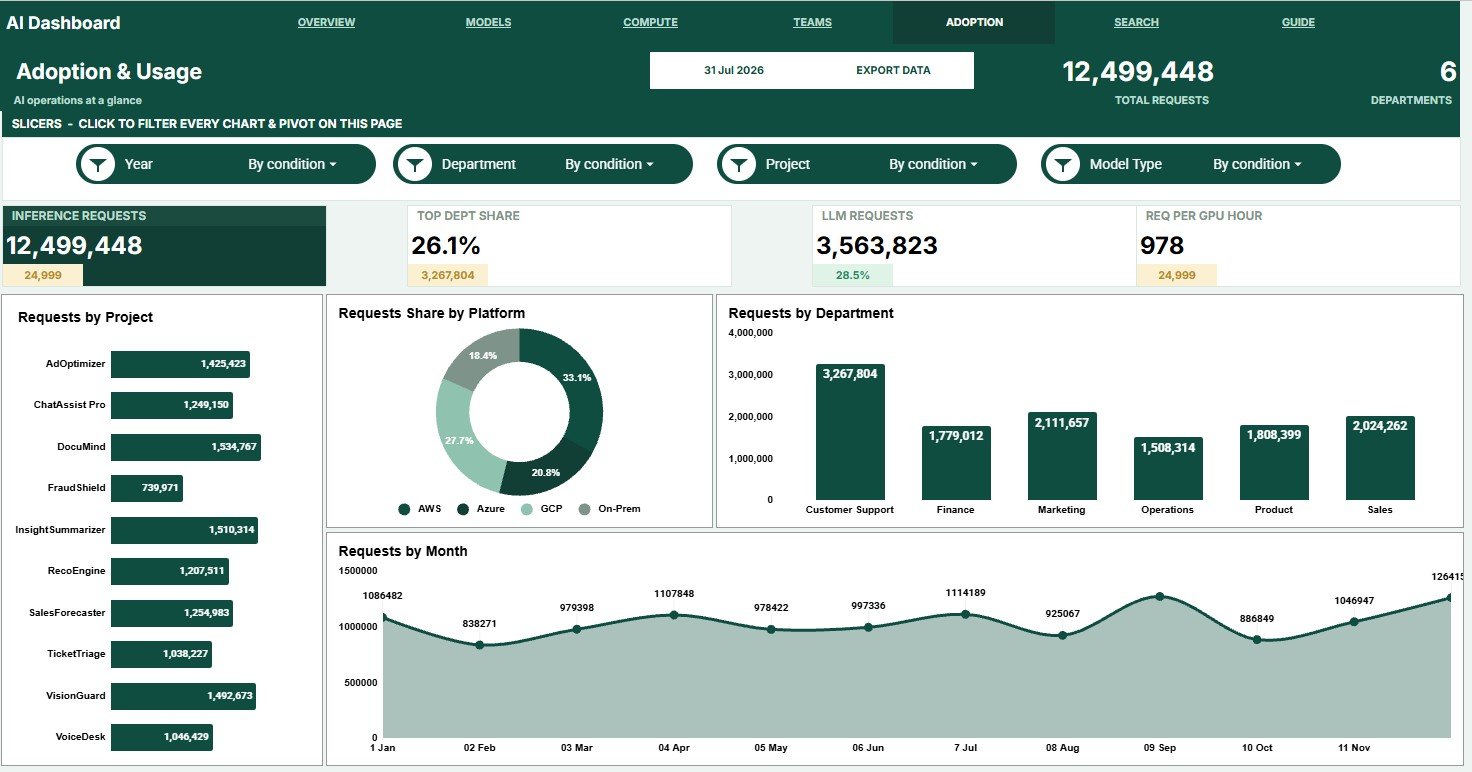
The Adoption and Usage page shows how AI is being used across the organization. It is useful for AI enablement teams, operations managers, and leaders who need to understand demand by project, department, platform, and month.
- Requests by Project: Shows request volume for each AI project. It helps identify which projects are driving the most demand and where additional support may be needed.
- Requests Share by Platform: Breaks request volume into platform share. This helps teams see which AI tools or platforms are used most often.
- Requests by Department: Compares AI request activity across departments. It is useful for adoption tracking, training plans, and internal AI enablement reporting.
- Requests by Month: Tracks request volume over time. This helps leaders see whether AI adoption is increasing, seasonal, or slowing down.
Search Sheet Tab
The Search Sheet tab is built for quick lookup. Users can select a Run ID and instantly view important run details including Date, Project, Model Type, Engineer, Platform, Department, Status, Priority, GPU Hours, Cost, Requests, and Accuracy.
This sheet is especially helpful when managers or analysts need to investigate a single AI run without scrolling through the full data table.
Data Sheet Tab
The Data Sheet tab stores the structured source records used by the dashboard. Users can add AI run data in the same format, including project, model type, engineer, platform, department, status, priority, GPU hours, cost, requests, and accuracy.
Keeping this tab consistent is the key to accurate dashboard results. When the data is updated in the same format, the charts and KPI views stay useful for recurring reporting.
Artificial Intelligence AI Dashboard in Google Sheets vs. Microsoft Excel Dashboard vs. Paid AI/ML SaaS – Feature Comparison
| Feature | Google Sheets AI Dashboard | Microsoft Excel Dashboard | Paid AI/ML SaaS |
|---|---|---|---|
| Ease of sharing | Strong for cloud collaboration | Good, especially with OneDrive | Usually strong, but account-based |
| Setup time | Fast copy-and-use workflow | Fast if the team already uses Excel | Can require onboarding and configuration |
| Customization | Easy to edit tabs, formulas, charts, and fields | Highly customizable | Often limited by plan or admin settings |
| Cost | Low one-time template cost | Depends on Microsoft 365 access | Usually subscription based |
| Best fit | AI teams needing fast, editable reporting | Teams working heavily in Excel | Advanced ML operations at scale |
Who Should Use This Template
This template is useful for AI project teams, machine learning operations teams, founders, CTOs, data analysts, product managers, engineering managers, AI consultants, agencies, and business teams that need a practical way to monitor AI work.
It is especially helpful for teams that want dashboard visibility without building a full database, custom app, or paid analytics stack. If your AI tracking currently lives in scattered sheets, chats, notebooks, or status updates, this dashboard can create a more consistent reporting system.
Real-World Use Cases
- Weekly AI project review: Review total projects, completed runs, assigned runs, GPU usage, and current project status.
- Model quality reporting: Track average accuracy by model type and month to support model improvement decisions.
- Compute budget monitoring: Compare GPU hours and cost by project, platform, and month.
- Team workload planning: Review runs by engineer and priority to distribute work more fairly.
- AI adoption tracking: Measure requests by department, project, platform, and month.
- Run-level investigation: Use the Search Sheet tab to look up one Run ID and review all related details quickly.
Advantages of Artificial Intelligence AI Dashboard in Google Sheets
- Cloud-first collaboration: Share the dashboard with stakeholders through Google Sheets permissions.
- No heavy setup: Start with a ready-made structure instead of building charts from scratch.
- Clear management views: Use KPI cards, slicers, and charts to support fast review meetings.
- Editable data model: Add or adjust columns based on your AI reporting process.
- Better cost visibility: Connect GPU hours, platform usage, and project activity with cost trends.
- Useful for recurring reporting: Update the Data Sheet tab and refresh the same dashboard views over time.
Opportunities for Improvement
The dashboard is designed as a flexible reporting template, so accuracy depends on the quality and consistency of the data entered into the Data Sheet tab. Teams should define standard names for projects, platforms, engineers, departments, statuses, and priorities before using it for recurring reporting.
For advanced production ML environments, teams may eventually connect spreadsheet reporting with automated exports from experiment tracking tools, cloud billing systems, or internal databases. The Google Sheets dashboard remains useful as a management layer, but deeper automation may be needed for large enterprise AI operations.
Best Practices
- Use one consistent Run ID format so the Search Sheet tab works cleanly.
- Update project, model type, engineer, platform, department, status, and priority fields consistently.
- Review GPU hours and cost together so compute growth is visible before it affects budget.
- Use slicers during meetings to answer project, platform, department, and status questions quickly.
- Compare accuracy trends with request volume so quality and demand are reviewed together.
- Keep an archived copy before making major structural changes to formulas or dashboard layouts.
Explore Relevant Templates
- Artificial Intelligence Ethics KPI Dashboard in Google Sheets
- Technology Dashboard in Google Sheets
- Training and Development Dashboard in Google Sheets
- AI Governance KPI Dashboard in Power BI
- Augmented Analytics Dashboard in Power BI
If you want to build reports like this yourself, the Excel Pivot Tables & Dashboards course on NextGenTemplates Academy covers the full workflow with practice files.
Get the Artificial Intelligence AI Dashboard in Google Sheets
Frequently Asked Questions
What is the Artificial Intelligence AI Dashboard in Google Sheets?
It is a ready-made Google Sheets dashboard template for tracking AI projects, model runs, performance, GPU hours, compute costs, requests, adoption, team activity, and run-level details.
Do I need advanced Google Sheets skills to use it?
No. The template is designed for practical business users, analysts, and managers. You only need to update the Data Sheet tab in the same format and use the dashboard pages for review.
Can I customize the dashboard?
Yes. You can edit labels, formulas, charts, slicers, colors, and fields in Google Sheets to match your AI reporting process.
Can this template track GPU hours and AI costs?
Yes. The Compute and Costs page includes views for GPU hours, platform share, project cost, platform cost, and monthly cost trends.
Does the template include a search feature?
Yes. The Search Sheet tab lets users select a Run ID and instantly review the related run details, including date, project, model type, engineer, status, GPU hours, cost, requests, and accuracy.
Is this a Google Sheets template or a software subscription?
It is a Google Sheets dashboard template. It is intended for teams that want an editable spreadsheet dashboard without paying for a separate AI reporting SaaS subscription.
About the Author
NeoTechNavigators shares practical technology templates, dashboard walkthroughs, and workflow resources for teams that want clearer reporting without unnecessary complexity. For dashboard tutorials and related guides, visit the NeoTechNavigators YouTube channel.
Conclusion
The Artificial Intelligence AI Dashboard in Google Sheets gives teams a practical way to monitor AI project work, model performance, compute usage, cost, team activity, adoption, and run details in one editable workbook. It is a strong fit for teams that need clear AI reporting quickly and want to keep their reporting workflow inside Google Sheets.
Last updated: July 2026