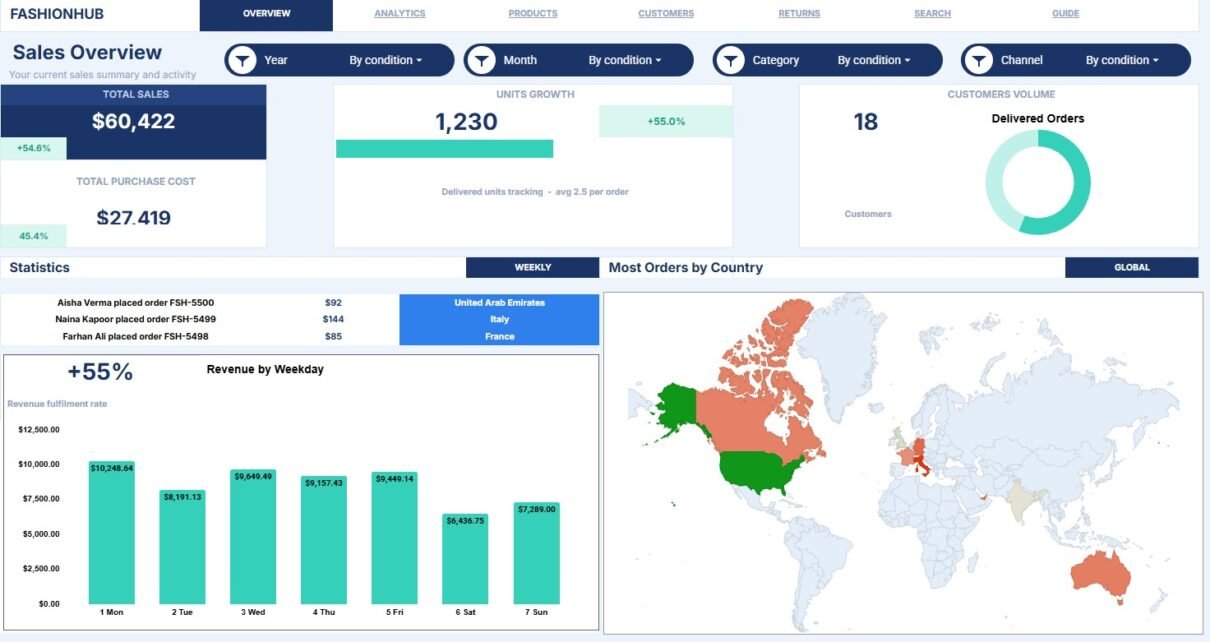
Fashion and Apparel Dashboard in Google Sheets is a ready-to-use spreadsheet template for fashion retailers, apparel sellers, boutique owners, and ecommerce teams that want order reporting without a recurring analytics subscription. The dashboard turns one structured order table into 7 working tabs, 5 headline KPI cards, 19 chart views, and a searchable Order ID lookup. Users can monitor Total Sales, Total Purchase Cost, Units Growth, Customers Volume, Delivered Orders, revenue by category, units by product, size trends, customer revenue, country performance, discounts, and order status in one Google Sheets file.Fashion and Apparel Dashboard in Google Sheets
Fashion reporting becomes difficult when sales, costs, returns, sizes, customers, and channels sit in separate exports. This template gives teams a cleaner way to paste records into a Data Sheet, review charts, and use slicers for quick filtering. Because it runs in Google Sheets, the copied file can be shared through Google Drive permissions. For users who want to adjust chart types or learn more about Google Sheets chart behavior, Google’s official Google Sheets chart help is a useful reference.
Get the Fashion and Apparel Dashboard in Google Sheets
Key Features of Fashion and Apparel Dashboard in Google Sheets
- 7 sheet tabs: Overview, Sales Analysis, Products and Sizes, Customers and Regions, Returns and Operations, Order Search, and Data Sheet.Fashion and Apparel Dashboard in Google Sheets
- 5 top KPI cards: Total Sales, Total Purchase Cost, Units Growth, Customers Volume, and Delivered Orders.Fashion and Apparel Dashboard in Google Sheets
- 19 chart views: Analyze revenue, orders, units, discounts, costs, customers, categories, countries, channels, products, statuses, sizes, and monthly trends.
- Slicer-based filtering: Apply dashboard filters quickly without editing formulas.
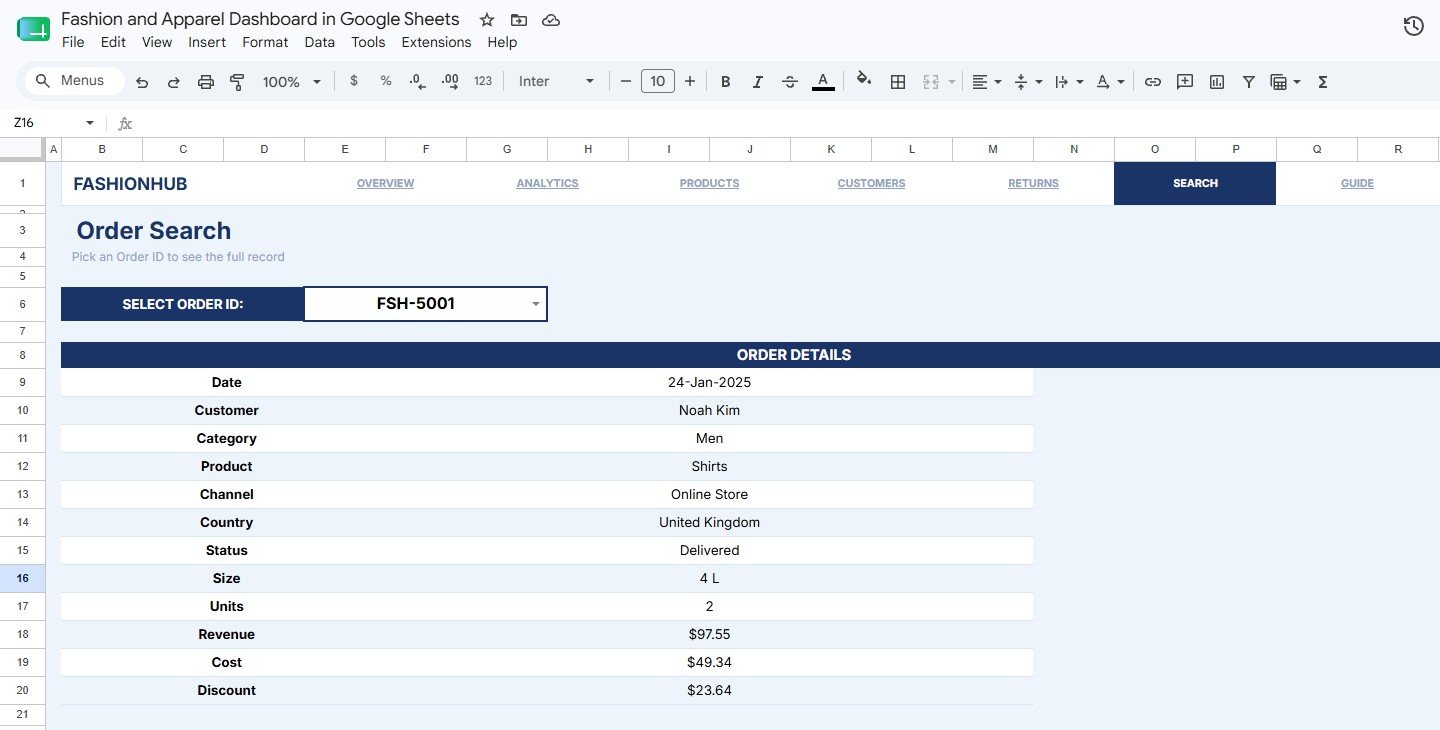
- Order Search tab: Select an Order ID from a dropdown and view the complete order record instantly.
- Editable Data Sheet: Replace sample rows with your own apparel order data in the same structure.
- One-time template workflow: Use a familiar spreadsheet before moving to expensive retail analytics software.
Dashboard Pages Explanation
1 – Overview Page
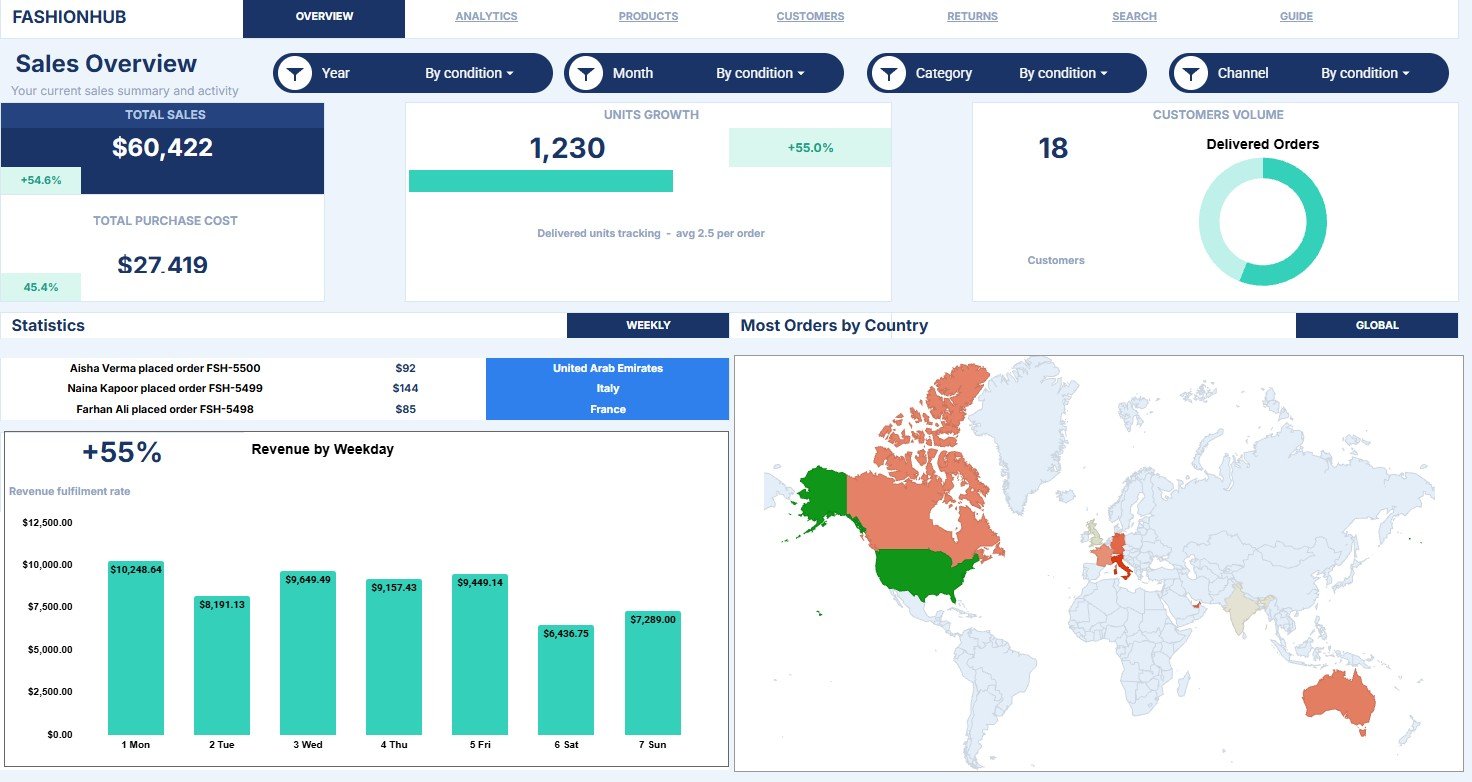
The Overview Page gives leaders a quick summary of the fashion and apparel business. The top cards show Total Sales, Total Purchase Cost, Units Growth, Customers Volume, and Delivered Orders, so users can review the business pulse before opening detailed pages.Fashion and Apparel Dashboard in Google Sheets
Revenue by Weekday: This chart shows which weekdays produce the strongest revenue. It helps teams plan launches, promotions, staffing, and campaign timing around real buying behavior.
Orders by Country: This chart compares order count across countries. It helps users identify strong regions and markets where order volume may need more attention.
Delivered Orders by Customers: This chart highlights customer delivery activity. It helps teams understand which customers are contributing to completed sales and where repeat buyer follow-up may be useful.
2 – Sales Analysis
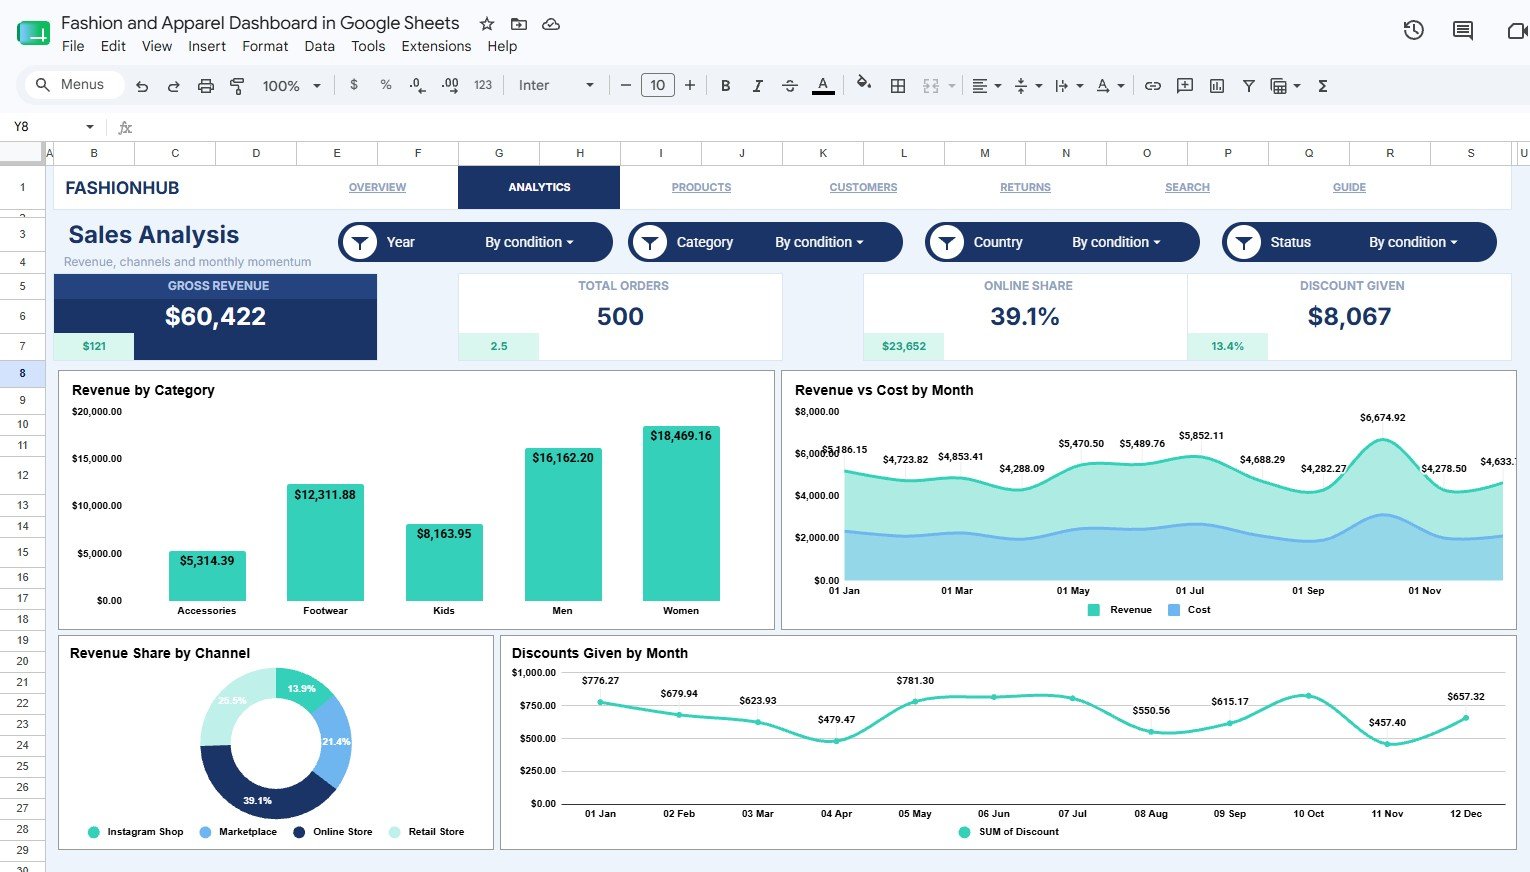
The Sales Analysis tab focuses on money movement, cost comparison, channel share, and discount behavior. It helps fashion teams understand whether revenue growth is coming from the right categories and whether discounting is becoming too heavy.Fashion and Apparel Dashboard in Google Sheets
Revenue by Category: This chart compares revenue across fashion categories. It helps users see which product groups drive the most sales value.
Revenue and Cost by Month: This chart places revenue beside purchase cost by month. It helps users see whether growth is supported by healthy cost control.
Revenue Share by Channel: This chart shows how revenue is distributed across channels. It helps compare store, ecommerce, marketplace, wholesale, or other selling routes.
Discounts Given by Month: This chart tracks monthly discount value. It helps users review whether promotions are rising, falling, or concentrated in certain periods.
3 – Products and Sizes
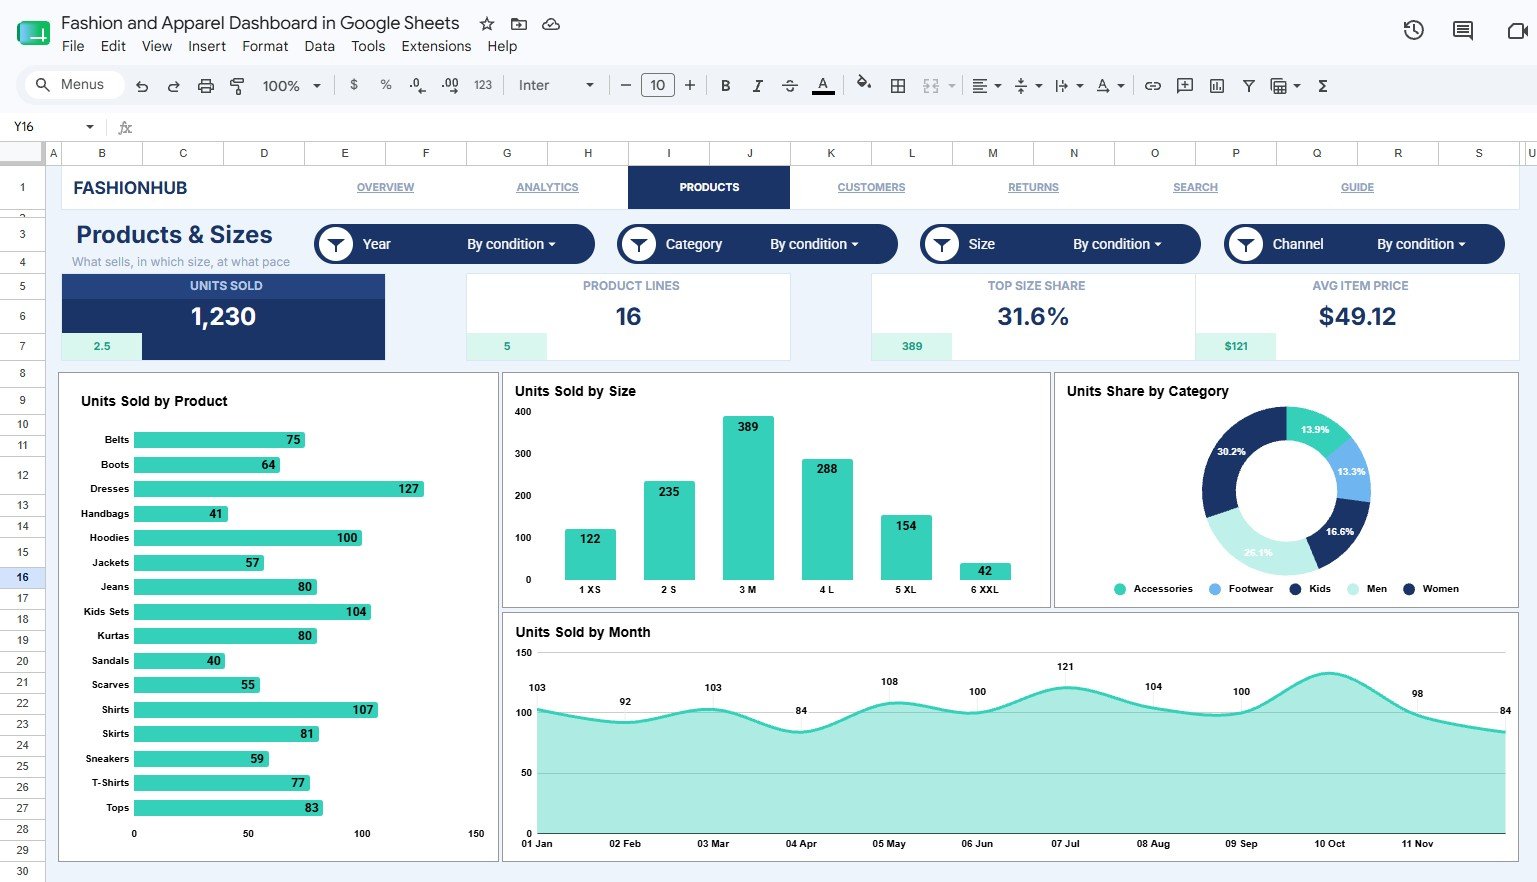
The Products and Sizes tab is built for apparel-specific analysis. It helps teams review what is selling, which sizes are moving, and whether demand is concentrated in certain categories or months.
Units Sold by Product: This chart ranks products by sold units. It helps buyers, planners, and managers identify best sellers and low movers.
Units Sold by Size: This chart compares unit sales by size. It helps apparel teams make better replenishment and size curve decisions.
Units Share by Category: This chart shows the share of sold units by category. It helps users understand whether volume is concentrated in a small set of product groups.
Units Sold by Month: This chart tracks unit movement across months. It helps reveal seasonality, demand spikes, campaign impact, and slower sales periods.
4 – Customers and Regions
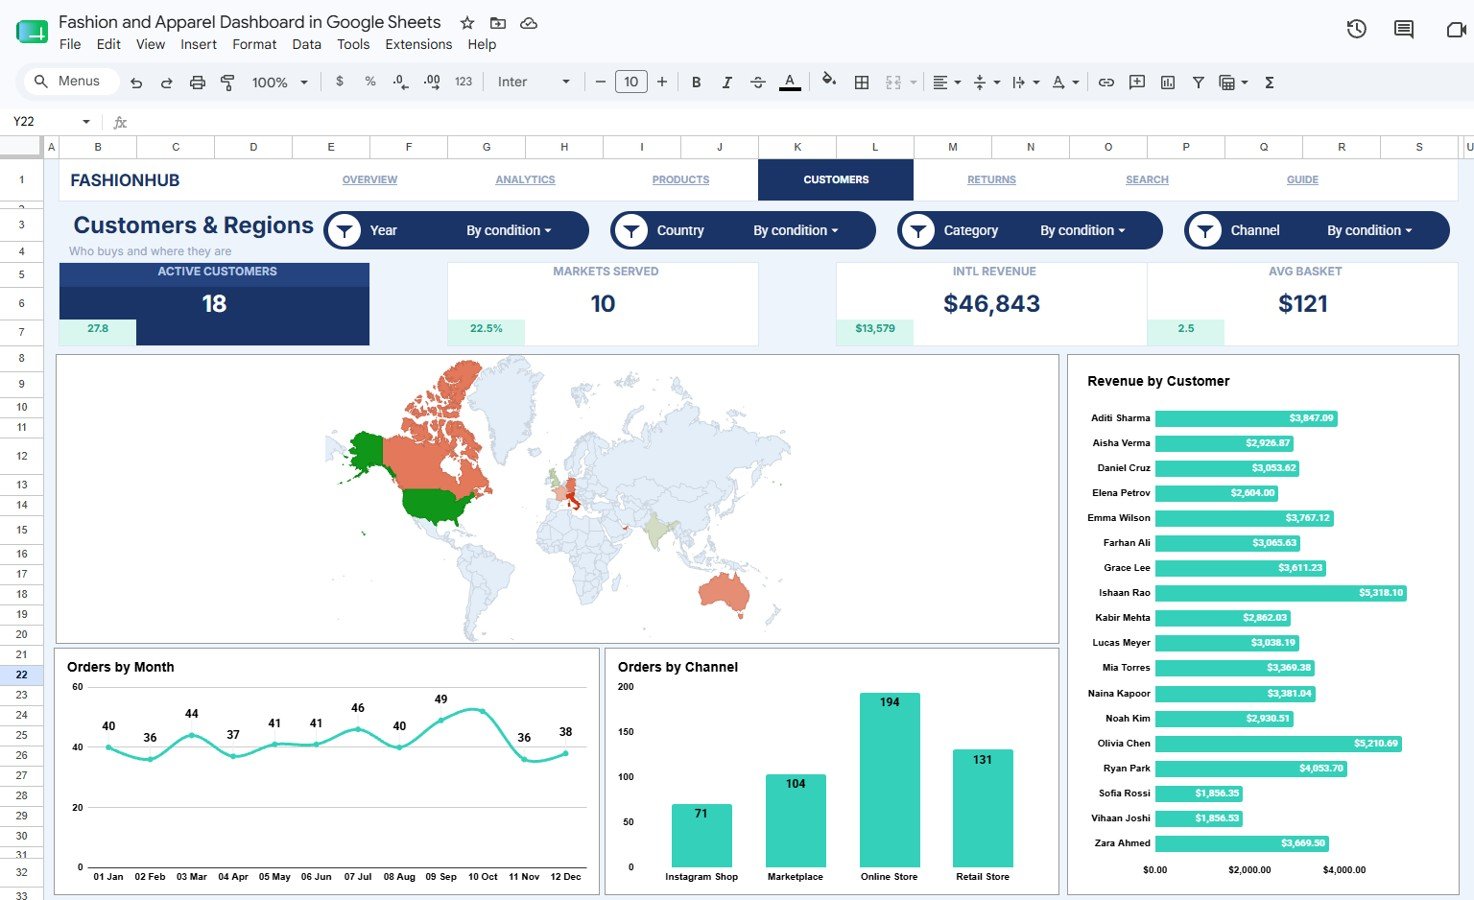
The Customers and Regions tab connects sales activity to customer and location performance. It helps users see which countries and customers generate revenue and how order volume moves by month and channel.
Revenue by Country: This chart compares revenue across countries. It helps identify markets that produce higher value, not just higher order count.
Revenue by Customer: This chart ranks customers by revenue. It helps users identify high-value buyers and review customer concentration risk.
Orders by Month: This chart shows order count by month. It helps teams see demand changes over time and compare recent performance with earlier periods.
Orders by Channel: This chart compares order count across channels. It helps users understand where customers are placing orders most often.
5 – Returns and Operations
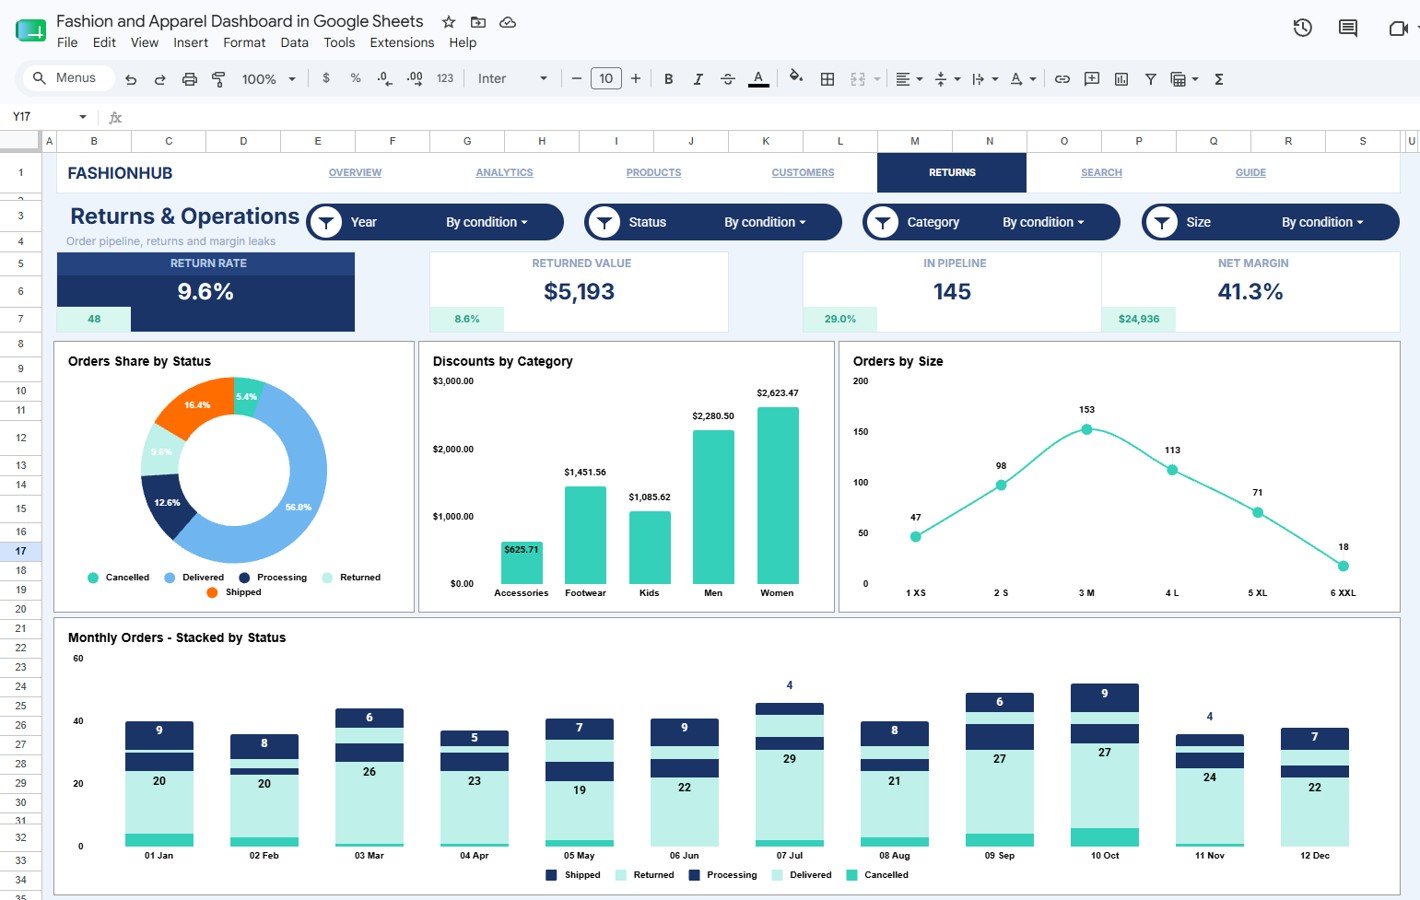
The Returns and Operations tab helps users review order status, discounts, sizes, and status movement over time. It is useful for operational review because fashion teams often need to understand delivered, returned, pending, or cancelled orders together.
Orders Share by Status: This chart shows the percentage or share of orders by status. It helps users see how many records are delivered compared with other states.
Discounts by Category: This chart compares discount value by category. It helps teams identify product groups that may depend too much on markdowns.
Orders by Size: This chart compares order count by size. It supports operational planning around size-level demand.
Orders by Month and Status: This chart shows monthly order counts split by status. It helps reveal whether returns, pending orders, or delivered orders are changing over time.
6 – Order Search
The Order Search sheet lets users select an Order ID from the dropdown and instantly view the full order record. The visible fields include Date, Customer, Category, Product, Channel, Country, Status, Size, Units, Revenue, Cost, and Discount.
7 – Data Sheet Tab
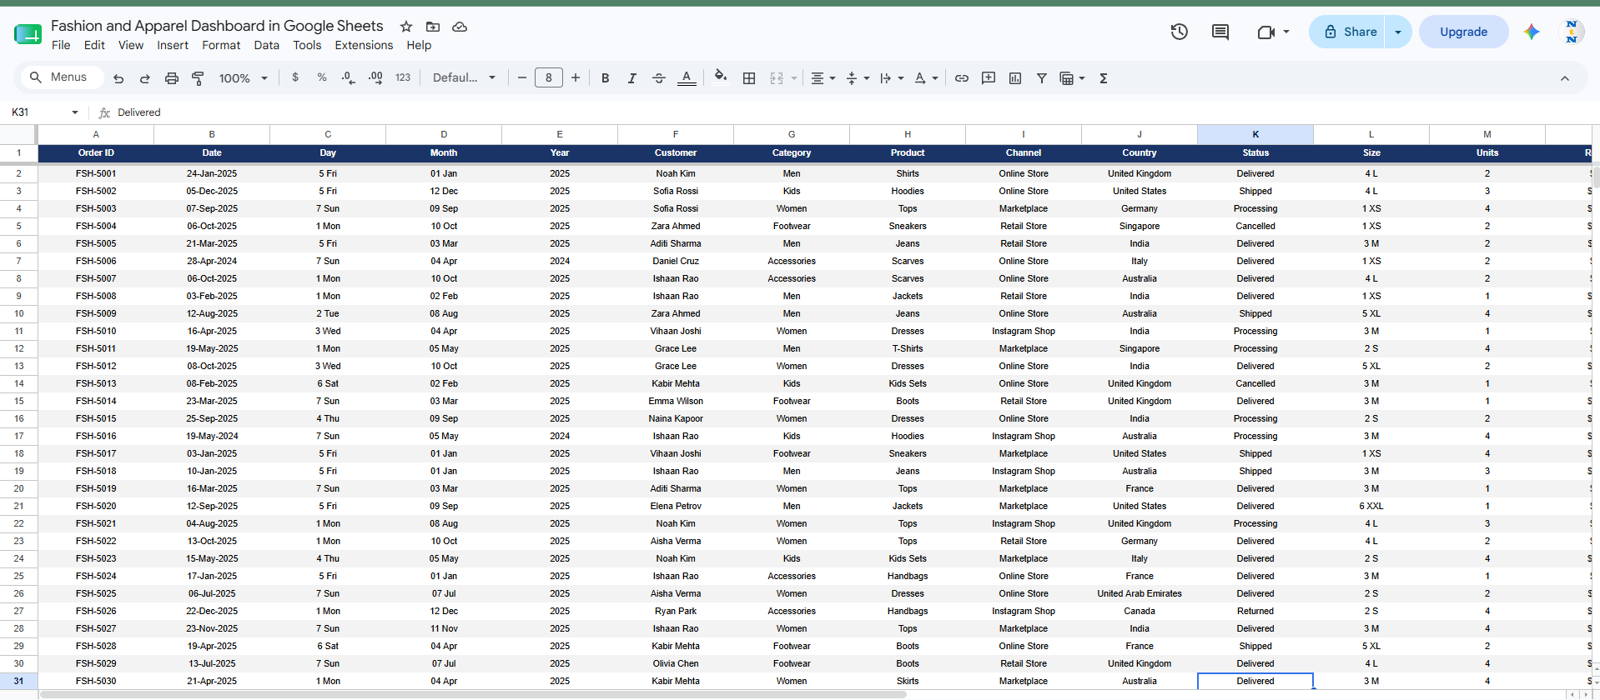
The Data Sheet is where users add order records in the same format used by the dashboard. Keeping dates, customers, categories, products, channels, countries, statuses, sizes, units, revenue, cost, and discount values consistent will keep the dashboard accurate.
Fashion and Apparel Dashboard in Google Sheets vs. Microsoft Excel Dashboard vs. Paid Retail SaaS – Feature Comparison
| Feature | This Google Sheets dashboard | Microsoft Excel dashboard | Paid retail SaaS |
|---|---|---|---|
| Cost | $9.99 one-time sale price | Template price plus possible Excel access | Recurring subscription |
| Platform | Google Sheets and Google Drive | Excel desktop or web | Vendor-hosted app |
| Setup time | Copy file and paste order data | Download workbook and customize ranges | Configure account, imports, users, and permissions |
| Real-time team collaboration | Native Google Sheets sharing | Requires OneDrive or SharePoint for best collaboration | Usually included by plan |
| Mobile access | Google Sheets app or browser | Excel app or browser | Usually available |
| Customizable fields | Edit source data, labels, charts, and formulas | Editable workbook | Limited by vendor settings |
| Share with link | Yes, through Drive permissions | Yes, through Microsoft cloud sharing | Usually invite-based |
| Year-1 cost at 5 users | $9.99 before any Google Workspace costs | Depends on Microsoft licensing | Often hundreds or thousands per year |
| Order ID lookup | Included Search Sheet | Must be built or customized | Usually tied to app records |
| Fashion size analysis | Included Products and Sizes tab | Must be built or customized | Depends on retail plan features |
Who Should Use This Template
This template is best for boutique owners, apparel brands, fashion ecommerce sellers, store managers, marketplace sellers, merchandising analysts, and small retail teams that want a practical dashboard for order data. It is especially useful when a team already exports order records from ecommerce, POS, marketplace, or accounting tools and wants to paste that data into a clean dashboard format.
It is not a full retail operating system. Teams that need live inventory sync, warehouse routing, barcode scanning, payment workflows, customer messaging, automatic returns processing, or enterprise permissions may need a dedicated retail platform.
Real-World Use Cases
Boutique weekly review: A boutique owner filters the dashboard by channel and checks revenue by weekday before planning promotions.
Apparel replenishment planning: A merchandise planner reviews units sold by product and size before deciding what to restock.
Ecommerce operations review: An operations lead reviews orders by month and status to see whether returns or pending orders are increasing.
Regional sales check: A marketing manager reviews revenue by country and orders by country before deciding where to focus campaigns.
Advantages of Fashion and Apparel Dashboard in Google Sheets
The biggest advantage is speed. Users can work from one familiar Google Sheets file instead of waiting for a custom dashboard build. The Data Sheet structure keeps records consistent, and the dashboard pages turn those rows into charts and cards.
The second advantage is flexibility. Users can edit labels, add rows, adjust formulas, and share the file with team members. This works well for small teams that need control without a heavy software rollout.
The third advantage is apparel-specific reporting. The Products and Sizes page, Order Search page, and Returns and Operations page address reporting needs that generic sales dashboards often miss.
Opportunities for Improvement
This is a manual Google Sheets dashboard, so it does not connect automatically to Shopify, WooCommerce, Amazon, Etsy, POS systems, or warehouse tools. Users must paste or enter records into the Data Sheet.
The dashboard also depends on clean input values. If status, country, channel, product, or size names are inconsistent, slicers and charts may show duplicate labels. A short data cleanup step before pasting records will make the dashboard more reliable.
Best Practices
- Keep the Data Sheet column order unchanged when adding new orders.
- Use consistent labels for country, customer, channel, category, product, status, and size.
- Review the Overview page first, then move into the detailed analysis tabs.
- Use slicers during meetings to focus on one region, channel, product group, or status.
- Use the Order Search tab when a customer, support, or operations question requires one complete record.
- Make a backup copy before changing formulas, slicers, or chart ranges.
Explore Relevant Templates
- Fashion KPI Dashboard in Google Sheets
- Fashion KPI Scorecard in Google Sheets
- Retail Profit Margin KPI Dashboard in Google Sheets
- Baby Products Retail Dashboard in Power BI
- Browse more Google Sheets dashboard templates
Want to build skills like this step by step? The Excel Pivot Tables & Dashboards course on NextGenTemplates Academy walks you through it with practice files.
Get the Fashion and Apparel Dashboard in Google Sheets
Frequently Asked Questions
What does the Fashion and Apparel Dashboard in Google Sheets measure?
It measures sales, purchase cost, unit growth, customer volume, delivered orders, revenue, discounts, products, sizes, countries, channels, customers, statuses, and monthly order movement.
Does the template include product and size analysis?
Yes. The Products and Sizes tab includes units sold by product, units sold by size, units share by category, and units sold by month.
Can I search one order record?
Yes. The Order Search sheet lets users select an Order ID and view the matching date, customer, category, product, channel, country, status, size, units, revenue, cost, and discount fields.
Does this connect automatically to ecommerce tools?
No. It is a manual Google Sheets template. Users can export data from other systems and paste it into the Data Sheet in the required format.
Can multiple users work in the dashboard?
Yes. After copying the file into Google Drive, the owner can share it with selected users and control view or edit access through Google Sheets permissions.
Is this template only for fashion stores?
It is designed for fashion and apparel order data, but it can be adapted for boutiques, clothing brands, accessories sellers, and similar retail categories.
About the Author
Built by PK – Microsoft Certified Professional with 15+ years of Excel, Google Sheets, and Power BI experience. Founder of NextGenTemplates, reaching 300K+ subscribers across YouTube channels. Every template is hand-built and tested before release.
Conclusion
The Fashion and Apparel Dashboard in Google Sheets gives fashion teams a clean way to review sales, costs, units, customers, regions, products, sizes, returns, order status, and searchable order records. It is a strong fit for teams that want an editable spreadsheet dashboard, clear visuals, and a one-time purchase workflow before investing in a larger retail analytics system.
For more spreadsheet and dashboard tutorials, visit PKAnExcelExpert on YouTube.