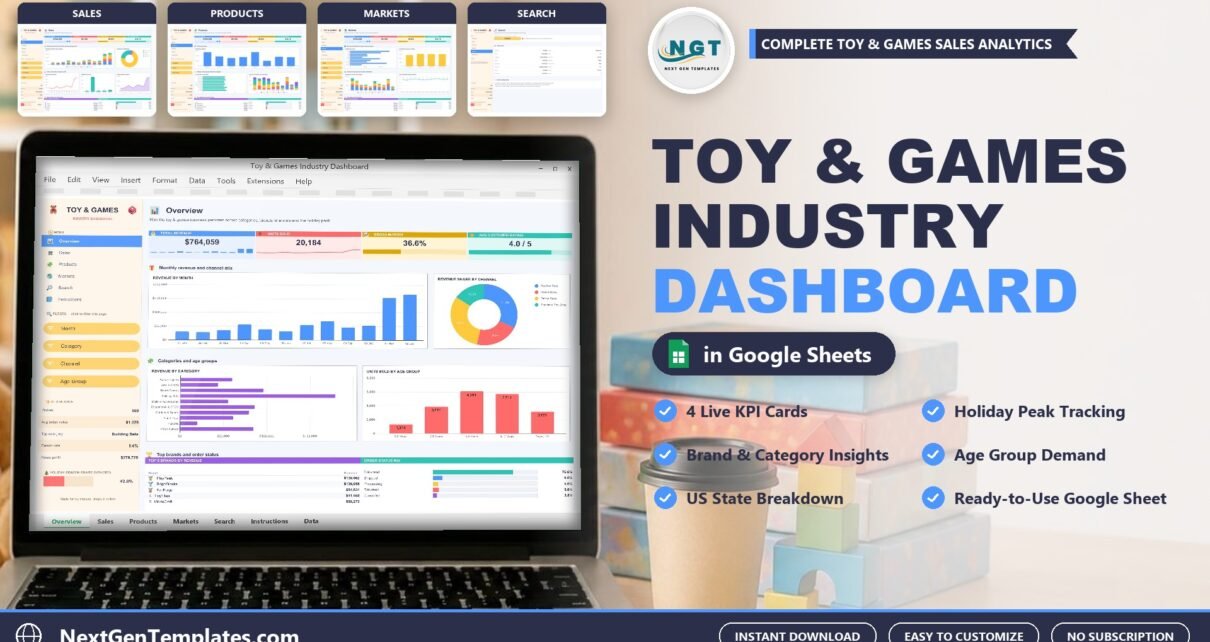
A six-page Toy & Games Industry Dashboard in Google Sheets: 4 KPI cards, 15 slicers and 16 charts over 500 sample orders, 10 categories, 8 brands and 4 channels.
Online Tutorial for Data Analysis and Automation
A six-page Toy & Games Industry Dashboard in Google Sheets: 4 KPI cards, 15 slicers and 16 charts over 500 sample orders, 10 categories, 8 brands and 4 channels.
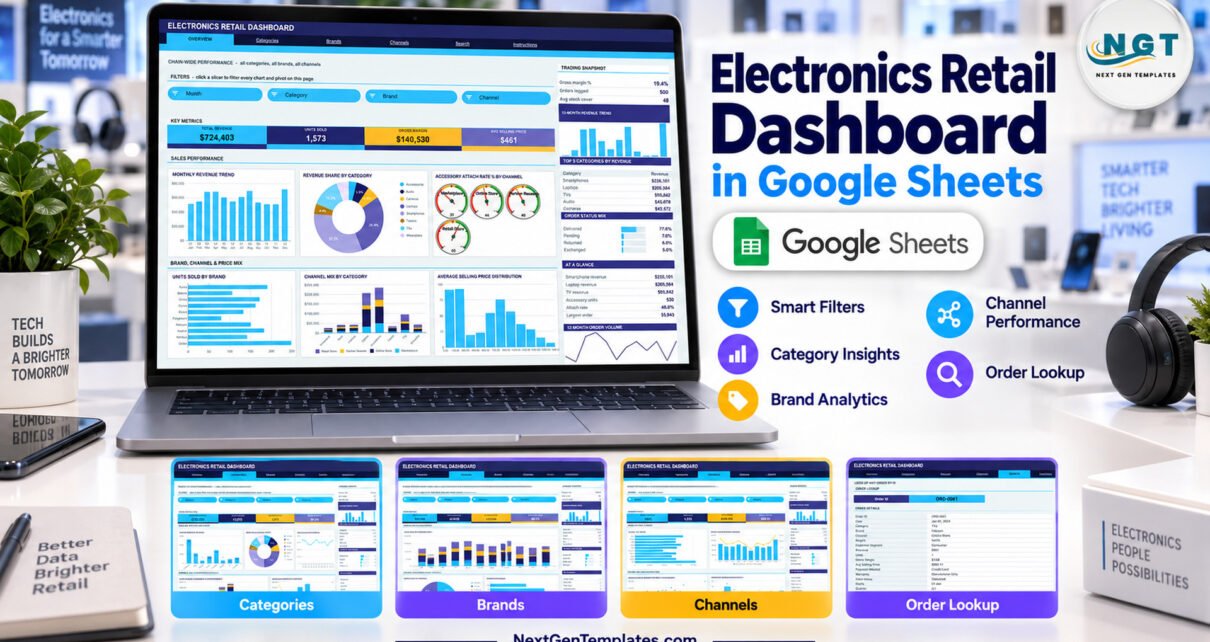
A six-tab Electronics Retail Dashboard in Google Sheets: 16 KPI cards, 15 slicers and 18 pivot-driven charts over 500 sample orders, 8 categories, 10 brands and 4 channels.
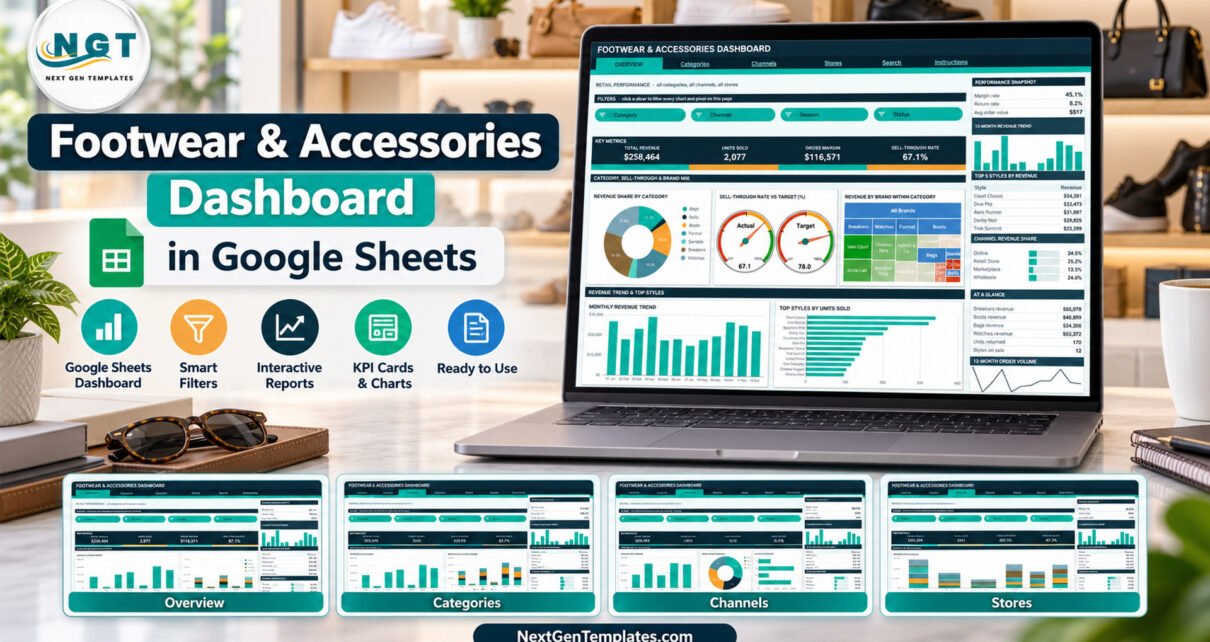
A six-tab Google Sheets retail dashboard with 16 KPI cards, 19 pivot-backed charts and 15 slicers covering sell-through, size curve, channel mix and returns.
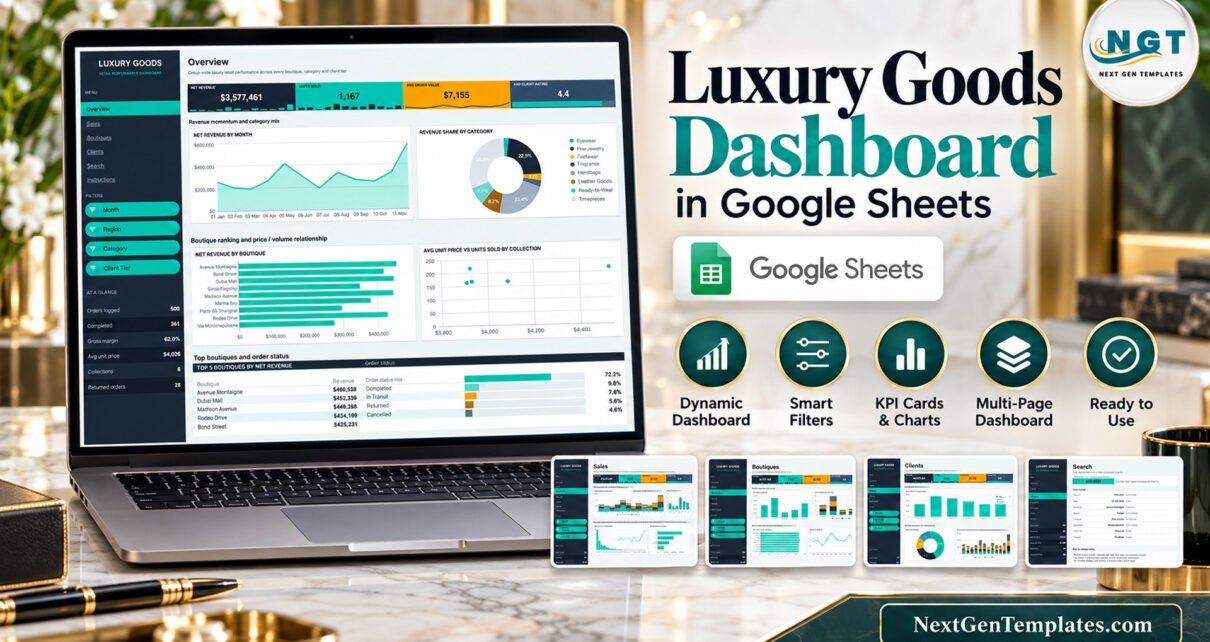
A six-page Luxury Goods Dashboard in Google Sheets with 4 KPI tiles, 16 pivot-backed charts, 15 filter chips and an Order ID search page. Room for 1,000 orders.
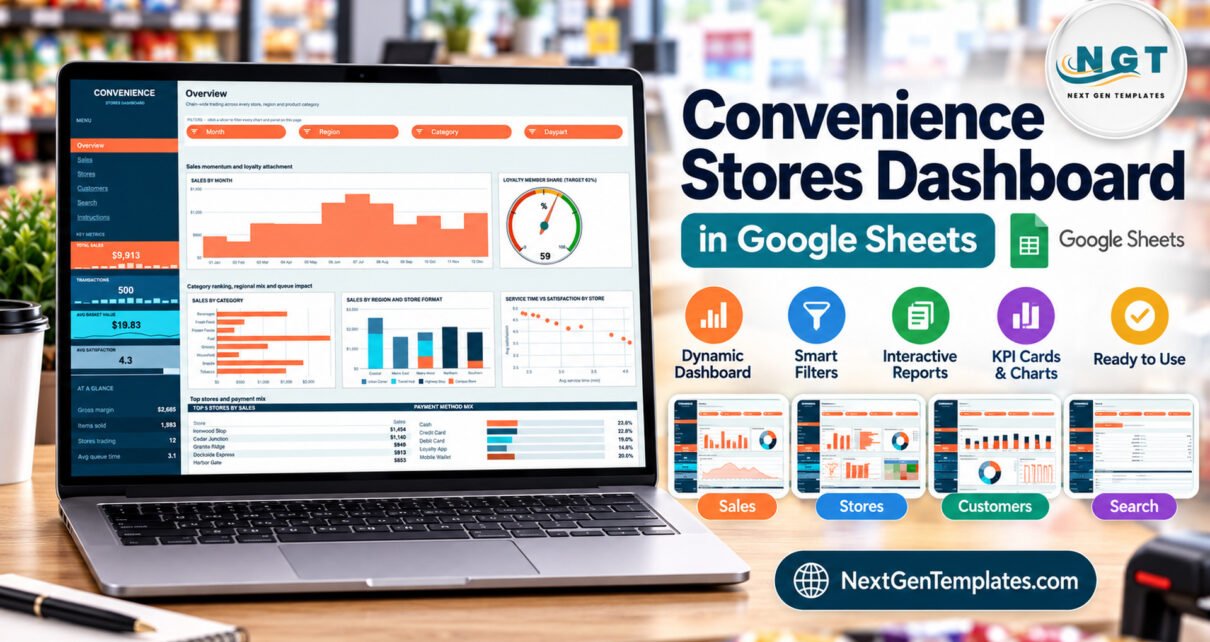
A seven-tab Google Sheets dashboard for convenience store chains: 500 sample transactions, 18 charts and 15 slicers covering sales, margin, store formats, service time, satisfaction and loyalty, with an honest note on what it is not.
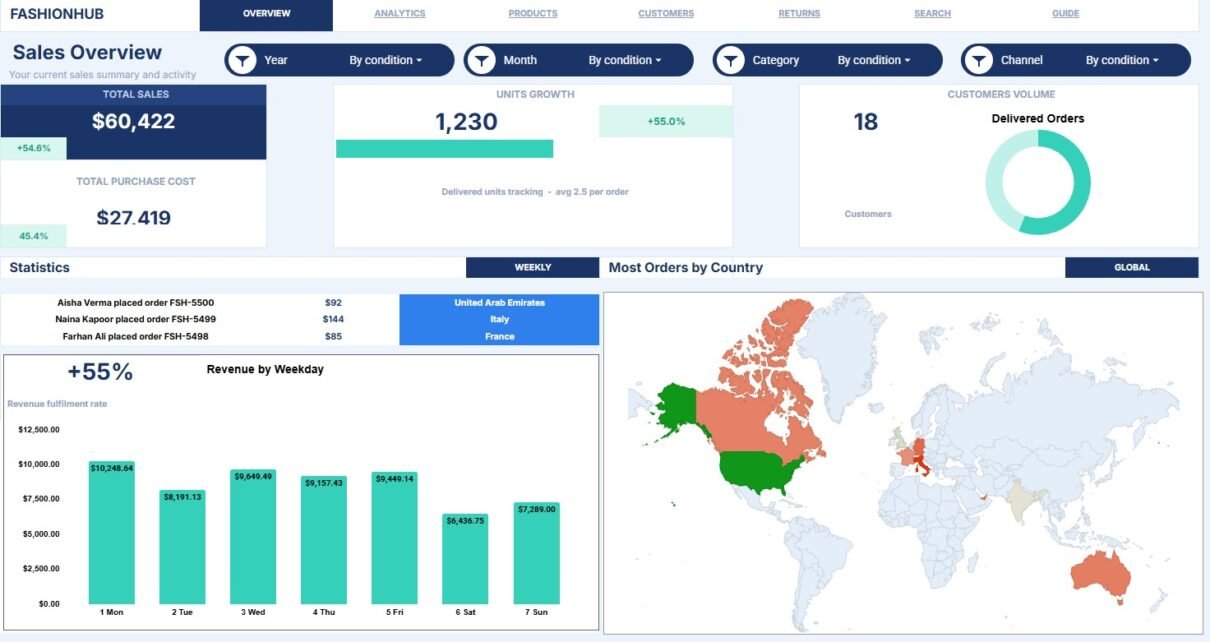
Analyze fashion sales, costs, orders, customers, products, sizes, returns, channels, countries, status and searchable order records in Google Sheets.
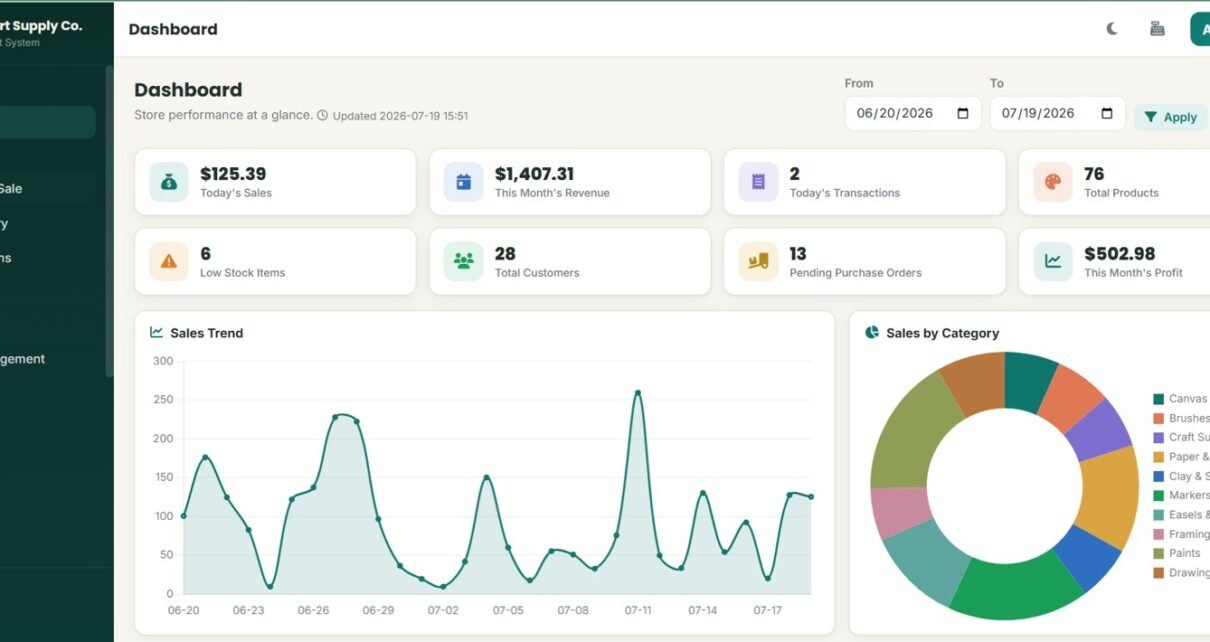
Art Supply Store Management System Web App with POS, live stock, purchases, suppliers, returns, expenses, reports, users, settings and audit logs.
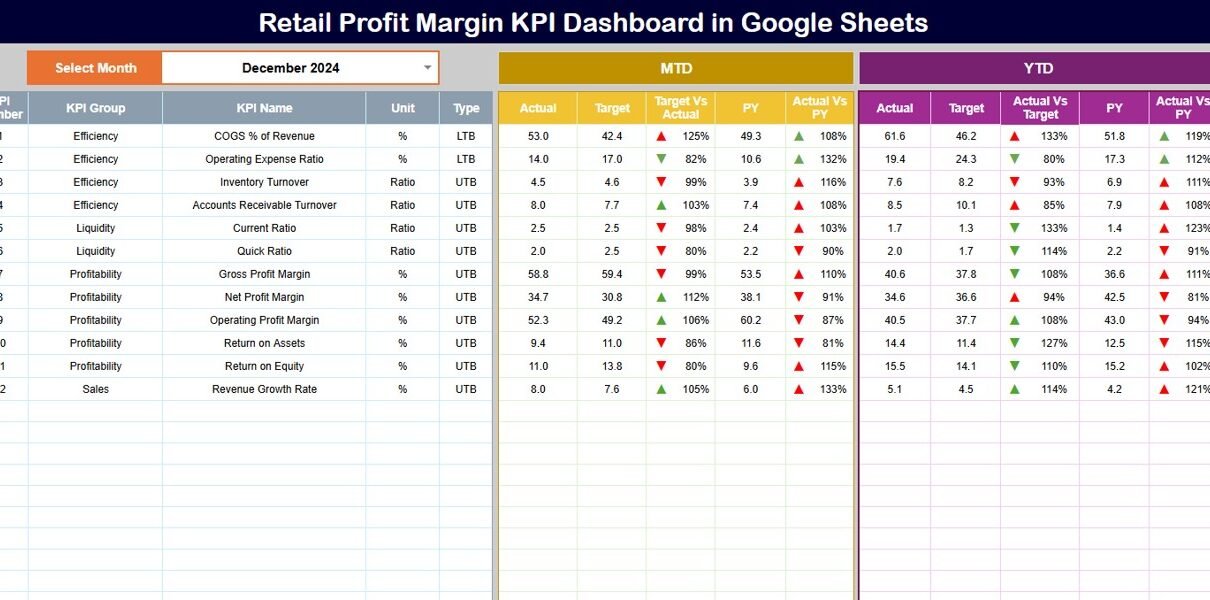
Retail businesses operate on tight margins. Prices fluctuate. Costs increase. Customer behavior changes quickly. Therefore, retailers must monitor profit margins continuously to stay competitive and profitable. However, many teams still rely on scattered spreadsheets or delayed reports, which makes margin analysis slow and unreliable. That is exactly why a Retail Profit Margin KPI Dashboard in […]
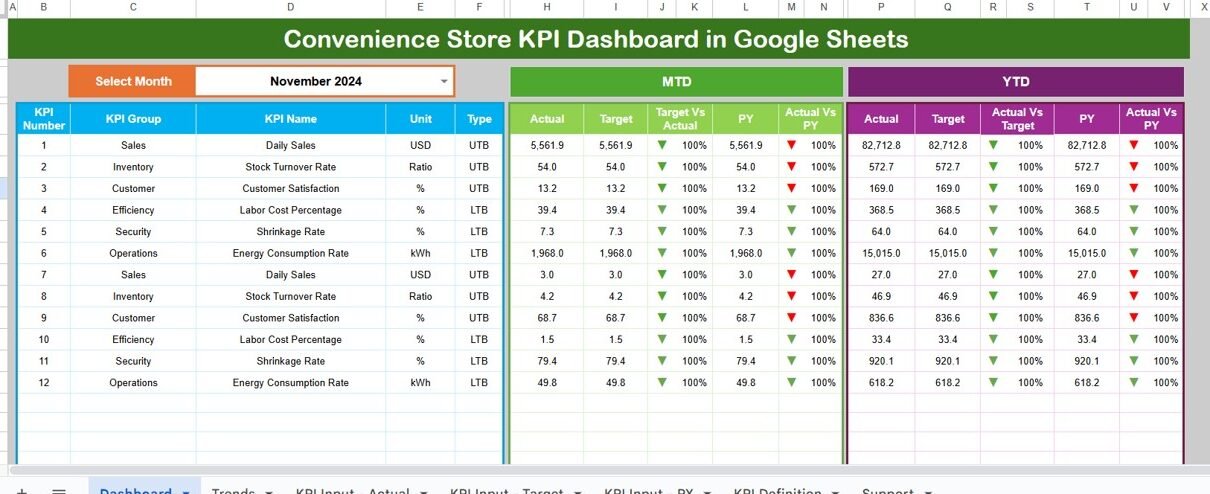
Running a convenience store involves tracking hundreds of small but critical details — sales performance, inventory levels, customer satisfaction, and profitability. Managing all this data manually can be overwhelming. However, with a Convenience Store KPI Dashboard in Google Sheets, you can easily visualize, monitor, and manage your business performance in one place. This article explains […]
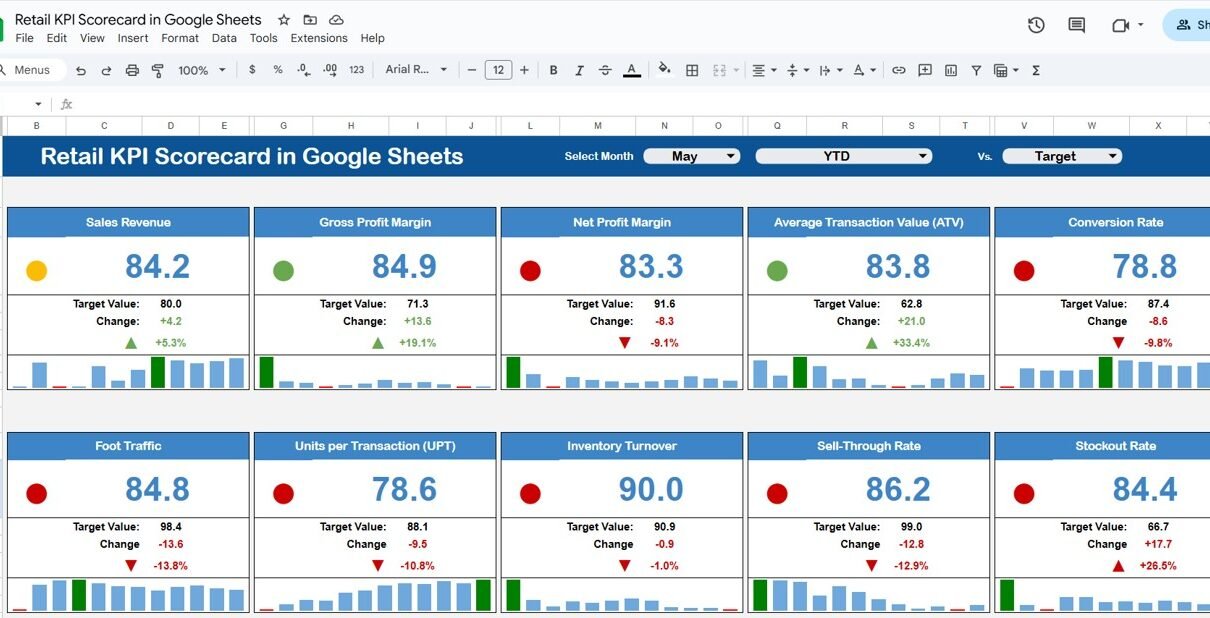
In today’s competitive retail environment, tracking key performance indicators (KPIs) is essential to understand business performance, customer satisfaction, and sales trends. The Retail KPI Scorecard in Google Sheets is a ready-to-use, interactive template that helps retail businesses monitor performance metrics with ease. In this article, we’ll explore the key features, benefits, and best practices of […]