The Personal Finance Net Worth Tracker in Google Sheets is a ready-to-use spreadsheet with 2 focused sheet tabs, a Total Net Worth card, 4 net-worth charts, slicers and 4 setup lists (Type, Category, Status and Liquidity). Instead of checking assets, liabilities, account status and liquidity in separate files, you get one Google Sheets workflow for monthly net worth reviews.
It answers a simple question: how much do you own, how much do you owe, and how is that value split across categories and liquidity? It is built for people who want a flexible manual tracker without paying for another finance app or connecting bank credentials. Below you will find what each tab contains, how to set it up with your own accounts, use cases and honest limitations.
🎥 Watch the Video Tutorial
Key Features of the Personal Finance Net Worth Tracker in Google Sheets
- Overview Page: the main tab with the Total Net Worth card, four charts, slicers and the entry table where you record each account balance.
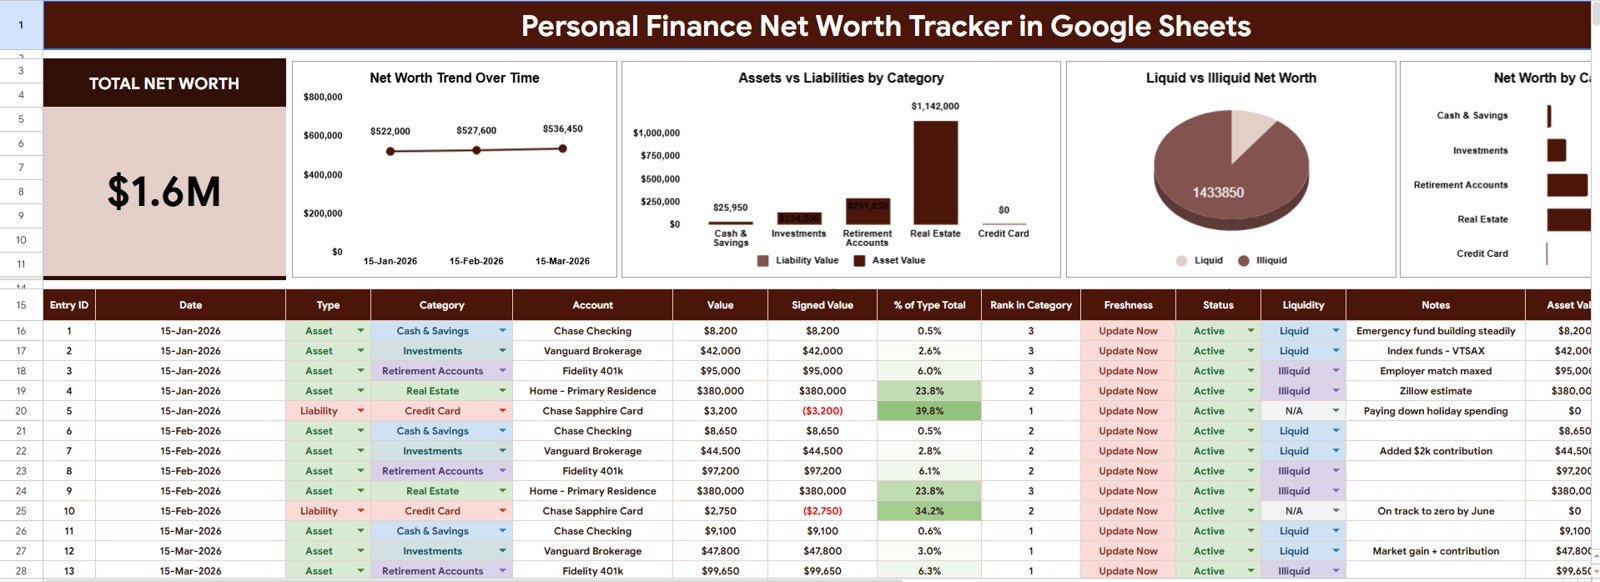
- Total Net Worth card: a headline figure that combines asset values and liability values (as negative Signed Values) from the entry table.
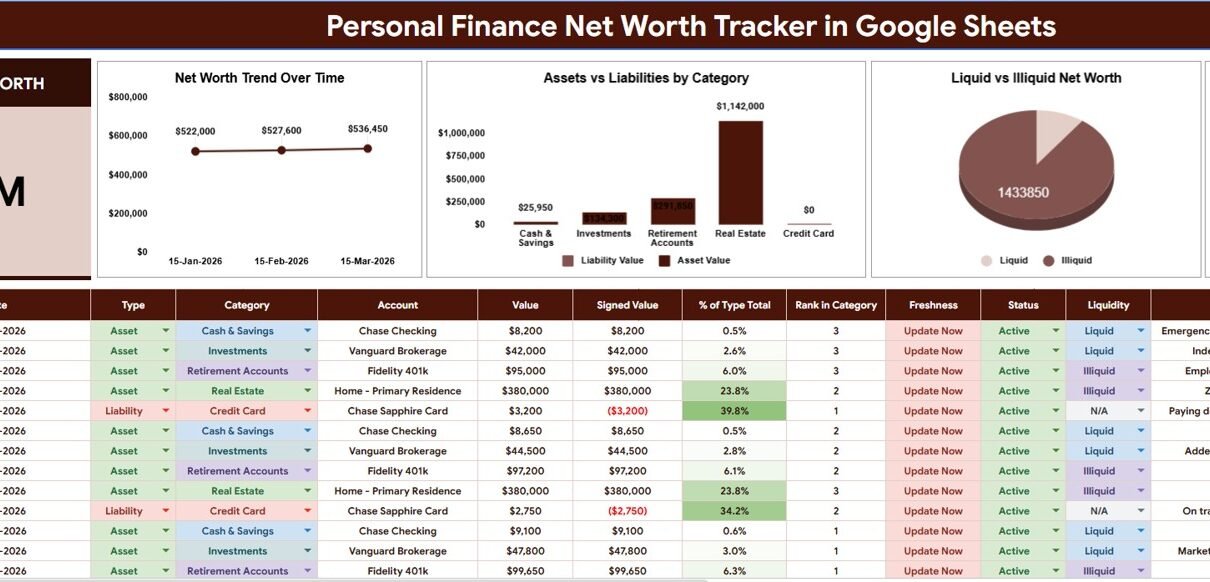
- 4 analysis charts: Net Worth Trend Over Time, Assets vs Liabilities by Category, Liquid vs Illiquid Net Worth, and Net Worth by Category.
- Slicers: filter the view to focus on specific dates, categories or liquidity types.
- Setup Lists tab: controlled dropdown lists for Type, Category, Status and Liquidity.
- Manual-entry structure: you keep control of your data; no bank feed or account connection is required.
Sheet Tabs Explained
1. Overview Page
The Overview Page is where you both enter and review your numbers. At the top, the Total Net Worth card shows the combined total of the entry table. Below the charts sits the entry table with the columns Entry ID, Date, Type, Category, Account, Value, Signed Value, % of Type Total, Rank in Category, Freshness, Status, Liquidity and Notes. Signed Value shows liabilities as negative amounts (for example a credit card balance of $3,200 appears as ($3,200)), which is what lets the tracker net assets against debts. To the right of Notes there are further helper columns such as Asset Value.
Worked example from the sample data (15 January 2026): Chase Checking $8,200 + Vanguard Brokerage $42,000 + Fidelity 401k $95,000 + Home – Primary Residence $380,000 − Chase Sapphire Card $3,200 = $522,000, which is exactly the January point on the Net Worth Trend Over Time chart. February works out to $527,600 and March to $536,450.
Important: in the sample file the Total Net Worth card shows $1.6M because it adds up every row in the entry table, and the table holds three monthly snapshots ($522,000 + $527,600 + $536,450 = $1,586,050). Your current net worth is the latest point on the trend chart ($536,450 in March), not the card total, unless you filter the view to a single review date.
Net Worth Trend Over Time: plots net worth at each review date, so you can see whether your position is improving, flat or declining. The sample data contains three monthly snapshots (January, February and March 2026).
Assets vs Liabilities by Category: compares asset value and liability value for each category, showing where value is stored and where debt is concentrated.
Liquid vs Illiquid Net Worth: separates accessible value from value tied up in long-term assets such as a home or retirement account. This prevents a common planning mistake: treating total net worth as if all of it were available.
Net Worth by Category: shows how much each category — such as Cash & Savings, Investments, Retirement Accounts, Real Estate or Credit Card — contributes to the total.
2. Setup Lists
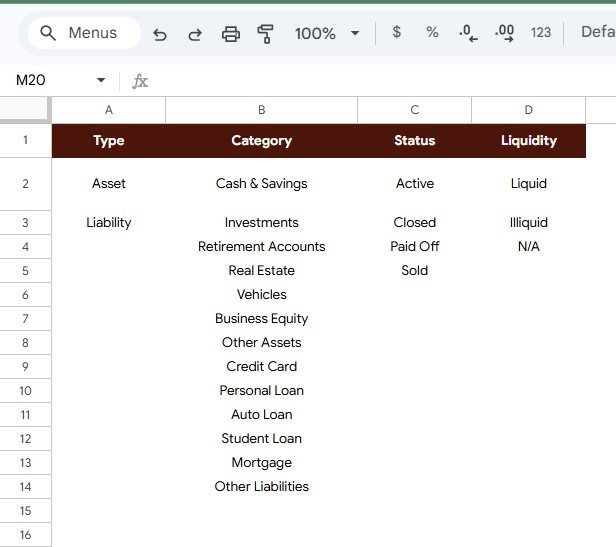
The Setup Lists tab stores the dropdown values that keep entries consistent. Review it before entering your own records so the lists match your accounts.
- Type: Asset, Liability.
- Category: Cash & Savings, Investments, Retirement Accounts, Real Estate, Vehicles, Business Equity, Other Assets, Credit Card, Personal Loan, Auto Loan, Student Loan, Mortgage, Other Liabilities.
- Status: Active, Closed, Paid Off, Sold.
- Liquidity: Liquid, Illiquid, N/A.
Liquidity matters because $10,000 in cash and $10,000 in a long-term asset are not equally accessible.
How to Use It With Your Own Accounts
- Copy the template to your Google Drive.
- Open Setup Lists and adjust the categories to match your accounts (keep Asset and Liability as the two types).
- On the Overview Page, add one row per account for your first review date: Date, Type, Category, Account name and Value.
- Set Status and Liquidity for each row and add any notes.
- Repeat on the same day each month with new rows, so the trend chart builds a history.
- Use the slicers to review a single category or liquidity type.
Google Sheets Tracker vs Excel vs Paid Finance Apps
| Feature | This Google Sheets tracker | Excel workbook | Paid personal finance app |
|---|---|---|---|
| Cost | One-time template purchase | Workbook or template cost | Usually a recurring subscription |
| Platform | Google Sheets | Microsoft Excel | Vendor web or mobile app |
| Setup | Copy file, edit lists, enter records | Open or build workbook | Create account and connect sources |
| Collaboration | Google Sheets sharing | Microsoft cloud sharing | Depends on plan |
| Customizable fields | Editable lists and structure | Editable if unlocked | Limited to app settings |
| Bank sync | No — manual entry | Not unless built | Often available |
| Liquidity analysis | Built into the tracker | Must be built | Depends on app |
Who Should Use This Template
It suits individuals who want a clear monthly view of financial progress, couples who review household money together, students tracking loans and savings, finance coaches who need a simple client worksheet, and families who want a shared asset-liability snapshot. It is also a good choice if you prefer not to connect bank accounts to a third-party app.
It is not a tax calculator, investment recommendation tool, credit monitoring service, brokerage connector or accounting system, and it is not financial advice. Use it for organisation and visibility, and consult qualified professionals for tax, investment or retirement decisions.
Real-World Use Cases
Freelancer with uneven income: updates savings, investments, a car loan and a credit card once a month. The trend chart shows whether net worth is rising even in low-income months.
Couple planning a renovation: uses Liquid vs Illiquid Net Worth to see how much is easy to access and how much is tied up in the home and retirement accounts.
Finance coach: keeps a separate copy for each client and walks through the Overview Page on review calls, using Net Worth by Category to explain why assets and debts both matter.
Advantages and Limitations
The biggest advantage is clarity: assets, debts, categories and dates sit in one repeatable structure instead of being scattered across notes and banking apps. The Setup Lists make it flexible for students, couples and retirees alike, and Google Drive sharing makes it easy to work on with a partner or coach. For guidance on sharing, see Google’s help article on collaborating in Sheets.
The tracker intentionally has no live bank connection, so values must be updated by hand. If you need automated feeds, investment performance, tax projections or retirement modelling, pair it with specialist tools. If you want to understand the formulas behind trackers like this, the learning paths on NextGenTemplates Academy are a good starting point.
Best Practices
- Set a review date: update values on the same day each month so the trend chart stays comparable.
- Keep categories simple: start with the default list and add detail only when it helps decisions.
- Label liquidity carefully: cash and savings are not the same as property or retirement accounts.
- Back up before big edits: make a copy before changing formulas or structure.
- Use Status: mark accounts as Closed, Paid Off or Sold so old records do not confuse the current picture.
Related Templates and Guides
On this site: the Net Worth Tracker in Google Sheets, the Personal Finance Dashboard in Google Sheets, the Personal Monthly Budget Tracker in Google Sheets, the Credit Card Payoff Tracker in Google Sheets and the Personal Finance KPI Dashboard in Google Sheets.
Related products: Finance KPI Scorecard in Google Sheets and Budget Request & Approval Tracker in Google Sheets.
Frequently Asked Questions
What is included in the Personal Finance Net Worth Tracker in Google Sheets?
An Overview Page with a Total Net Worth card, four charts, slicers and an entry table, plus a Setup Lists tab for Type, Category, Status and Liquidity values.
Can I customize the setup lists?
Yes. The lists are meant to be edited so they match your own account groups, statuses and liquidity definitions.
Does the tracker connect to my bank?
No. It uses manual entry or pasted data, so no third-party bank credentials are needed.
How are liabilities handled?
Each entry has a Type of Asset or Liability. Liabilities appear as negative amounts in the Signed Value column, so they reduce Total Net Worth.
Why does the Total Net Worth card show more than my latest month?
The card totals every row in the entry table. If you log a new set of balances each month, it adds those snapshots together. Read your current position from the latest point on the Net Worth Trend Over Time chart, or filter to one review date.
Can couples or families use it together?
Yes. After copying the file to Google Drive, share it with trusted people using Google Sheets permissions.
Is this financial advice?
No. It is an organisational spreadsheet that helps you record and review information. It does not provide investment, tax or legal advice.
About the Author
Built by PK — Microsoft Certified Professional with 15+ years of Excel, Google Sheets and Power BI experience, and founder of NextGenTemplates. Every template is hand-built and tested before release.
Wrapping Up
The Personal Finance Net Worth Tracker in Google Sheets brings assets, liabilities, categories, liquidity and net worth trends into one editable file. Pick a monthly review day, enter your balances, and let the charts show how your position changes over time.
📅 Last updated: October 2026