Track mortgage balance, principal, interest, payment types, and estimated years left with an editable Google Sheets dashboard, settings tab, and four charts.
Tag: finance
Loan EMI Repayment Tracker in Google Sheets
Learn how to track loan EMIs, outstanding balances, principal, interest, next payment dates, and repayment progress in Google Sheets with this template.
Personal Finance Net Worth Tracker in Google Sheets
Use this Personal Finance Net Worth Tracker in Google Sheets to monitor assets, liabilities, liquid net worth, categories, and setup lists in one file.
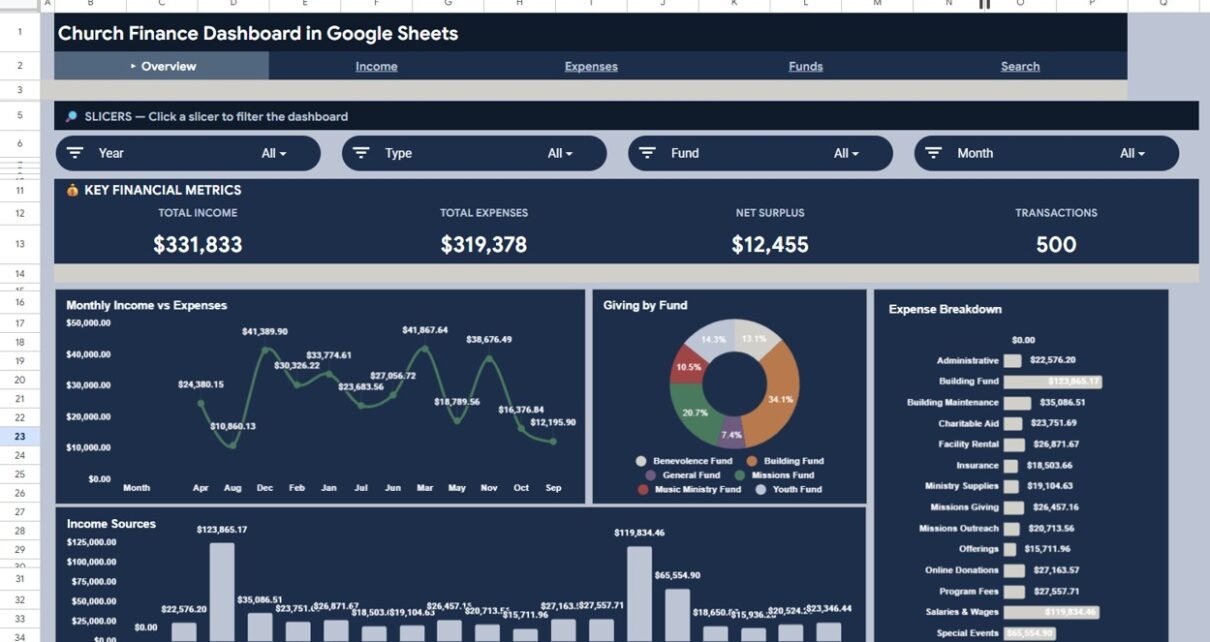
Church Finance Dashboard in Google Sheets
Church Finance Dashboard in Google Sheets — track Total Income, Total Expenses, Net Surplus, and Transactions across 5 interactive sheet tabs with 10+ charts, slicer filters, and a transaction search page. Cloud-native, collaborative, $9.99 one-time.
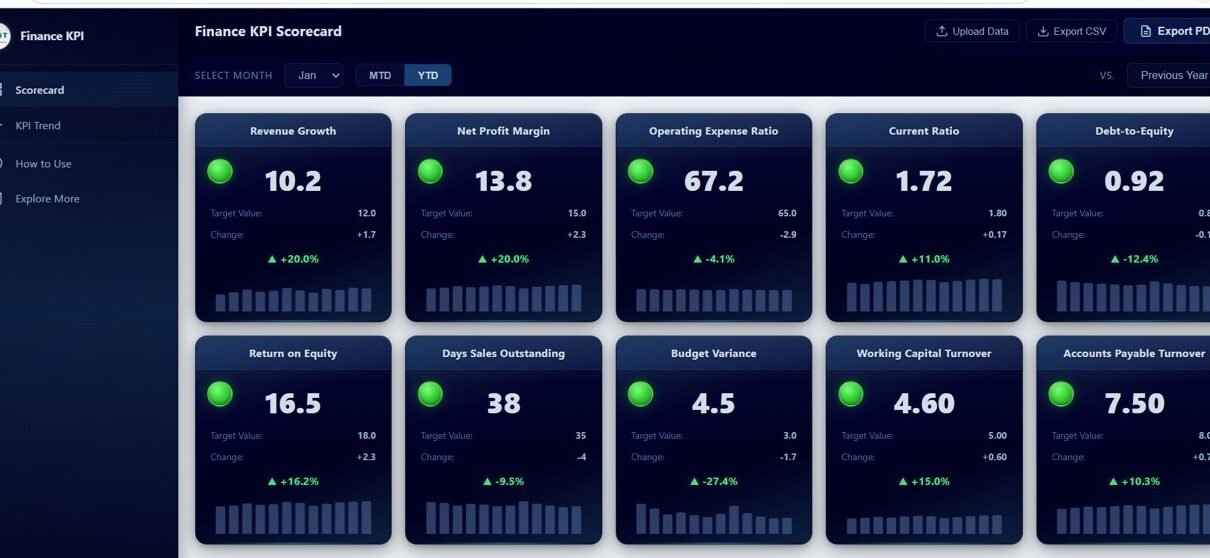
Finance KPI Scorecard in HTML
Finance KPI Scorecard in HTML — a premium interactive dashboard template with 10 finance KPIs, traffic light indicators, sparkline trends, MTD/YTD comparison toggle, and detailed trend analysis charts for CFOs and finance teams.
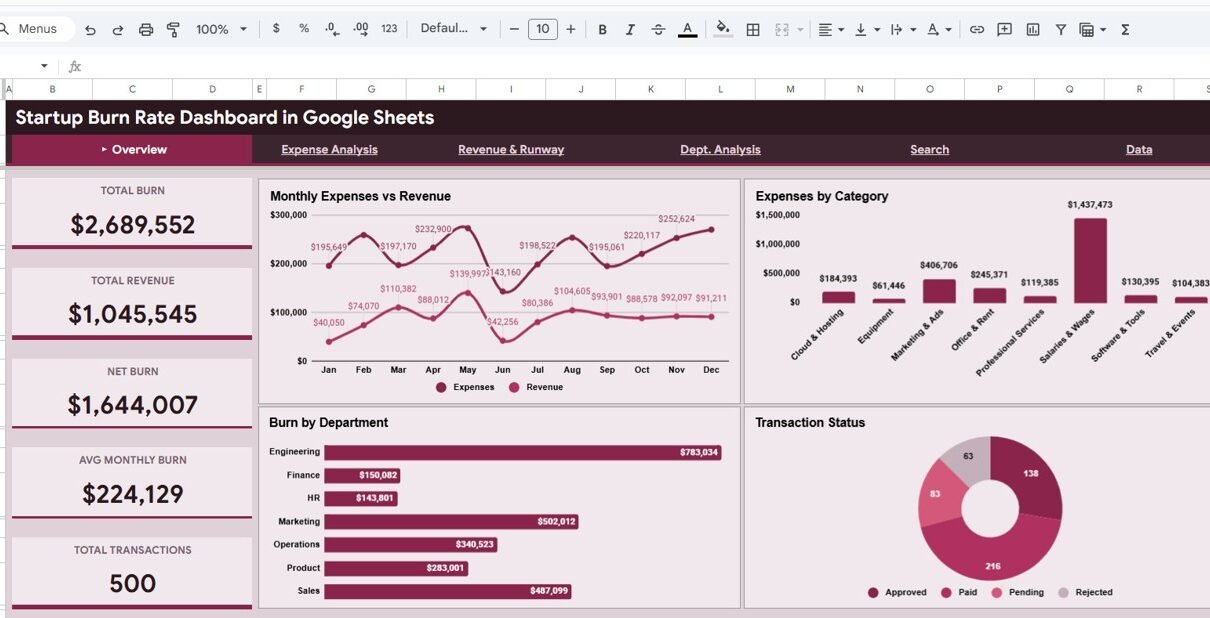
Startup Burn Rate Dashboard in Google Sheets
Track your startup’s burn rate, expenses, revenue, and financial runway with this interactive Google Sheets dashboard featuring 5 pages, 5 KPI cards, dynamic charts, and smart search functionality.
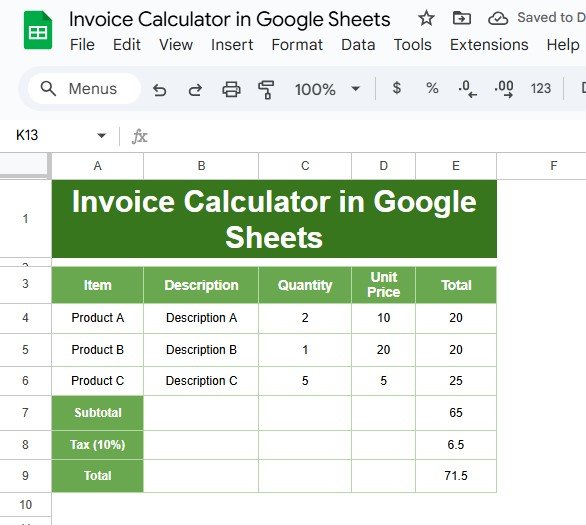
How to Create an Invoice Calculator in Google Sheets: A Step-by-Step Guide
Are you tired of dealing with messy invoices? If so, you’re in the right place! In this blog post, we’ll show you how to create an Invoice Calculator in Google Sheets using a simple example. By the end, you’ll have an easy-to-use tool that makes your invoicing process smooth and efficient. Why Choose Google Sheets […]
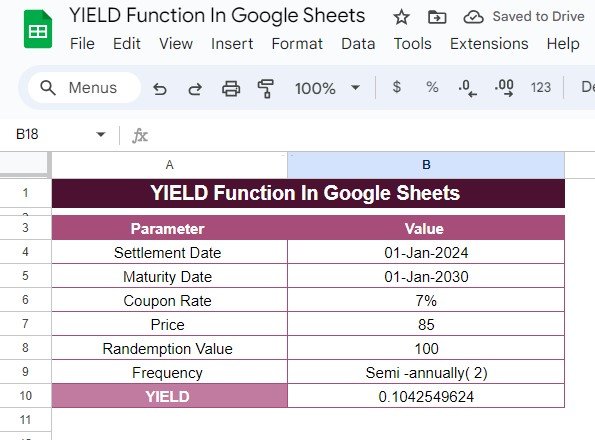
How to Use the YIELD Function in Google Sheets: Step-by-Step Example
Calculating bond yields can be a tricky task, but thankfully, Google Sheets has a built-in function that makes it a lot easier. In this guide, we’ll explain how to use the YIELD function in Google Sheets with a real-world example, breaking down each step to help you understand the process. If you’re ready to learn […]