
In today’s fast-paced world, managing insurance policies, premiums, and claims can be quite challenging. Especially for insurance companies, tracking each policy, understanding customer behavior, and making data-driven decisions are essential to success. With the rise of digital tools, Google Sheets has emerged as a reliable and cost-effective solution for building dashboards that manage large volumes of insurance data. In this article, we will explore the Insurance Dashboard in Google Sheets, its key features, how it works, and the advantages it offers for businesses in the insurance sector.
Click to buy Insurance Dashboard in Google Sheets
What is the Insurance Dashboard in Google Sheets?
The Insurance Dashboard in Google Sheets is a powerful tool designed to help insurance companies and agencies track and analyze key metrics related to policies, premiums, claims, and sales performance. It provides an intuitive and visually appealing interface that aggregates all essential data into one place, making it easy for users to monitor, assess, and take action based on real-time information.
This ready-to-use dashboard consists of two primary sheets:
-
Dashboard Sheet Tab – This is where all the dynamic charts and key performance indicators (KPIs) are visualized.
-
Data Sheet Tab – The data input sheet where users can enter and manage insurance data.
Let’s dive into how each sheet works and how it benefits users.
Dashboard Sheet Tab: Visualizing Key Metrics
The Dashboard Sheet Tab is the heart of the Insurance Dashboard. This sheet brings together all important metrics and visual representations of your data, making it easier to understand trends, identify patterns, and make informed decisions.
Key Components in the Dashboard Sheet Tab:
Click to buy Insurance Dashboard in Google Sheets
1. Cards for Key Metrics
The dashboard features several cards that summarize the most important data points. These cards provide a quick overview of your business performance:
-
# of Policies: The total number of active policies.
-
Premium Amount ($): The total premium amount collected from all policies.
-
Claim Amount ($): The total claims paid out by the insurance company.
-
Avg. Premium ($): The average premium paid across all policies.
-
Avg. Claim Amount ($): The average claim amount across all claims.
These cards provide a snapshot of your business’s current state, helping you gauge whether you’re on track with your financial and operational goals.
2. Charts for In-Depth Analysis
The dashboard also includes several charts that allow users to visualize and analyze data over time. Here are the main charts featured in the dashboard:
a) # of Policies by Gender
This chart breaks down the number of policies sold based on the gender of the policyholders. It helps you understand the gender distribution and tailor marketing efforts accordingly.
b) Claim Amount by Claim Status
This chart displays the total claim amount categorized by the status of the claims (approved, pending, rejected, etc.). This is important for tracking claim processing and identifying any bottlenecks in the claims process.
c) Total Premium by Region
This chart shows the premium amounts collected from different regions. It’s helpful for evaluating regional performance and identifying areas where sales could be boosted.
d) Number of Policies by Type
This chart tracks how many policies were sold per policy type, such as health, life, auto, etc. It allows you to analyze the popularity of different types of insurance policies.
e) Premium Amount vs Claims Amount by Policy Type
This chart compares the total premium amount with the total claims amount for each policy type. It’s valuable for assessing the profitability of each policy type.
f) # of Policies vs Premium Amount ($) by Month
This chart helps track the number of policies sold and the premium amounts collected month-over-month. It gives insight into seasonal trends and overall sales performance.
g) Policy Sold by Agent
This chart visualizes the performance of individual agents by showing how many policies each agent has sold. It helps identify top performers and areas for improvement.


Click to buy Insurance Dashboard in Google Sheets
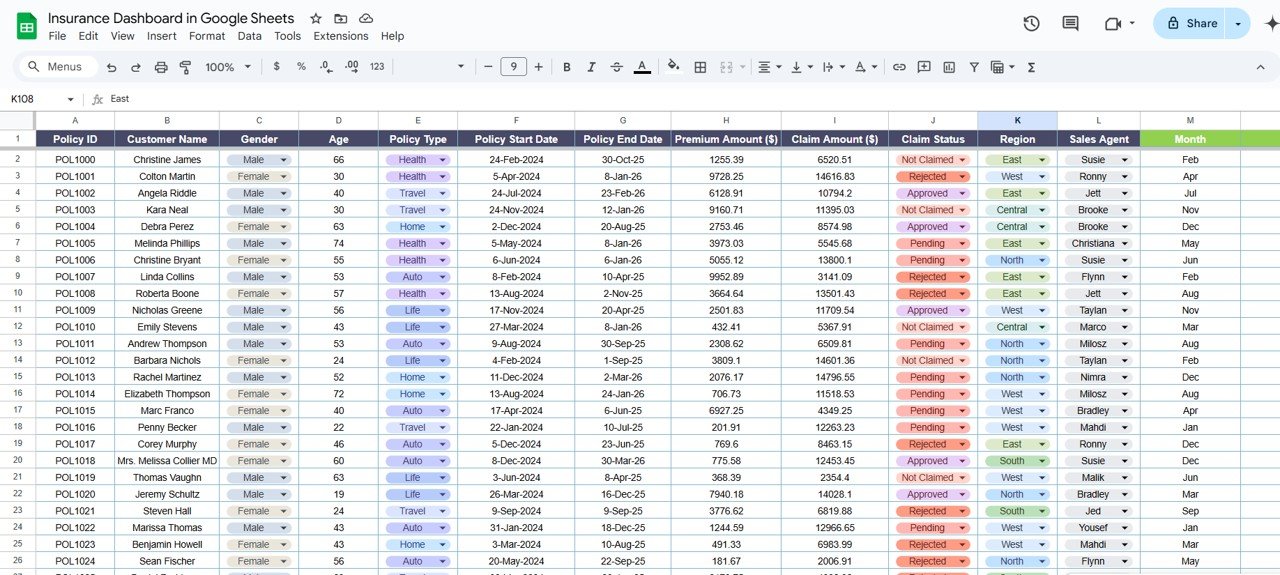
Data Sheet Tab: Managing and Inputting Data
The Data Sheet Tab serves as the backbone of the Insurance Dashboard. It is where all the raw data is entered, and it feeds the Dashboard Sheet with the necessary information for visualization.
Key Fields in the Data Sheet:
The data sheet includes the following columns:
-
Policy ID: A unique identifier for each insurance policy.
-
Customer Name: The name of the policyholder.
-
Gender: The gender of the policyholder.
-
Age: The age of the policyholder.
-
Policy Type: The type of insurance policy (e.g., health, life, auto).
-
Policy Start Date: The start date of the policy.
-
Policy End Date: The end date of the policy.
-
Premium Amount ($): The premium amount paid by the policyholder.
-
Claim Amount ($): The amount of money claimed by the policyholder.
-
Claim Status: The current status of the claim (e.g., pending, approved, rejected).
-
Region: The geographical region of the policyholder.
-
Sales Agent: The name of the agent who sold the policy.
-
Month: The month when the policy was sold.
-
Year: The year when the policy was sold.

Click to buy Insurance Dashboard in Google Sheets
Advantages of Using the Insurance Dashboard in Google Sheets
The Insurance Dashboard in Google Sheets offers several advantages for businesses in the insurance sector. Let’s explore the key benefits of using this powerful tool.
- Cost-Effective: One of the primary advantages of using Google Sheets is that it’s a free tool. Unlike expensive insurance management software, the Insurance Dashboard in Google Sheets offers a similar level of functionality without any additional costs.
- Ease of Use: Google Sheets is simple to use, even for those who don’t have advanced technical skills. The interface is user-friendly, and users can easily enter data, create charts, and customize the dashboard to fit their specific needs.
- Real-Time Data Updates: Since Google Sheets is cloud-based, any updates made to the data sheet are immediately reflected in the dashboard. This ensures that the information you’re working with is always up-to-date.
- Customizability: Google Sheets allows you to fully customize the dashboard according to your unique business needs. You can add or remove charts, adjust data fields, and tailor the design to match your company’s branding.
- Collaboration: With Google Sheets, multiple users can access and edit the dashboard simultaneously. This makes it easy for teams to collaborate and work together on analyzing and managing insurance data.
Opportunities for Improvement in the Insurance Dashboard
Click to buy Insurance Dashboard in Google Sheets
While the Insurance Dashboard in Google Sheets is a powerful tool, there are still opportunities for improvement to make it even more effective. Let’s explore some potential areas for enhancement.
- Integration with Other Tools: The dashboard currently works within the Google Sheets ecosystem, but integrating it with other tools, such as CRM software, would streamline data entry and improve automation.
- Advanced Data Analytics: While the current dashboard provides basic charts and KPIs, adding more advanced analytics (e.g., predictive analysis, trends forecasting) could help insurance businesses make more informed decisions.
- Enhanced Security: Since Google Sheets is a cloud-based tool, it’s important to ensure that the data is securely protected. Adding advanced security measures, such as multi-factor authentication and restricted access, would improve the safety of sensitive customer information.
Best Practices for Using the Insurance Dashboard
To make the most out of the Insurance Dashboard in Google Sheets, it’s important to follow some best practices. Here are a few recommendations to ensure you are using the dashboard effectively:
- Regular Data Updates; Make sure to regularly update the data sheet to ensure that the information in the dashboard is always accurate and up-to-date. Schedule periodic reviews to avoid outdated or incomplete data.
- Data Validation?: Before entering data into the sheet, implement validation rules to ensure consistency and accuracy. For instance, you can use drop-down lists for fields like Gender and Claim Status to avoid incorrect data entry.
- Customizing Dashboards for Different Roles: Different team members may need to see different information. Customize the dashboard for specific roles (e.g., sales agents, managers, claims adjusters) to ensure that everyone has access to the data they need.
- Backup Your Data: Even though Google Sheets automatically saves data, it’s a good practice to back up your data regularly. Download the spreadsheet periodically to keep a local copy of your data.
- Leverage Conditional Formatting: Use conditional formatting to highlight key data points, such as overdue claims, high premiums, or policies nearing expiration. This will help your team quickly identify areas that need attention.
Frequently Asked Questions (FAQs)
Click to buy Insurance Dashboard in Google Sheets
1. How do I customize the Insurance Dashboard in Google Sheets?
You can easily customize the Insurance Dashboard by adding or removing charts, changing data fields, and adjusting the design to match your business needs. The user-friendly interface allows for quick modifications.
2. Is it possible to add more charts to the dashboard?
Yes, you can add more charts to the dashboard. Google Sheets offers various chart types that can be used to visualize additional data points as needed.
3. Can I automate data entry in Google Sheets for the insurance dashboard?
While Google Sheets does not offer full automation, you can integrate it with third-party tools or use Google Apps Script to automate certain data entry tasks.
4. How secure is the data in Google Sheets?
Google Sheets uses encryption and security measures to protect data. However, for added security, it is recommended to set permissions and use multi-factor authentication for access.
5. Can I share the dashboard with my team?
Yes, Google Sheets allows you to share the dashboard with your team members. You can control the level of access (view, comment, or edit) for each user.
Conclusion
The Insurance Dashboard in Google Sheets offers insurance businesses a comprehensive and easy-to-use tool to manage policies, premiums, claims, and agent performance. With its cost-effectiveness, ease of use, and real-time updates, it’s a valuable asset for any organization looking to streamline insurance data management. By following the best practices outlined in this article, you can maximize the utility of the dashboard and ensure that your business stays ahead in today’s competitive insurance market.
Visit our YouTube channel to learn step-by-step video tutorials
Youtube.com/@NeotechNavigators
Click to buy Insurance Dashboard in Google Sheets
Watch the step-by-step video tutorial:
