


In today’s fast-paced business environment, managing risks is more important than ever. Whether you’re dealing with financial challenges, cybersecurity threats, or operational hurdles, it’s crucial to stay on top of potential risks. One of the best ways to do this is by using a Risk Management Dashboard. Even better? You can easily create one using Google Sheets—a free, accessible, and powerful tool for managing your data.
In this article, I’ll guide you through the process of building your own Risk Management Dashboard in Google Sheets. It’s not only simple to set up but also gives your team the ability to make quick, data-driven decisions in real time.
What is a Risk Management Dashboard?
A Risk Management Dashboard is essentially a visual tool that helps you track, assess, and manage risks in your organization. Think of it as a central hub where all your risk data is neatly organized and displayed. With this dashboard, you can easily identify which risks need attention, which are under control, and which require mitigation efforts.
This dashboard uses various visual elements like charts, summary cards, and tables to give you a clear picture of:
- Risk Trends: Are risks increasing or decreasing over time?
- Risk Levels: How severe are the risks you’re facing?
- Actionable Insights: What steps do you need to take to mitigate these risks?
Key Components of a Risk Management Dashboard in Google Sheets
Your Risk Management Dashboard in Google Sheets will generally consist of two main tabs:
- Data Sheet Tab: This is where you’ll store all the raw risk data.
- Dashboard Sheet Tab: This is where you’ll visually represent the data with charts, summary cards, and key metrics.
Let’s break down how these two tabs work together to give you a comprehensive view of your risk management process.
Dashboard Sheet Tab: The Heart of Your Risk Overview
This is where you’ll display all the critical data. Think of it as the control center for your organization’s risk landscape.
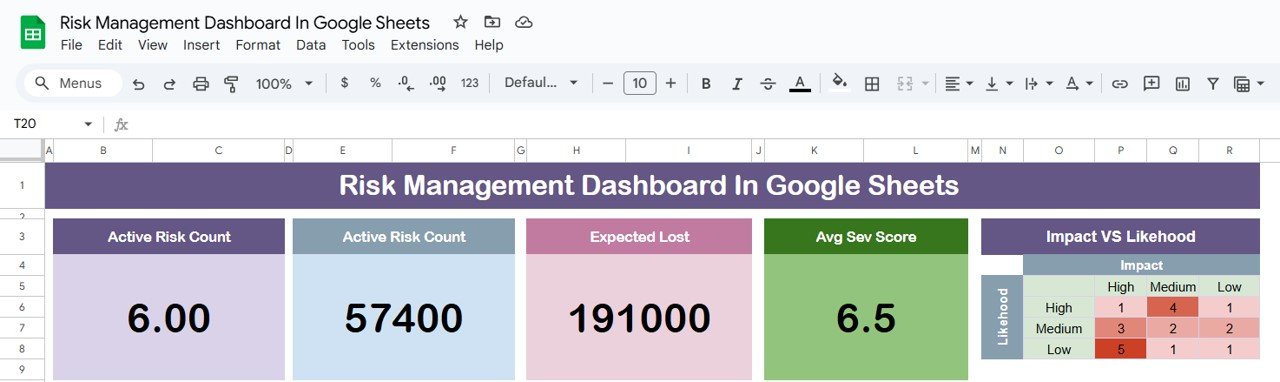
Summary Cards: Quick Insights at a Glance
At the top of your Dashboard Sheet, you’ll typically find summary cards. These provide a snapshot of the most important risk metrics. Some of the summary cards you might want to include are:
- Active Risk Count: Shows the total number of active risks. This helps you see at a glance how many risks are currently being addressed.
- Expected Loss: Displays the total financial loss expected from all active risks, giving you an idea of the potential business impact.
- Average Severity Score: Provides the average severity of all risks, helping you understand the overall threat level.
- Impact vs. Likelihood: A visual chart that compares the potential impact of each risk against its likelihood of happening. This helps prioritize which risks need the most attention.

Click to buy Risk Management Dashboard In Google Sheets
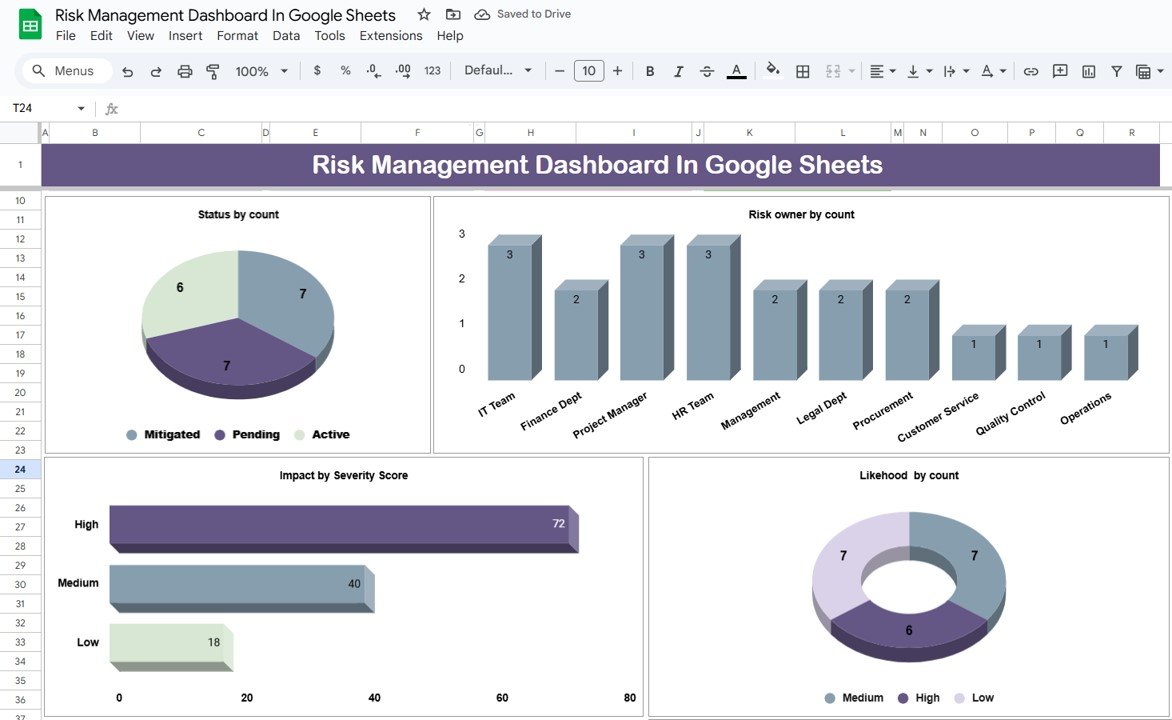
Charts for Deeper Insights
Below the summary cards, you can add charts that provide more detailed insights. These charts will help you track trends and make data-driven decisions. Some helpful charts to consider are:
- Count by Status: Shows the number of risks in different states (e.g., Mitigated, Active, Pending). This gives you a quick overview of where things stand with your risk management efforts.
- Count by Risk owner: Displays how many risks are assigned to each team or department, so you can see who’s handling what.
- Severity Score by Impact: Shows how the severity of each risk correlates with its potential impact. This helps you allocate resources effectively.
- Count by Likelihood: Categorizes risks by their likelihood (Low, Medium, High), making it easier to focus on the most urgent threats.
- Expected Loss by Risk Category: Groups risks by their category (e.g., Cybersecurity, Finance) and shows the expected financial loss for each group.
- Avg. Severity Score by Risk owner: Displays which teams are responsible for managing specific categories of risks, ensuring accountability.


Click to buy Risk Management Dashboard In Google Sheets
Data Sheet Tab: The Back-End of Your Dashboard
The Data Sheet Tab is where all the detailed risk data is stored. It acts as the foundation of your dashboard, providing the raw data that feeds into your visualizations and metrics.
Here are the key columns you’ll typically find in this sheet:
- Risk ID: A unique identifier for each risk (e.g., RISK_01).
- Risk Description: A brief explanation of the risk (e.g., Data breach, Budget overrun).
- Impact: The potential severity of the risk (e.g., High, Medium, Low).
- Likelihood: The probability of the risk occurring (e.g., High, Medium, Low).
- Risk Owner: The individual or department responsible for managing the risk.
- Mitigation Strategy: The plan to address the risk (e.g., Enhance security protocols).
- Status: The current status of the risk (e.g., Active, Mitigated, Pending).
- Mitigation Cost: The cost of mitigating the risk.
- Expected Loss: The expected financial loss from the risk.
- Date Identified: When the risk was first identified.
- Mitigation Deadline: The date by which the risk should be mitigated.
- Risk Category: The category the risk falls under (e.g., Cybersecurity, Finance).
- Severity Score: A score indicating how severe the risk is.
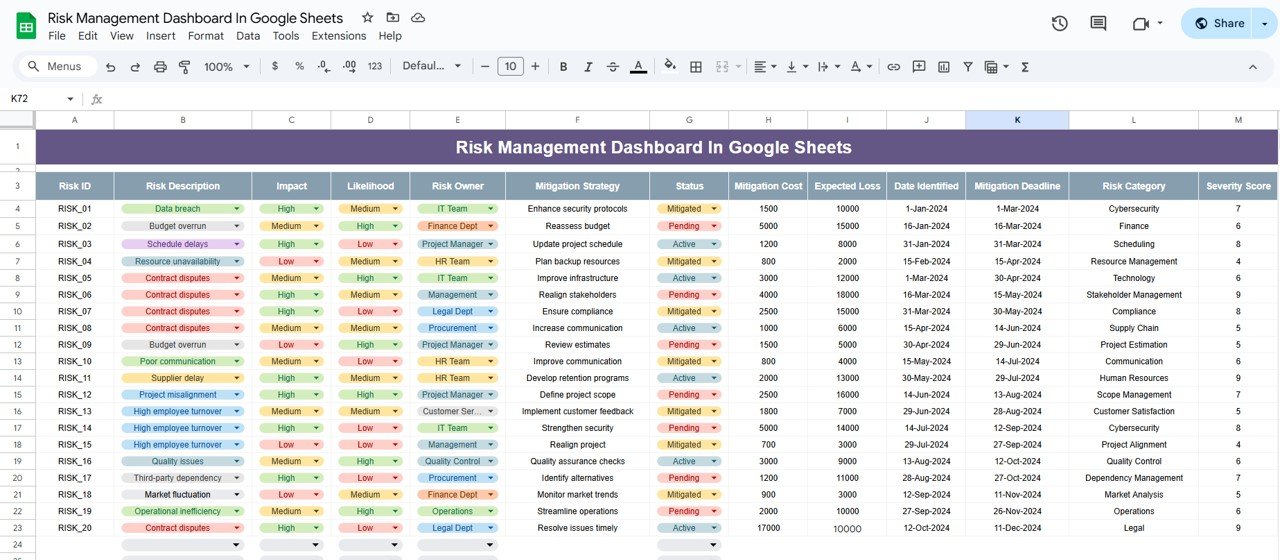

Each row represents a different risk, and the data from these columns is used to power your summary cards and charts in the dashboard.
Click to buy Risk Management Dashboard In Google Sheets
Why Choose Google Sheets for Your Risk Management Dashboard?
There are several reasons why Google Sheets is a great choice for creating a Risk Management Dashboard:
- Easy Accessibility: Google Sheets is cloud-based, so anyone with the proper permissions can access it from anywhere. This makes it perfect for teams working remotely or across multiple locations.
- Cost-Effective: It’s free! You won’t need to invest in expensive risk management software.
- Highly Customizable: Google Sheets is flexible, allowing you to tailor the dashboard to fit your organization’s specific needs and risk categories.
- Real-Time Updates: Any changes made to the data are reflected instantly in the dashboard, ensuring your team always has the latest information.
- Easy to Share: You can quickly share your dashboard with stakeholders, making it simple to keep everyone on the same page.
How to Enhance Your Risk Management Dashboard
While a basic dashboard is useful, there are always ways to improve it. Here are a few suggestions for taking your dashboard to the next level:
- Advanced Visualizations: Consider adding heat maps, Gantt charts, or other advanced visual tools for deeper insights.
- Automated Alerts: Set up email notifications that alert key team members when critical risks need immediate attention.
- Data Validation: Use advanced data validation techniques to ensure your data is accurate and consistent.
- Custom Risk Scoring: Develop formulas that calculate more precise severity scores by factoring in various elements like financial impact, mitigation progress, and likelihood.
Best Practices for Creating Your Risk Management Dashboard
To get the best results from your Risk Management Dashboard, follow these best practices:
- Keep It Simple: Focus on the key metrics that provide the most actionable insights. Avoid overwhelming your users with too much data.
- Use Conditional Formatting: Highlight high-priority risks using color-coded formatting. This makes them easier to spot and prioritize.
- Update Regularly: Ensure the data is updated regularly, ideally after each risk review or whenever a risk’s status changes.
- Assign Clear Ownership: Make sure each risk has a designated owner to ensure accountability.
- Review and Refine: Regularly review your dashboard, gather feedback, and make improvements based on stakeholder input.
Click to buy Risk Management Dashboard In Google Sheets
Conclusion
Building a Risk Management Dashboard in Google Sheets is a straightforward yet powerful way to manage the risks facing your organization. Not only does it help you track risks in real time, but it also provides valuable insights into the effectiveness of your mitigation strategies. Whether you’re tackling cybersecurity threats, financial risks, or operational challenges, a dashboard like this will help you stay on top of things.
By following the steps and best practices outlined in this guide, you can create a flexible, scalable, and comprehensive dashboard that will evolve as your organization’s risk management needs grow.
Frequently Asked Questions (FAQs)
- What is the purpose of a Risk Management Dashboard?
A Risk Management Dashboard helps organizations visualize and track key metrics like active risks, severity scores, and expected losses. It allows teams to prioritize risks and take proactive measures to address them.
- How do I create a Risk Management Dashboard in Google Sheets?
First, set up a Data Sheet to store risk details, then create a Dashboard Sheet where you display the key metrics and visual insights derived from that data.
- Can I customize the Risk Management Dashboard in Google Sheets?
Yes! Google Sheets is highly customizable, so you can adjust the dashboard to fit your specific needs, including risk categories and performance metrics.
- What are the advantages of using Google Sheets for risk management?
Google Sheets offers easy access, real-time updates, and easy sharing. Plus, it’s free, making it a cost-effective alternative to expensive risk management software.
- How often should the Risk Management Dashboard be updated?
You should update the dashboard regularly—ideally after each risk review or whenever a risk’s status changes. Keeping it up-to-date ensures that everyone is working with the most current information.
Visit our YouTube channel to learn step-by-step video tutorials
Youtube.com/@NeotechNavigators
Watch the step-by-step video tutorial:
