
A Pro Gantt Chart is one of the most effective tools for visualizing project timelines and ensuring that all activities are tracked efficiently. Whether you are managing a small team or handling a large-scale project, a Gantt chart allows you to break down the tasks and track their progress over time. In this article, we’ll explain how to create a Pro Gantt Chart (Project Plan) in Google Sheets — a simple yet powerful solution that you can start using right away.
What is a Pro Gantt Chart in Google Sheets?
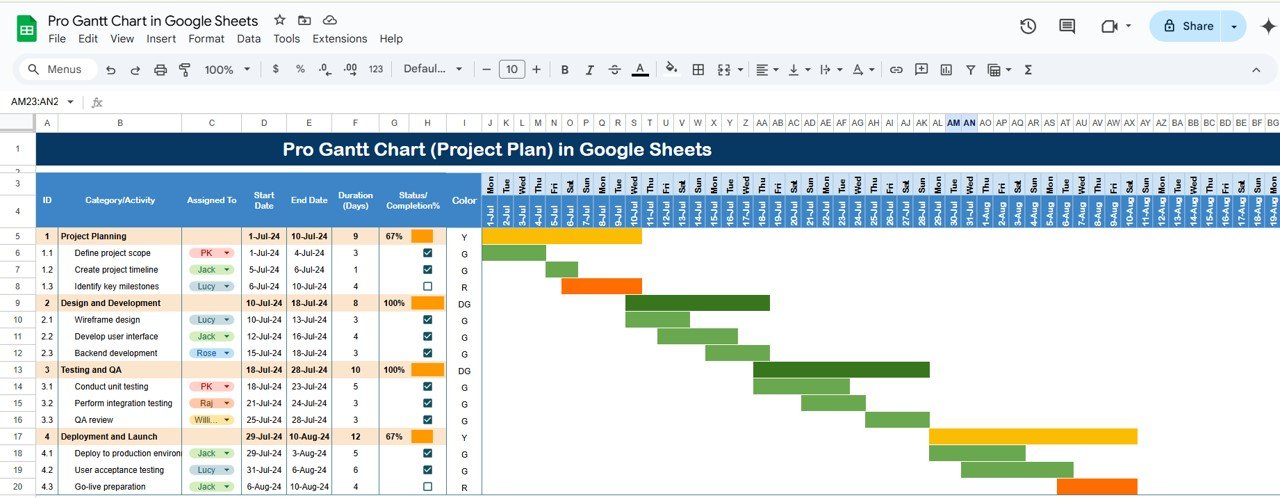
A Pro Gantt Chart in Google Sheets is a project management tool designed to help teams and individuals visualize project schedules, track task progress, and ensure that deadlines are met. It provides a visual representation of the project timeline and allows you to monitor the status of different activities.
This chart in Google Sheets comes with several important features:
- Task Categories: Clearly categorized activities make it easy to track.
- Assigned Team Members: A dropdown for assigning team members to specific tasks.
- Start and End Dates: Helps to set the timeframe for each task.
- Task Duration: Automatically calculates the time span of each task.
- Completion Status: Visual feedback of task progress through a completion percentage.
- Color-Coding: Task completion is color-coded, offering a quick overview of the project’s health.
Let’s dive into how you can create this Pro Gantt Chart in Google Sheets, step by step.

Click to buy Pro Gantt Chart Project Planner in Google Sheets
How to Create a Pro Gantt Chart in Google Sheets
Follow these easy steps to create your own Pro Gantt Chart in Google Sheets:
1. Set Up Your Google Sheet
Start by opening a new Google Sheet. Label the columns as follows:
- ID: The unique identifier for each task.
- Category/Activity: The name of the task or category.
- Assigned To: Team members responsible for the task (use a dropdown list).
- Start Date: The date when the task will start.
- End Date: The date when the task will be completed.
- Duration (Days): The number of days the task will take (automatically calculated).
- Status/Completion%: The percentage of task completion (with checkboxes or manual input).
- Color: The color-coding for task progress.
2. Enter Data for Your Tasks
Now, start entering your project data. For each task, provide the following details:
- ID: Task number or ID.
- Category/Activity: The name of the task (e.g., “Design”, “Development”, “Testing”).
- Assigned To: Use Google Sheets’ Data Validation feature to create a dropdown list of team members.
- Start Date and End Date: Use the date format to input when the task will begin and end.
- Duration (Days): Calculate the number of days the task will take by subtracting the start date from the end date.
3. Use Formulas for Task Status and Color-Coding
Here’s where things get interesting! Google Sheets allows you to use formulas to automatically adjust task statuses and apply color codes based on completion percentages.
Formula for Status and Color-Coding:
Use this formula in the Color column:
=IF(MOD($A5,1)=0,IF($G5<0.5,"DR",IF($G5<0.8,"Y",IF($G5=1,"DG",""))),IF($H5=TRUE(),"G","R"))
- DR (Dark Red): Task is less than 50% completed.
- Y (Yellow): Task is between 50% and 99% completed.
- DG (Dark Green): Task is 100% completed.
- G (Green): Task is checked off and marked as completed.
- R (Red): Task is incomplete or overdue.
Formula for Task Duration:
To calculate the duration automatically, use:
This formula checks whether the task falls within the project timeline and displays the relevant information.
Advantages of Using a Pro Gantt Chart in Google Sheets
The Pro Gantt Chart in Google Sheets offers numerous advantages for project management. Here are some of the key benefits:
- Easy to Use and Customize: Google Sheets is a simple tool that almost everyone is familiar with. Customizing your Gantt Chart is easy, and you can adjust it based on the unique needs of your project. Whether you’re managing a small project or a complex one, it’s flexible enough for any situation.
- Cost-Effective Solution: Unlike other project management tools that require subscriptions, Google Sheets is completely free. This makes it a highly cost-effective option for freelancers, small businesses, and even large organizations.
- Real-Time Collaboration: Google Sheets allows for real-time collaboration. Team members can edit the sheet simultaneously, ensuring that the project plan stays updated. This feature is especially useful for remote teams.
- Visual Representation of Progress: With color-coding and automatic updates, the Pro Gantt Chart visually represents the status of each task. It gives you a quick overview of your project’s progress, which helps in making data-driven decisions.
- Integration with Other Google Tools: Google Sheets integrates seamlessly with other Google tools like Google Drive, Google Calendar, and Google Docs. This means you can attach project files, set reminders, and collaborate in various ways.
Click to buy Pro Gantt Chart Project Planner in Google Sheets
Opportunities to Improve Your Pro Gantt Chart
While the Pro Gantt Chart in Google Sheets is a powerful tool, there is always room for improvement. Here are some opportunities to enhance your chart:
- Add Task Dependencies: You can improve your Gantt Chart by showing dependencies between tasks. This means that one task cannot start until another is completed. By adding this feature, you can better understand task flows and manage bottlenecks.
- Create Automated Alerts: Although Google Sheets doesn’t have built-in alerts, you can use Google Scripts to send automated email notifications when a task is nearing its deadline or when the status of a task changes.
- Track Resource Allocation: You can expand your Gantt Chart to include resource allocation, such as how many hours a team member spends on a particular task. This will allow you to manage resources more effectively.
- Use Conditional Formatting for More Color-Coding; Beyond the basic color-coding for task completion, consider adding more visual cues. For example, you could use different colors for high-priority tasks or tasks that are delayed.
Click to buy Pro Gantt Chart Project Planner in Google Sheets
Best Practices for Creating a Pro Gantt Chart in Google Sheets
To make the most out of your Pro Gantt Chart, follow these best practices:
- Be Consistent with Data Entry: Ensure that your data is entered consistently. For instance, always use the same date format and categorize tasks accurately. This will make it easier to interpret and work with the chart.
- Regularly Update the Chart: Keep your Gantt Chart up-to-date. Regularly review and update the status of tasks, ensuring that team members are completing their assigned tasks on time.
- Use Filters for Easy Navigation: If your project has many tasks, use Google Sheets’ filtering features to quickly sort tasks by status, team member, or category. This will help you find relevant information without scrolling through the entire chart.
- Review Your Gantt Chart with the Team: Hold periodic meetings to review the Gantt Chart with your team. This ensures that everyone is on track and allows you to address any issues before they become bigger problems.
Frequently Asked Questions (FAQs)
What is a Gantt Chart in Google Sheets?
A Gantt Chart in Google Sheets is a visual project management tool that helps you plan and track the progress of tasks. It uses horizontal bars to represent tasks and their timelines, making it easy to visualize the project schedule.
Can I track multiple projects with this Gantt Chart?
Yes, you can track multiple projects in the same Google Sheet. You can create separate tabs for each project or use one sheet with categories to manage tasks for each project.
How can I assign tasks to team members in Google Sheets?
You can assign tasks by using the Data Validation feature in Google Sheets, which allows you to create a dropdown list of team members for each task.
Can I customize the color coding in the Gantt Chart?
Yes, the color coding can be customized to represent different statuses. You can modify the formulas in the Color column to change the colors based on your preferences.
How do I handle task dependencies in Google Sheets?
While Google Sheets doesn’t have built-in dependency features, you can manually represent task dependencies by using formulas or comments to indicate that one task depends on the completion of another.
Conclusion
Creating a Pro Gantt Chart (Project Plan) in Google Sheets is an excellent way to manage and track project tasks efficiently. By using simple formulas and Google Sheets’ features, you can create a dynamic chart that is visually informative and easy to update. Whether you’re managing a small team or a large-scale project, this Gantt chart will help ensure that tasks are completed on time and according to plan. By following the best practices outlined above, you can ensure your project stays on track and meets its goals.
Visit our YouTube channel to learn step-by-step video tutorials
Youtube.com/@NeotechNavigators
Click to buy Pro Gantt Chart Project Planner in Google Sheets
Watch the step-by-step video tutorial:
