Restaurant P&L Dashboard in Google Sheets is a powerful, cloud-based analytics template designed to help restaurant owners, food service managers, and hospitality finance teams monitor revenue, food cost, labor cost, gross profit, operating expenses, and total covers across multiple restaurant locations — all from one interactive Google Sheets dashboard. Whether you run a single-location restaurant or manage a multi-branch chain, this dashboard gives you complete visibility into your restaurant’s financial health with 6 dedicated sheet tabs, 13+ interactive charts, KPI cards, slicers, and a built-in search feature.
If you have been tracking restaurant financials manually or using scattered spreadsheets, the Restaurant P&L Dashboard in Google Sheets eliminates the chaos by consolidating all your profit and loss data into a single, automated, visually stunning dashboard that updates in real time as you enter your data.
Key Features of Restaurant P&L Dashboard in Google Sheets
Click here to Purchase Restaurant P&L Dashboard in Google Sheets
- 6 Interactive Dashboard Pages — Overview, Revenue, Cost Analysis, Trends, Search, and Data sheet tabs covering every aspect of restaurant P&L analysis
- 5 KPI Cards — Total Revenue, Total Food Cost, Total Labor Cost, Gross Profit, and Total Covers displayed prominently on the Overview page
- 13+ Interactive Charts — Revenue by Location, Revenue by Category, Monthly Revenue vs Food Cost, Cost Breakdown by Cost Type, Revenue by Day of Week, Dine-In vs Takeout by Location, Monthly Covers and Avg Check, Food Cost % by Location, Food vs Labor Cost by Category, Monthly Cost Breakdown, Monthly Revenue vs Total Cost, Net Profit by Location, and Cumulative Revenue YTD
- Multi-Location Support — Compare financial performance across all your restaurant branches with location-based filters and dedicated comparison charts
- Built-In Slicers — Filter the entire dashboard by location, revenue category, time period, and more for instant drill-down analysis
- Transaction Search — Look up any individual transaction by Transaction ID to see full details including date, location, revenue, food cost, labor cost, operating expense, covers, and average check
- Cloud-Based — Works entirely in Google Sheets via Google Drive, accessible from any device with real-time collaboration capabilities
- Fully Automated — Just replace the sample data with your own restaurant transactions and all charts, KPIs, and dashboards update automatically
Dashboard Pages Explained
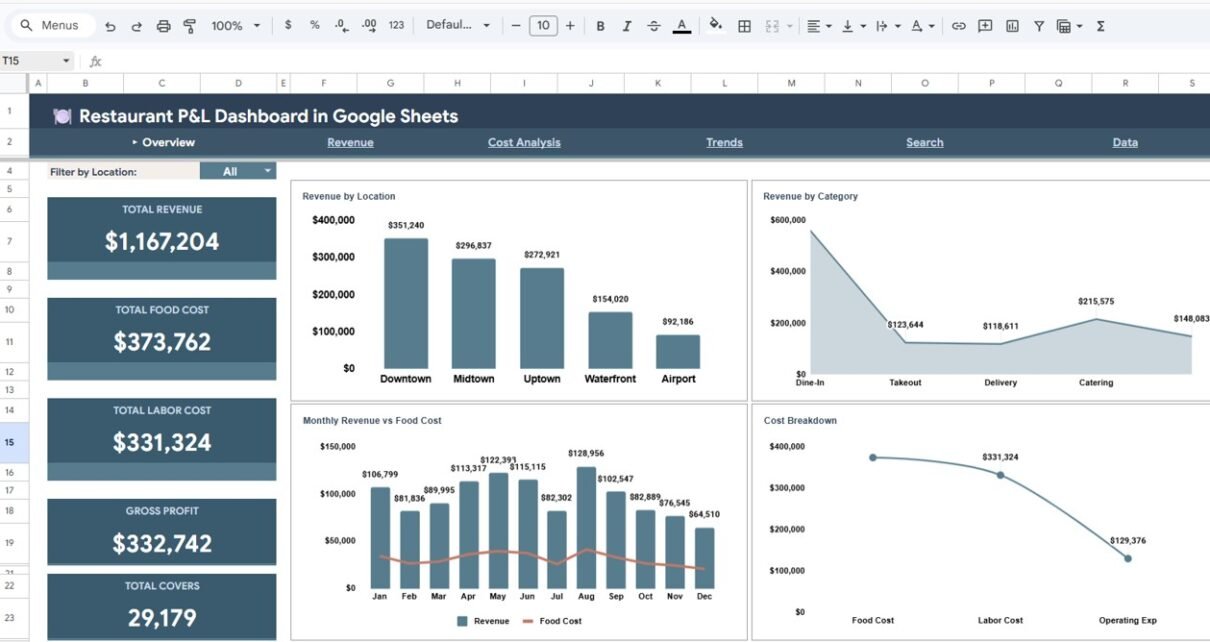
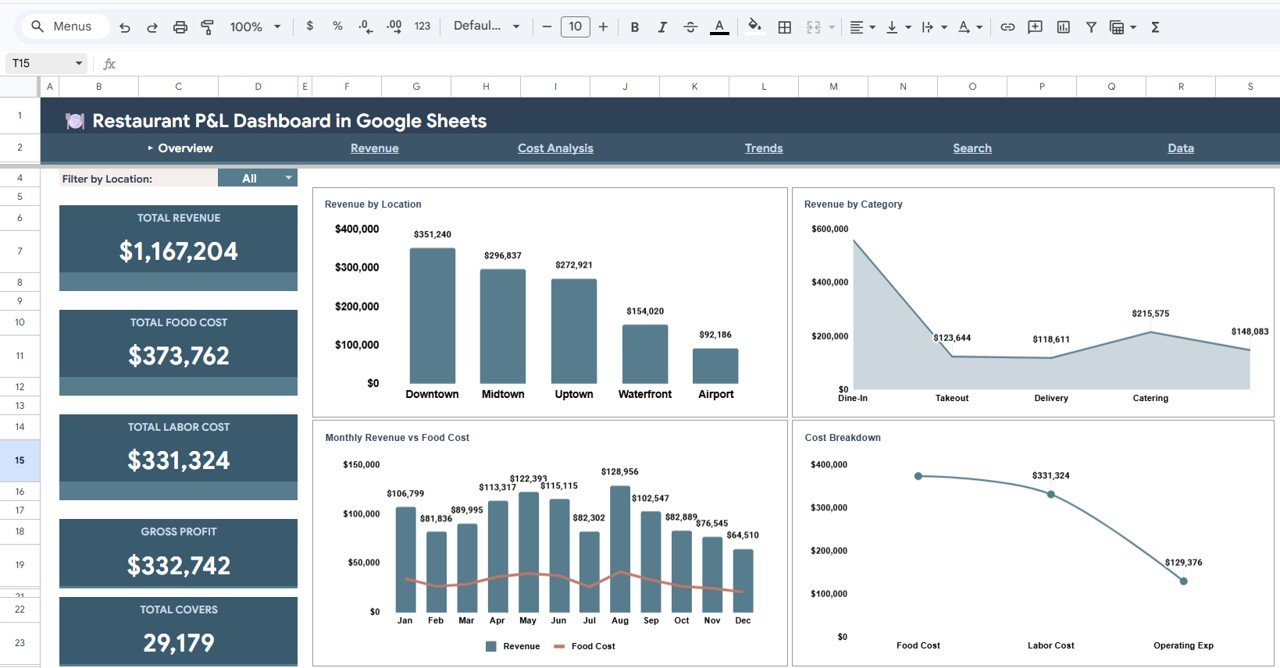
1. Overview Page
The Overview page is the main command center of the Restaurant P&L Dashboard in Google Sheets. At the top, 5 high-level KPI cards display your Total Revenue, Total Food Cost, Total Labor Cost, Gross Profit, and Total Covers at a glance. Below the cards, 4 interactive charts provide deeper analysis: Revenue by Location shows how each branch contributes to total revenue, Revenue by Category breaks down income by food, beverage, and other categories, Monthly Revenue vs Food Cost compares your top-line revenue against your primary cost driver over time, and Cost Breakdown by Cost Type visualizes how food, labor, and operating costs are distributed. Multiple slicers allow you to filter the entire Overview page by location, category, or date range for quick, targeted analysis.
Restaurant P&L Dashboard in Google Sheets
2. Revenue Page
The Revenue page dives deep into income analysis with 3 focused charts. Revenue by Day of Week identifies which days generate the most revenue, helping you optimize staffing and promotions. Dine-In vs Takeout by Location compares how each restaurant branch performs across different service channels. Monthly Covers and Avg Check tracks guest traffic and average spending per cover over time, giving you insights into customer behavior and pricing effectiveness.
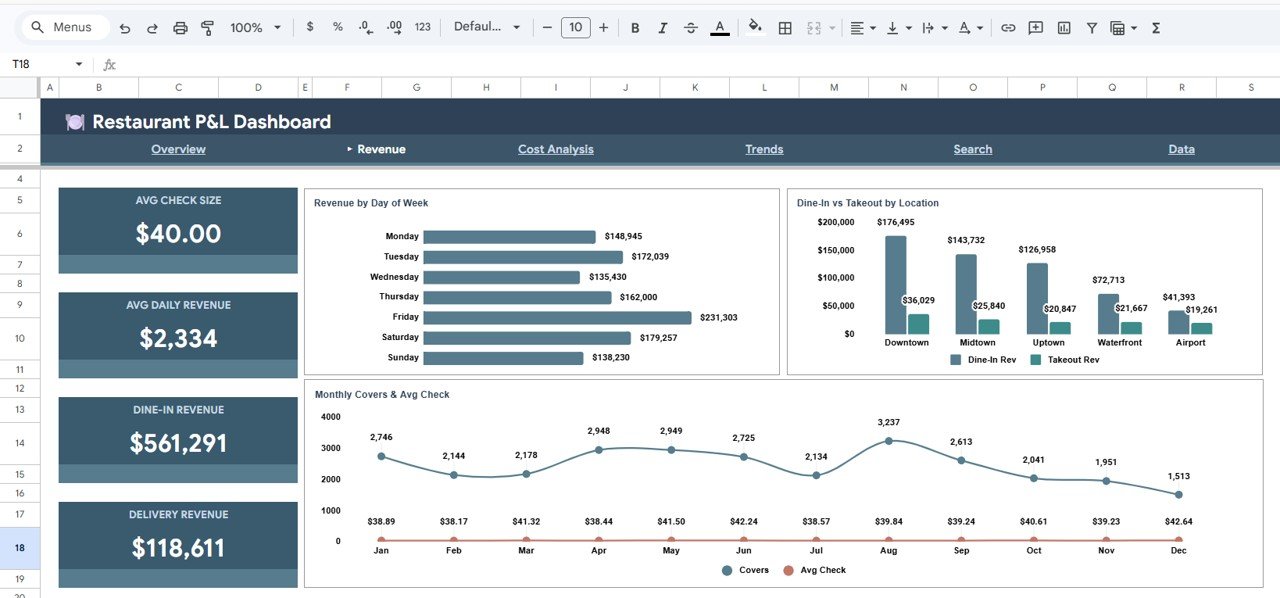
Revenue Analysis Page
3. Cost Analysis Page
The Cost Analysis page provides granular visibility into your restaurant’s cost structure with 3 analytical charts. Food Cost % by Location benchmarks food cost percentages across all branches so you can identify locations with cost control issues. Food vs Labor Cost by Category reveals which revenue categories carry the highest cost burden. Monthly Cost Breakdown by Cost Type shows how food, labor, and operating costs fluctuate month over month, helping you spot trends and take corrective action early.

Cost Analysis Page
4. Trends Page
The Trends page focuses on long-term financial patterns with 3 trend-based charts. Monthly Revenue vs Total Cost visualizes the gap between income and expenses over time — an expanding gap means growing profitability, while a narrowing gap signals trouble. Net Profit by Location compares the bottom-line performance of each branch. Cumulative Revenue YTD by Month tracks your year-to-date revenue accumulation, helping you assess whether you are on track to meet annual targets.

Trends Page
5. Search Sheet Tab
The Search page offers a convenient lookup functionality. Select any Transaction ID from the dropdown, and the page instantly displays the full transaction details including Transaction ID, Date, Location, Revenue Category, Revenue, Food Cost, Labor Cost, Operating Expense, Covers, and Avg Check. This is perfect for auditing specific transactions or investigating anomalies in your P&L data.
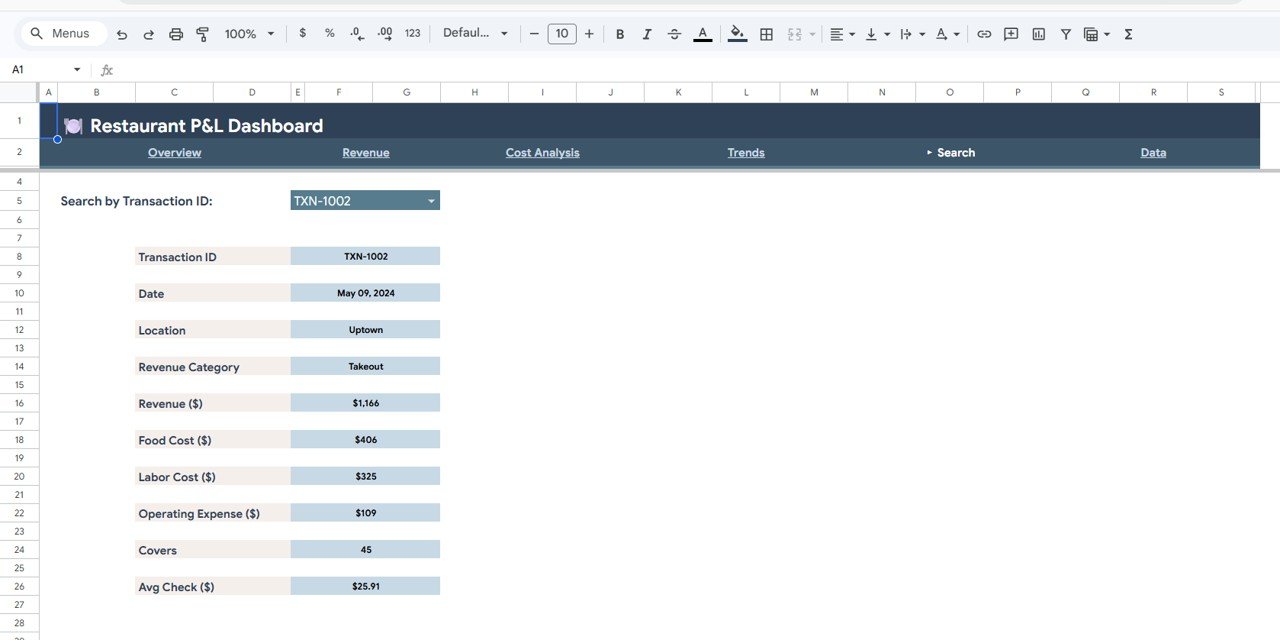
Search Sheet Tab
6. Data Sheet Tab
The Data sheet is where all your restaurant transaction records are stored. It contains sample data in the correct format — simply replace it with your own records and the entire dashboard updates automatically. Each row represents a single transaction with fields for date, location, revenue category, revenue amount, food cost, labor cost, operating expense, number of covers, and average check.
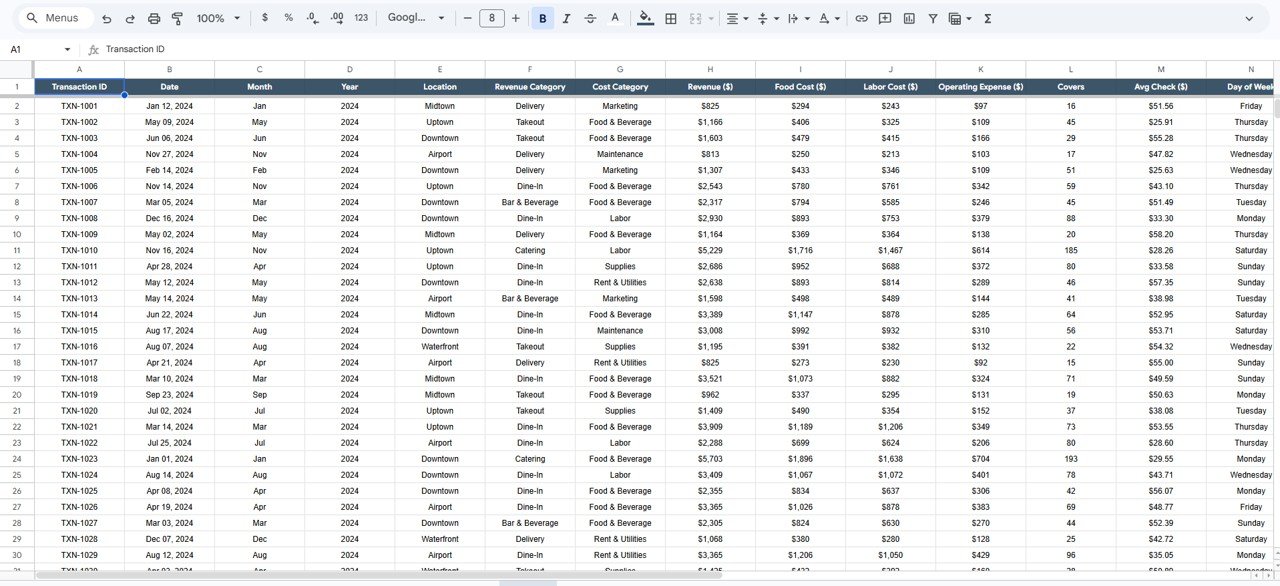
Data Sheet Tab
Advantages of Restaurant P&L Dashboard in Google Sheets
Click here to Purchase Restaurant P&L Dashboard in Google Sheets
- No Software Installation — Runs entirely in your browser via Google Drive. No Excel, no Power BI desktop, no plugins needed.
- Real-Time Collaboration — Share with your finance team, general managers, or accountants and collaborate on the same file simultaneously.
- Access Anywhere — Works on desktop, tablet, and mobile — check your restaurant’s P&L from anywhere.
- Multi-Branch Comparison — Compare revenue, costs, and profitability across all your restaurant locations in one view.
- Automated Calculations — All KPIs, charts, and metrics update automatically when you add new data — zero manual effort.
- Professional Presentation — Clean design with color-coded visuals makes this ideal for stakeholder presentations and board meetings.
Opportunities for Improvement
- Adding a dedicated Profit Margin % KPI card on the Overview page would provide an even quicker profitability snapshot.
- A monthly target vs actual comparison chart could help restaurant managers set and track financial goals.
- Integrating a labor productivity metric (revenue per labor hour) would enhance the Cost Analysis page.
- Adding a seasonal analysis view could help restaurant chains plan for peak and off-peak periods more effectively.
Best Practices for Using This Dashboard
Click here to Purchase Restaurant P&L Dashboard in Google Sheets
- Update Data Weekly — For the most accurate insights, enter your restaurant transaction data at least once a week.
- Standardize Location Names — Use consistent naming conventions for restaurant locations across all records to ensure proper filtering and chart grouping.
- Review Food Cost % Monthly — Industry best practice is to keep food cost between 28-35%. Use the Cost Analysis page to monitor this benchmark by location.
- Use Slicers for Meetings — During management reviews, use the built-in slicers to drill into specific locations or time periods for focused discussion.
- Compare Dine-In vs Takeout Trends — Use the Revenue page to identify shifts in service channel preferences and adjust your operations accordingly.
Explore Relevant Templates
If you found this template useful, check out these related dashboards on NextGenTemplates:
- Restaurant Profit and Loss Dashboard in HTML — A browser-based version with interactive JavaScript charts for those who prefer HTML dashboards.
- Restaurant P&L Dashboard in Power BI — Advanced Power BI version with DAX measures and drill-through capabilities.
- Restaurant P&L Dashboard in Excel — The Excel version for users who prefer desktop-based reporting.
- Food and Beverage Dashboard in Google Sheets — Broader F&B analytics covering food and beverage performance metrics.
- Food Service KPI Scorecard in Google Sheets — A compact KPI scorecard for food service operations.
Frequently Asked Questions
Click here to Purchase Restaurant P&L Dashboard in Google Sheets
What is the best Google Sheets template for restaurant profit and loss tracking?
The Restaurant P&L Dashboard in Google Sheets from NextGenTemplates is one of the most comprehensive options available. It includes 6 interactive pages, 5 KPI cards, 13+ charts, multi-location support, built-in slicers, and a transaction search feature — everything a restaurant needs for detailed P&L analysis in Google Sheets.
How do I track restaurant food cost percentage in Google Sheets?
The Restaurant P&L Dashboard in Google Sheets includes a dedicated Cost Analysis page with a Food Cost % by Location chart that automatically calculates and displays food cost percentages for each restaurant branch. Simply enter your transaction data and the dashboard handles the calculations.
Can I compare multiple restaurant locations in one dashboard?
Yes. The dashboard is built for multi-location analysis. Charts like Revenue by Location, Net Profit by Location, Food Cost % by Location, and Dine-In vs Takeout by Location let you compare branches directly. Built-in slicers also let you filter the entire dashboard by a specific location.
Do I need to know Google Sheets formulas to use this template?
No. The template is fully automated. Replace the sample data in the Data sheet with your own restaurant records and all 5 dashboard pages, KPI cards, and charts update automatically. No formulas to write and no macros to enable.
What data do I need to enter for this dashboard to work?
Each transaction record requires: Date, Location, Revenue Category, Revenue Amount, Food Cost, Labor Cost, Operating Expense, Number of Covers, and Average Check. Enter this data in the Data sheet tab and the dashboard does the rest.
Is this dashboard available in Excel or Power BI too?
Yes. NextGenTemplates offers the Restaurant P&L Dashboard in Excel, Power BI, and HTML formats as well. Choose the platform that works best for your workflow.
Conclusion
The Restaurant P&L Dashboard in Google Sheets is a must-have tool for any restaurant owner, manager, or finance professional who wants to transform raw transaction data into clear, actionable financial insights. With 6 dedicated pages, 13+ interactive charts, 5 KPI cards, multi-location comparison, and a built-in transaction search, this template covers every aspect of restaurant profit and loss analysis — all within the familiar, cloud-based Google Sheets environment.
Click here to Purchase Restaurant P&L Dashboard in Google Sheets
For more dashboard templates and step-by-step tutorials, visit our YouTube channel: Youtube.com/@NeoTechNavigators
Click here to Purchase Restaurant P&L Dashboard in Google Sheets