Sales and Revenue Command Center Dashboard in HTML is a professionally designed, interactive, browser-based analytics template built for sales directors, revenue operations managers, VP of sales, and business leaders who need to monitor total revenue, deal pipelines, win rates, team performance, and revenue trends — all from one powerful HTML Dashboard that works on any device. This template includes 5 interactive dashboard pages covering Overview, Revenue Analysis, Sales Pipeline, Team Performance, and a detailed Data View, making it one of the most comprehensive sales analytics solutions available for browser-based reporting.
Whether you run a startup sales team or oversee enterprise-level revenue operations, this dashboard transforms raw sales data into stunning, actionable visual insights. No software installation needed — simply open in any modern web browser and start tracking your sales performance instantly. If you have been searching for a modern, data-driven way to analyze sales pipeline health and revenue trends, the Sales and Revenue Command Center Dashboard in HTML is the solution you need.
Click here to Purchase Sales and Revenue Command Center Dashboard in HTML
Key Features of Sales and Revenue Command Center Dashboard in HTML
This dashboard includes 5 interactive dashboard pages with dynamic KPI cards, interactive charts, smart filtering options, and CSV export capabilities. The Sales and Revenue Command Center Dashboard in HTML tracks 5 key performance indicators including Total Revenue, Total Deals, Win Rate, Pipeline Value, and Attainment. It also features 13+ analytical charts covering revenue trends, pipeline health, team performance, and deal distribution analysis.
- 5 Interactive Pages — Navigate between Overview, Revenue Analysis, Sales Pipeline, Team Performance, and Data View tabs to explore sales data from every angle.
- 5 Dynamic KPI Cards — Track Total Revenue, Total Deals, Win Rate, Pipeline Value, and Attainment at a glance on the main overview page.
- Advanced Slicers and Filters — Filter the entire dashboard instantly by region, department, product line, and time period for targeted sales analysis.
- Revenue Deep-Dive Analytics — Analyze Revenue Trend MTD vs YTD, Revenue by Product Line, Average Deal Size by Quarter, and Revenue by Customer Segment.
- Pipeline Health Monitoring — Track Pipeline by Stage, Pipeline by Close Month, and Top Deals by Value to focus on high-impact opportunities.
- Team Performance Tracking — Compare Revenue by Sales Rep, Win Rate by Rep, and Department Ranking to coach your team effectively.
- Data View with Export — Browse all records with search, sort, pagination, and one-click CSV export for offline analysis.
- Zero Installation Required — Works instantly in any modern browser without plugins, extensions, or desktop software.
Dashboard Pages Explained
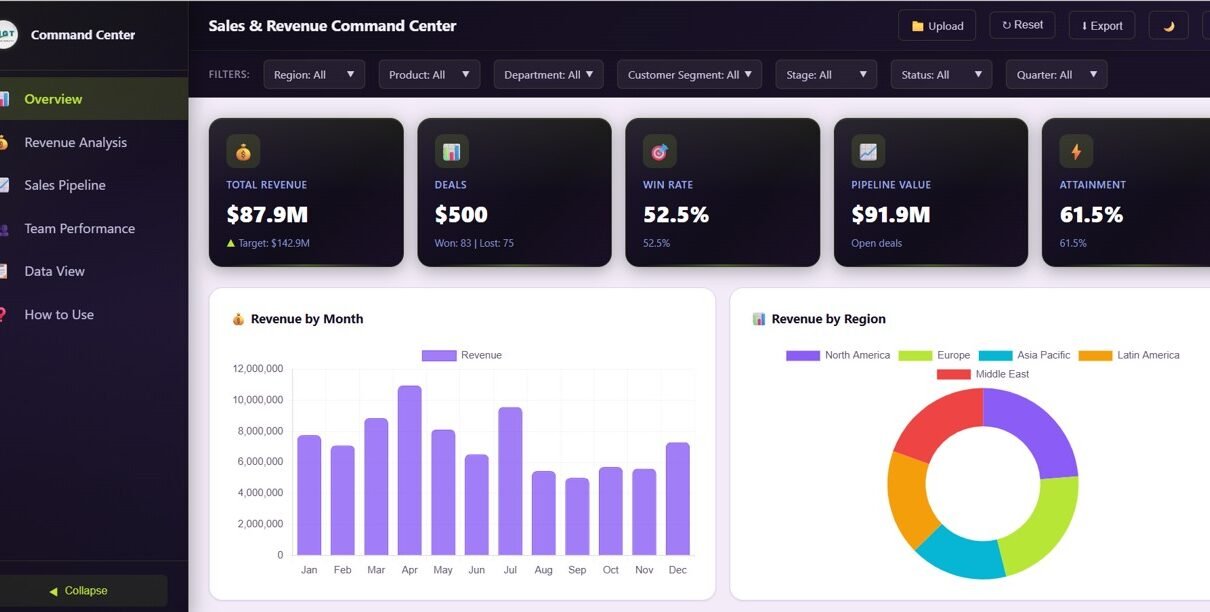
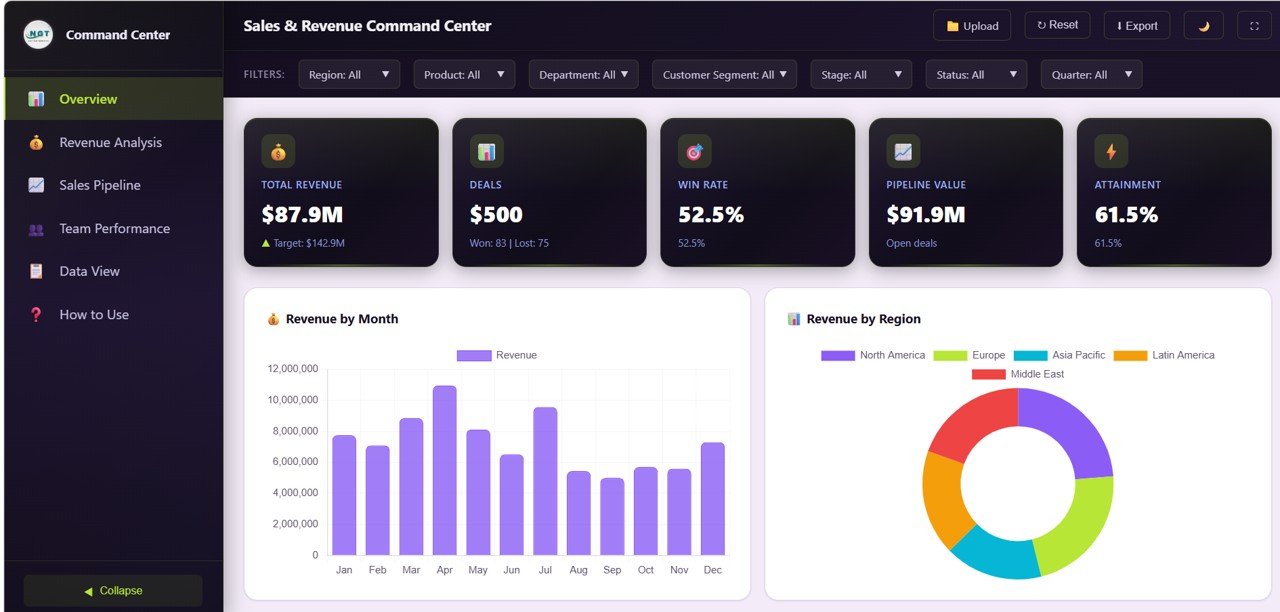
1. Overview Page
The main landing page features 5 high-level KPI cards showing Total Revenue, Total Deals, Win Rate, Pipeline Value, and Attainment. Below the cards, you will find interactive charts that provide instant analysis: Revenue by Month tracks monthly revenue trends over time, Revenue by Region compares performance across geographic areas, Target vs Actual by Department measures quota attainment per team, and Deal Status Distribution reveals how deals are spread across various stages. Multiple slicers allow you to filter the entire dashboard for quick, focused analysis.
Overview
2. Revenue Analysis
This page dives deep into your revenue streams with four analytical charts. Revenue Trend MTD vs YTD compares month-to-date against year-to-date performance so you can gauge whether you are on track. Revenue by Product Line breaks down income across product categories to identify top performers. Average Deal Size by Quarter tracks deal value trends over time to measure sales efficiency. Revenue by Customer Segment identifies which customer groups drive the most revenue and where expansion opportunities exist.
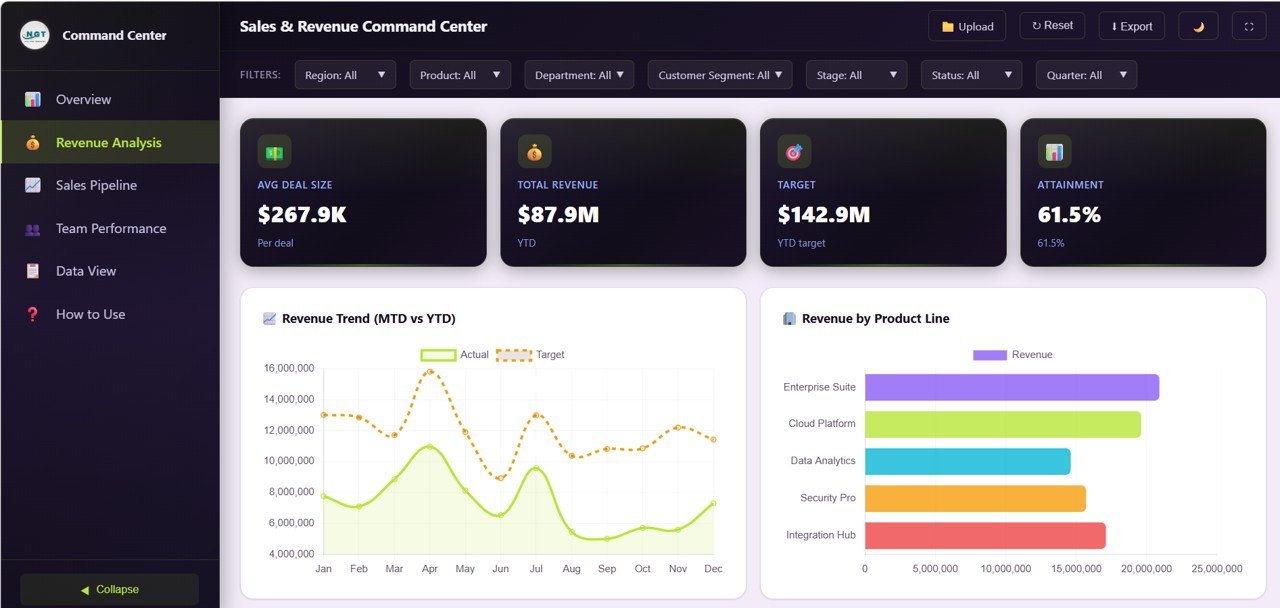
Revenue Analysis
3. Sales Pipeline
Monitor your pipeline health with three focused visualizations. Pipeline by Stage shows how deals flow through the sales funnel from qualification to closure. Pipeline by Close Month projects expected revenue by closing period so you can forecast accurately. Top Deals by Value highlights your highest-value opportunities that deserve focused attention and prioritized follow-up from your sales team.
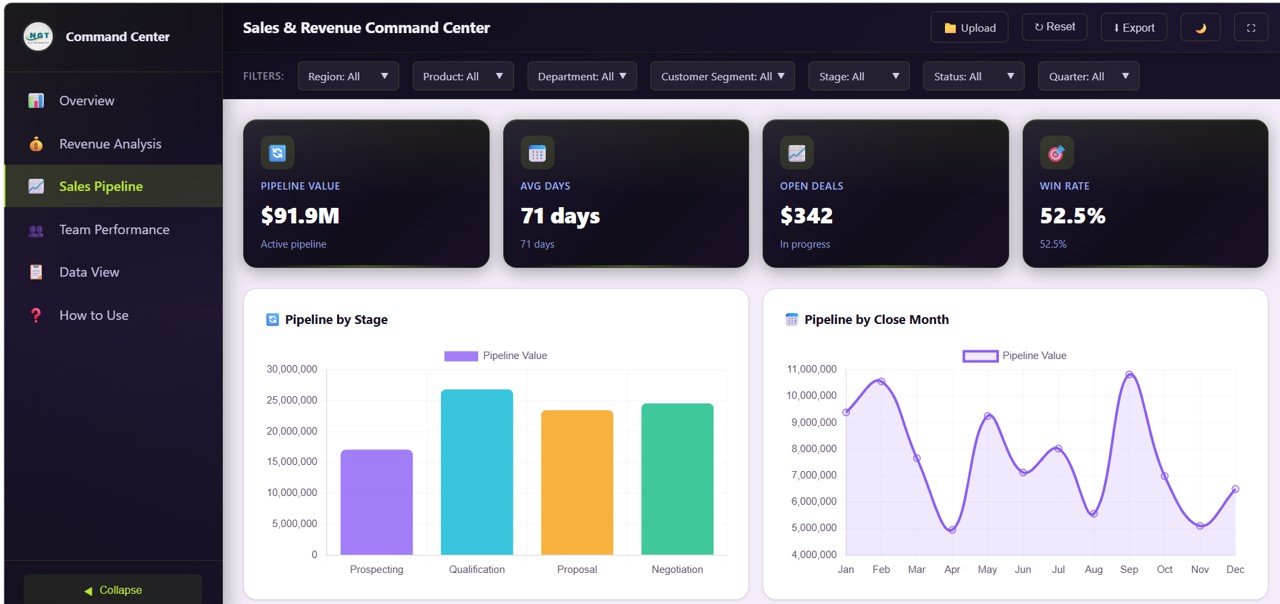
Sales Pipeline
4. Team Performance
Evaluate your sales team’s effectiveness with three performance-focused charts. Revenue by Sales Rep compares individual contribution to overall revenue, helping you identify top producers. Win Rate by Rep measures closing effectiveness across team members to pinpoint coaching opportunities. Department Ranking shows which departments are hitting their targets and which need additional support or resources.
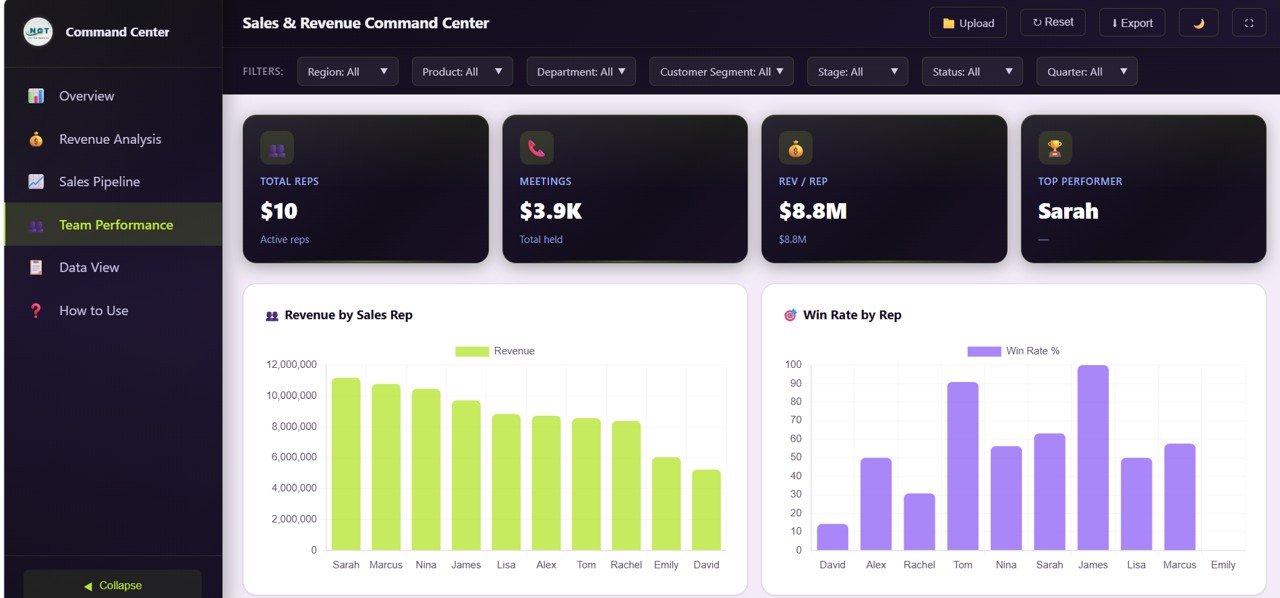
Team Performance
5. Data View
This is the detailed data table page. Here you can see all the records with search, sort, and pagination features. You can also export the filtered data to CSV for further analysis in Excel, Google Sheets, or any other spreadsheet application. This page is perfect for auditing individual deals and drilling into specific data points.
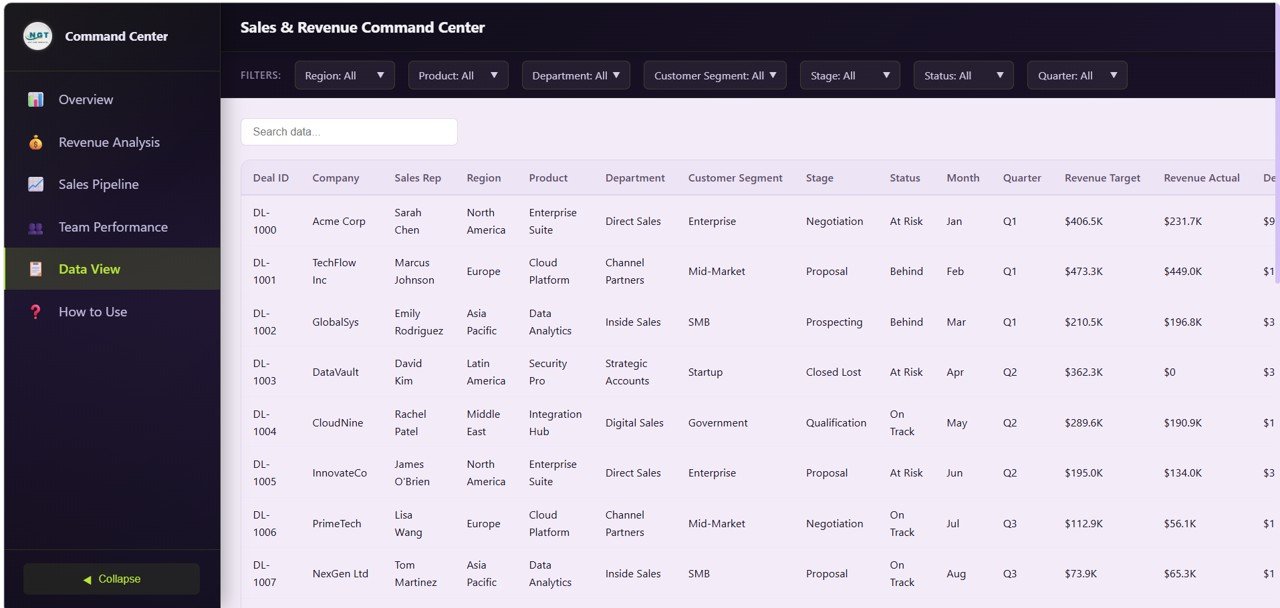
Data View
Advantages of Sales and Revenue Command Center Dashboard in HTML
The Sales and Revenue Command Center Dashboard in HTML offers several compelling advantages for modern sales organizations. First, it runs entirely in the browser with zero installation — no Excel, no Power BI, no subscriptions needed. Second, the professional dark-theme SaaS-style design gives your sales reporting an enterprise-grade look that impresses stakeholders. Third, real-time filtering with slicers enables instant drill-down into specific regions, departments, or time periods. Fourth, the 5-page structure provides a complete command center experience from high-level KPIs to granular deal-level data. Fifth, the one-click CSV export from the Data View page makes it easy to share filtered data with team members who prefer spreadsheets.
Opportunities for Improvement
While the dashboard covers the core sales analytics needs comprehensively, there are areas where users might want to extend functionality. Power users could add custom date range selectors for more granular time-based filtering. Integration with live CRM data feeds through API connections could enable real-time dashboard updates. Adding email-based alerts for deals approaching close dates or pipeline drops below threshold values would enhance proactive sales management. Users with web development skills could also customize the color scheme or add additional chart types to match their organization’s specific reporting needs.
Best Practices for Using This Dashboard
Click here to Purchase Sales and Revenue Command Center Dashboard in HTML
To get the most value from the Sales and Revenue Command Center Dashboard in HTML, follow these recommendations. Update your sales data regularly — ideally weekly — to ensure the dashboard reflects the most current pipeline and revenue status. Use the Overview page for daily standups and quick health checks, then dive into specific pages for detailed analysis during weekly reviews. Leverage the Team Performance page during one-on-one coaching sessions with sales reps to discuss win rates and quota achievement with data-backed insights. Export filtered data from the Data View page before quarterly business reviews to prepare supporting documentation. Share the HTML file directly with stakeholders — since it runs in any browser, everyone can explore the dashboard independently without needing special software.
Explore Relevant Templates
If you are looking for complementary analytics solutions, check out these related templates from NextGenTemplates:
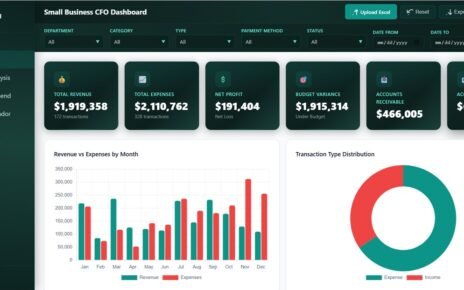
- Customer Relationship Management (CRM) Dashboard in HTML — Track customer interactions, deal pipelines, win rates, and account manager performance with interactive analytics.
- SaaS Metrics Dashboard in HTML — Monitor MRR, ARR, NPS, CSAT, and churn risk with 5 interactive analytics pages.
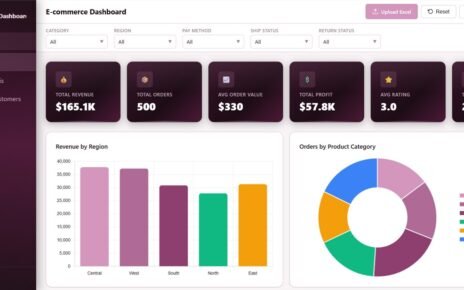
- Etsy Seller Analytics Dashboard in HTML — Analyze e-commerce sales, revenue trends, and seller performance metrics.
- Vendor Performance Dashboard in HTML — Evaluate vendor quality, delivery, cost, and compliance with interactive scoring.
Browse all HTML Dashboard Templates for more interactive analytics solutions.
Frequently Asked Questions
Click here to Purchase Sales and Revenue Command Center Dashboard in HTML
What KPIs does the Sales and Revenue Command Center Dashboard in HTML track?
The Sales and Revenue Command Center Dashboard in HTML tracks 5 key performance indicators: Total Revenue, Total Deals, Win Rate, Pipeline Value, and Attainment. It also includes 13+ analytical charts across 5 interactive pages covering revenue analysis, sales pipeline, and team performance.
Do I need any software to use this HTML dashboard template?
No. Simply unzip the downloaded file and open index.html in any modern web browser like Chrome, Firefox, or Edge. No additional software, plugins, or installation is required.
What is the best HTML dashboard template for tracking sales revenue and pipeline?
The Sales and Revenue Command Center Dashboard in HTML from NextGenTemplates is the best choice. It includes 5 interactive pages with KPI cards, 13+ charts, smart filters, and CSV export — all running in your browser without installation.
Can I customize the data in this sales dashboard?
Yes. Replace the sample data in the data file with your own sales and revenue data. All charts and KPIs update automatically when you refresh the page.
How does this dashboard help improve sales team performance?
The Team Performance page shows Revenue by Sales Rep, Win Rate by Rep, and Department Ranking. These insights help sales leaders identify top performers, coach underperformers, and allocate resources for maximum revenue impact.
Can I export data from this dashboard?
Yes. The Data View tab includes search, sort, pagination, and one-click CSV export functionality for further analysis and reporting.
Conclusion
Click here to Purchase Sales and Revenue Command Center Dashboard in HTML
The Sales and Revenue Command Center Dashboard in HTML is a powerful, ready-to-use analytics solution for any sales organization looking to centralize their revenue monitoring, pipeline tracking, and team performance analysis. With 5 interactive pages, 5 KPI cards, 13+ charts, smart filters, and CSV export — all running in your browser without installation — this template delivers enterprise-grade sales analytics at a fraction of the cost. Download it today and take command of your sales data.
Visit our YouTube channel for step-by-step video tutorials: Youtube.com/@NeoTechNavigators
Click here to Purchase Sales and Revenue Command Center Dashboard in HTML