Sustainability has become a major priority for modern organizations. Companies now focus on reducing environmental impact, optimizing energy consumption, managing water usage, and improving workspace efficiency. However, managing sustainability across multiple offices, departments, and facilities can become complex without proper analytics tools.
Many organizations still rely on scattered spreadsheets and manual reports to track sustainability metrics. As a result, managers often struggle to monitor energy usage, water consumption, workspace utilization, and environmental performance effectively.
Therefore, businesses increasingly adopt data-driven sustainability dashboards to track environmental performance and workplace efficiency. One powerful solution is the Smart Workplace Sustainability Dashboard in Google Sheets.
The Smart Workplace Sustainability Dashboard in Google Sheets is a ready-to-use analytics template designed to monitor workplace sustainability metrics such as energy consumption, water usage, workspace utilization, and environmental efficiency. Because Google Sheets allows cloud-based collaboration, teams can easily access and analyze sustainability data in real time.
This dashboard provides interactive charts, performance indicators, and analytical reports that help organizations make smarter environmental decisions.
In this article, we will explore everything about the Smart Workplace Sustainability Dashboard in Google Sheets, including its features, benefits, best practices, and frequently asked questions.
What is a Smart Workplace Sustainability Dashboard?
Click to Buy Smart Workplace Sustainability Dashboard in Google Sheets
A Smart Workplace Sustainability Dashboard is a data visualization and analytics tool that helps organizations monitor environmental performance across their workplace infrastructure.
It allows organizations to track sustainability metrics such as:
- Energy consumption
- Water usage
- Workspace utilization
- Department energy consumption
- Environmental cost metrics
- Waste generation
By presenting data through interactive charts and KPIs, the dashboard allows managers to identify inefficiencies and improve sustainability strategies.
Moreover, organizations can monitor sustainability performance across multiple dimensions such as regions, countries, buildings, departments, and workspace types.
Key Features of the Smart Workplace Sustainability Dashboard in Google Sheets
The Smart Workplace Sustainability Dashboard in Google Sheets contains multiple analytical sections that provide detailed insights into workplace sustainability.
The dashboard includes interactive filters, KPI cards, and visual charts to analyze performance.
Overview Page – Workplace Sustainability Summary
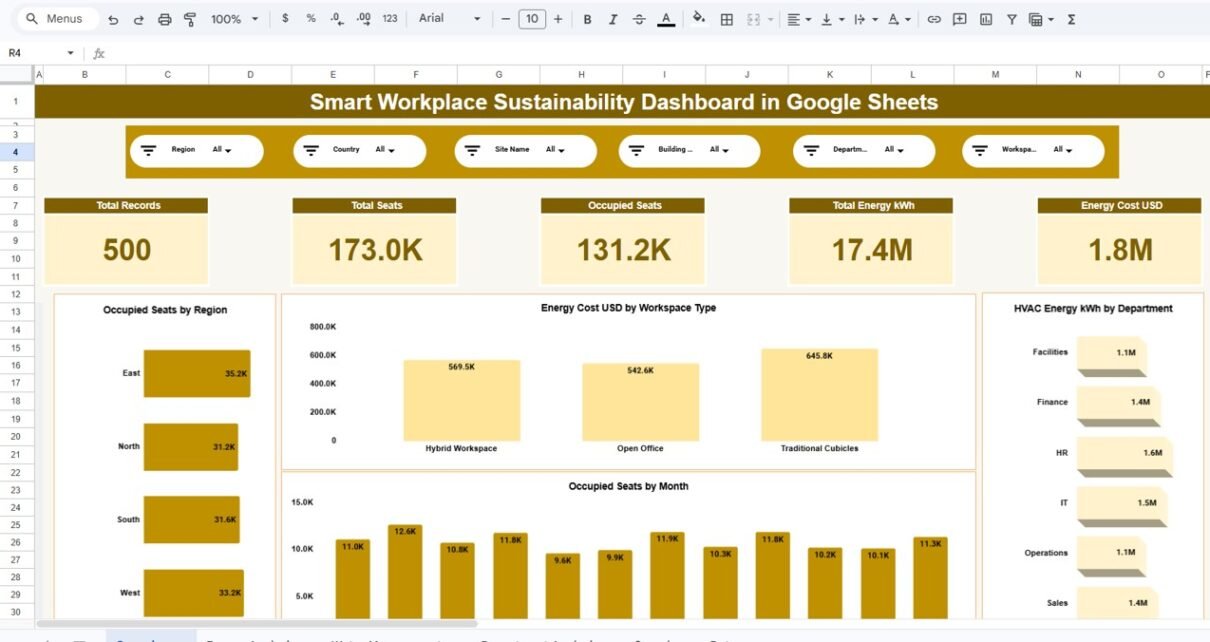
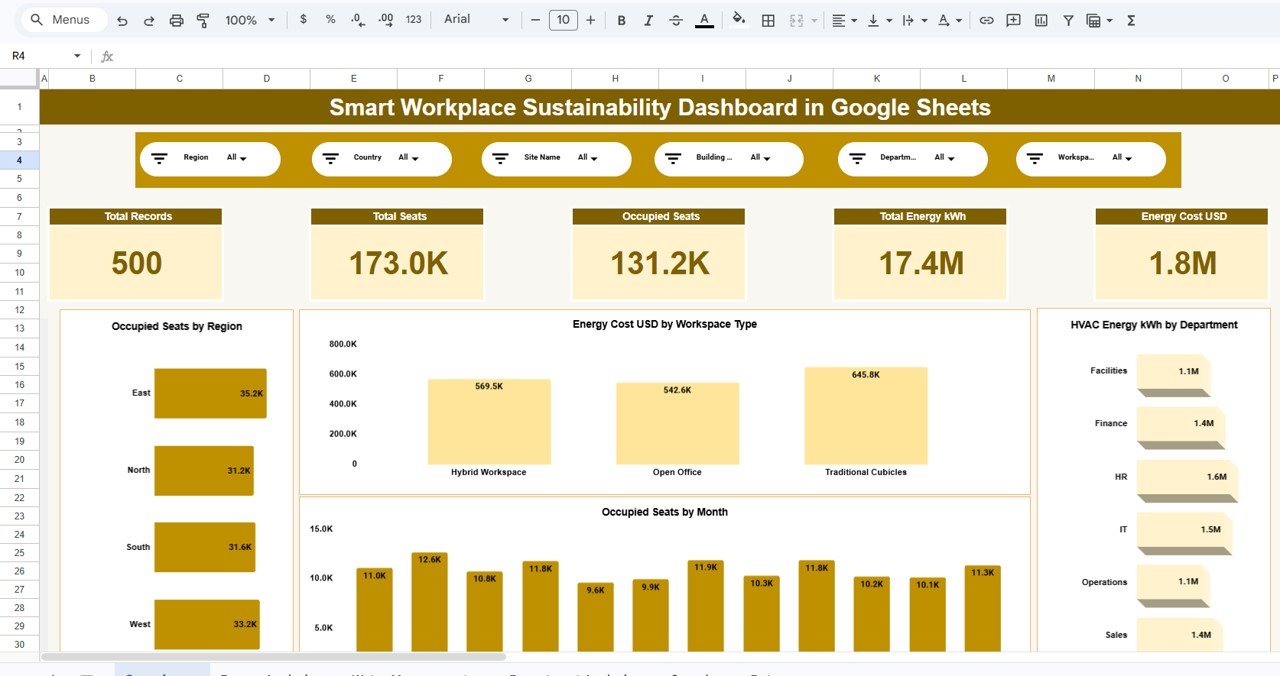
The main dashboard page provides a complete overview of workplace sustainability metrics.
At the top of the dashboard, users can apply multiple filters such as:
-
Region
-
Country
-
Site Name
-
Building
-
Department
-
Workspace Type
These filters allow users to analyze sustainability metrics for specific locations or departments.
KPI Cards on the Dashboard
Click to Buy Smart Workplace Sustainability Dashboard in Google Sheets
The dashboard includes several key performance indicators.
Total Records
This KPI shows the total number of sustainability records available in the dataset.
Total Seats
Displays the total seating capacity across workplace locations.
Occupied Seats
Shows the number of seats currently occupied across offices.
Total Energy Consumption
Displays the total energy consumption measured in kilowatt-hours (kWh).
Energy Cost
Shows the total cost of energy consumption.
These KPI cards provide quick insights into overall workplace sustainability performance.
Click to Buy Smart Workplace Sustainability Dashboard in Google Sheets
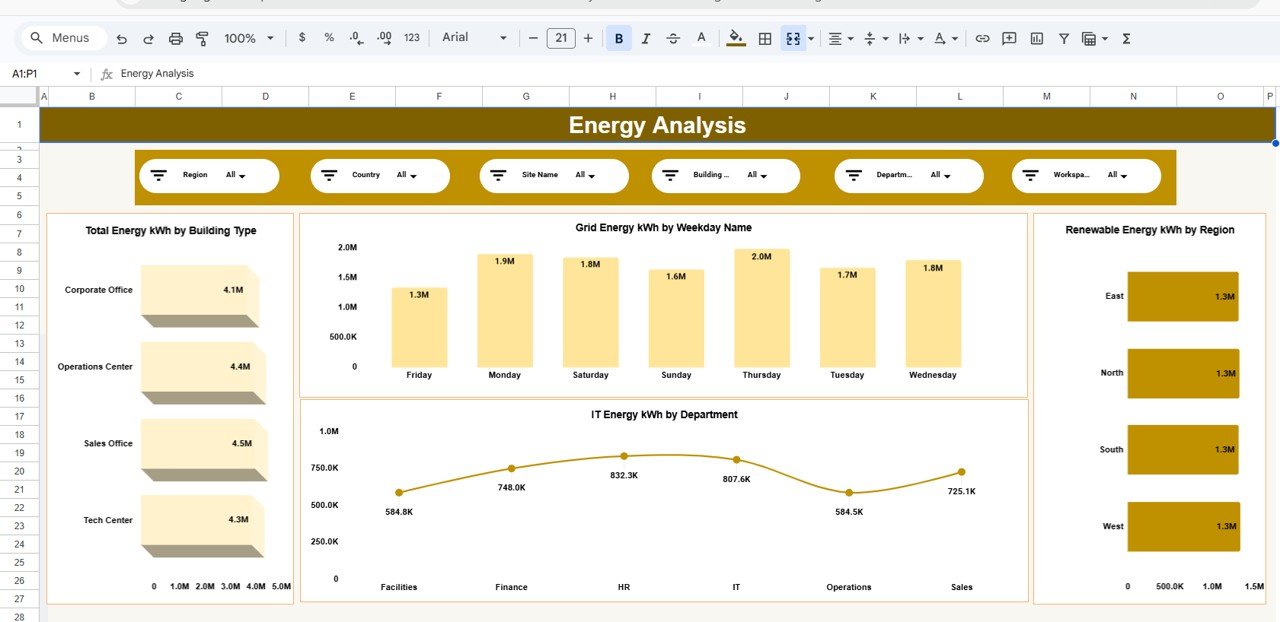
Energy Analysis Section
The Energy Analysis page provides detailed insights into electricity consumption across different locations and departments.
Energy Consumption by Building Type
This chart shows energy usage for different building types such as:
- Corporate Offices
- Operations Centers
- Sales Offices
- Tech Centers
This analysis helps organizations identify buildings that consume the most energy.
Grid Energy Consumption by Weekday
This chart shows electricity consumption by weekday.
Managers can analyze whether energy usage increases during certain days of the week.
This insight helps optimize operational schedules and reduce energy waste.
Renewable Energy Consumption by Region
This section displays renewable energy usage across regions such as:
- East
- North
- South
- West
Organizations can use this data to monitor renewable energy adoption across locations.
IT Energy Consumption by Department
This chart tracks energy consumption of IT systems across departments such as:
-
This insight helps identify departments with higher energy usage.
Click to Buy Smart Workplace Sustainability Dashboard in Google Sheets
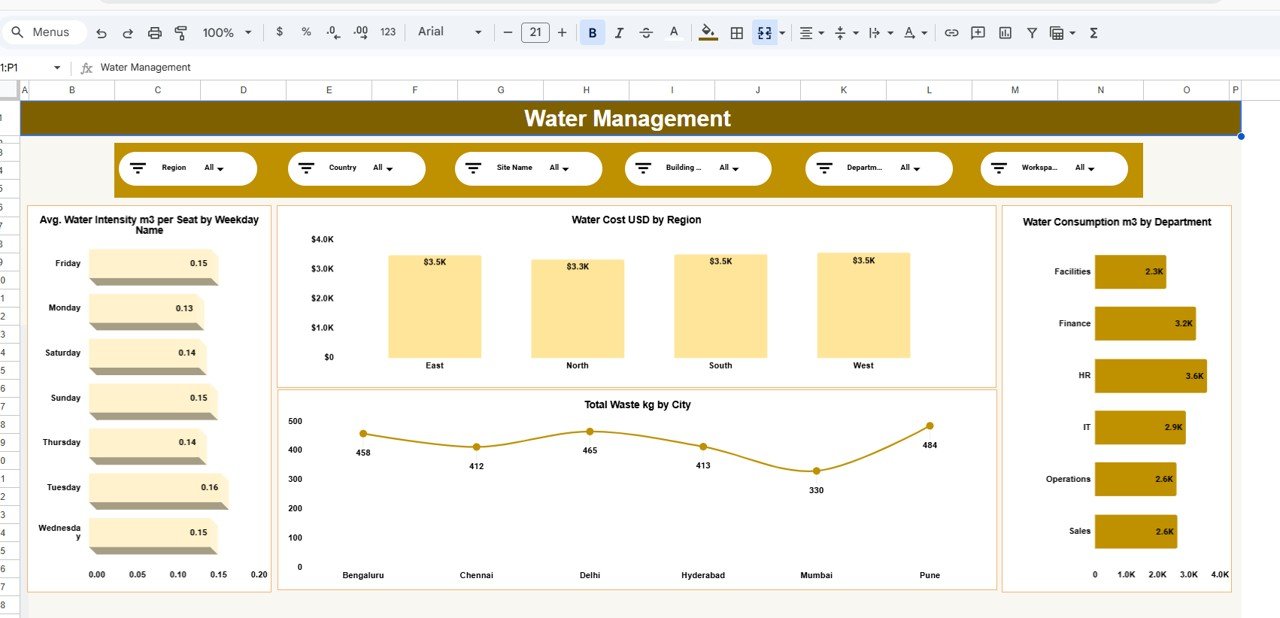
Water Management Section
Water conservation plays a critical role in workplace sustainability.
The Water Management page helps organizations monitor water consumption across locations.
Average Water Intensity per Seat
This chart measures the average water consumption per seat across weekdays.
Organizations can identify days with higher water usage and adjust operations accordingly.
Water Cost by Region
This chart displays water cost distribution across regions.
Managers can analyze regional cost differences and implement cost-saving measures.
Water Consumption by Department
This chart shows how different departments consume water resources.
Departments with high water usage can adopt conservation initiatives.
Total Waste by City
This analysis measures the amount of waste generated in different cities such as:
Organizations can use this data to monitor waste management performance.
Click to Buy Smart Workplace Sustainability Dashboard in Google Sheets
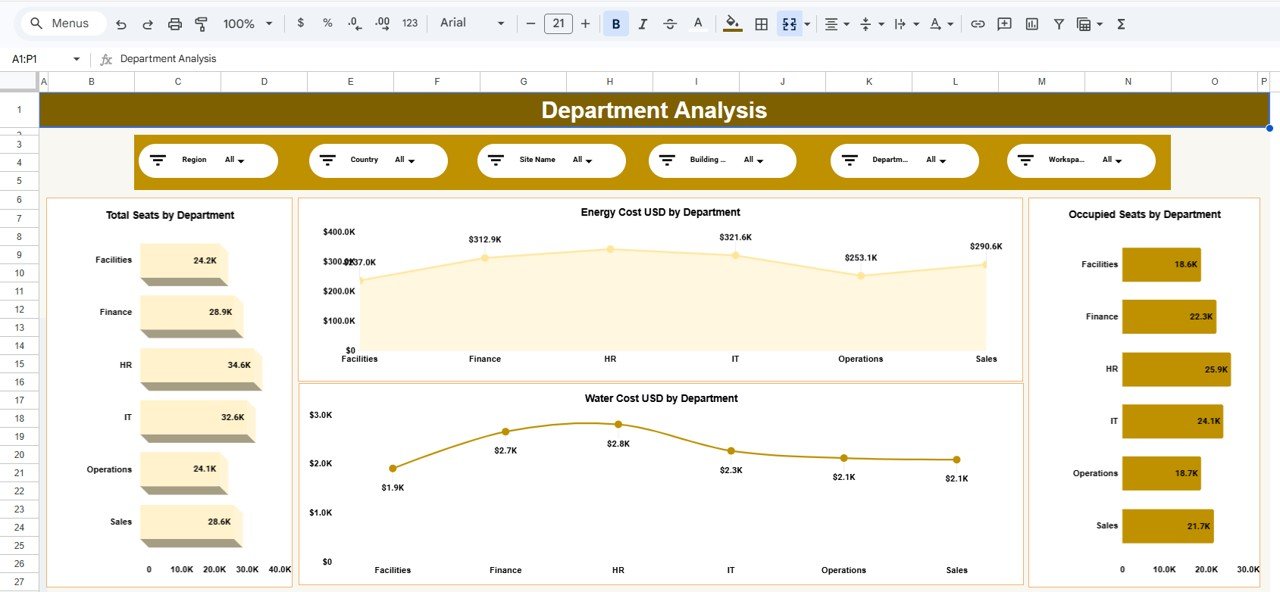
Department Analysis Section
The Department Analysis page focuses on sustainability metrics at the departmental level.
Total Seats by Department
This chart shows the seating capacity across departments.
Occupied Seats by Department
This chart tracks seat utilization across departments.
Managers can identify departments with underutilized workspaces.
Energy Cost by Department
This analysis measures electricity cost across departments.
High energy consumption departments can implement energy-saving strategies.
Water Cost by Department
This chart shows water cost trends across departments.
Organizations can use this data to implement water conservation policies.
Click to Buy Smart Workplace Sustainability Dashboard in Google Sheets
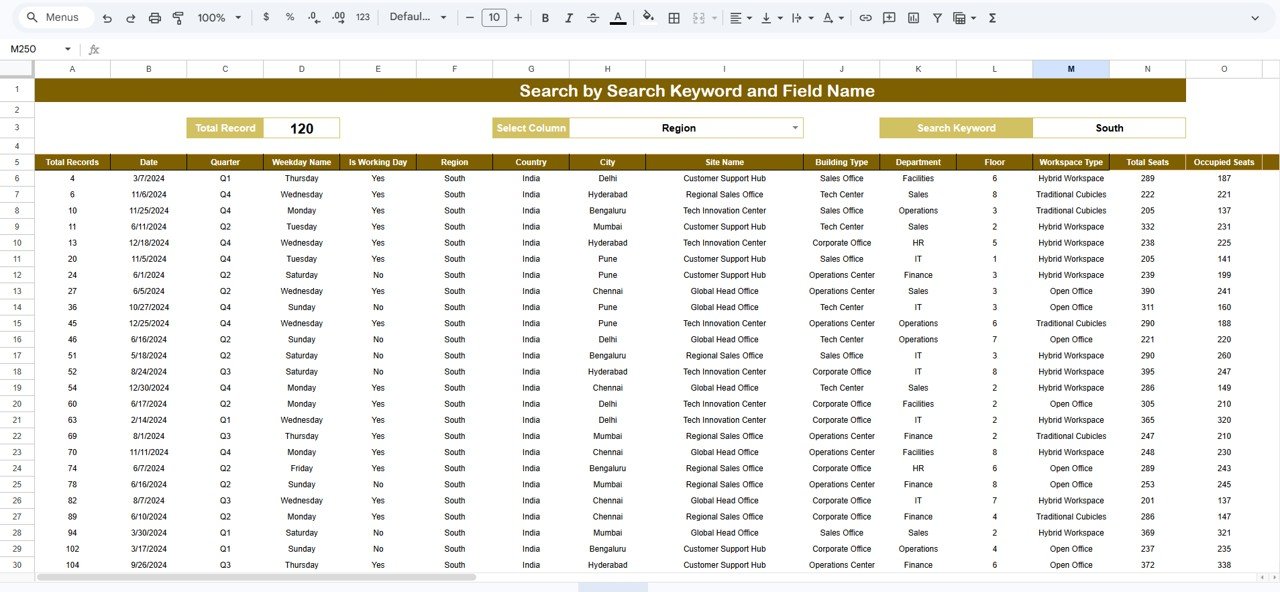
Data Search and Analysis Section
The dashboard also includes a Search by Keyword and Field Name feature.
This feature allows users to quickly filter and analyze specific records from the dataset.
Users can search by fields such as:
-
This feature improves data exploration and simplifies analysis.
Advantages of the Smart Workplace Sustainability Dashboard
Organizations gain many benefits by using this dashboard.
1. Centralized Sustainability Monitoring
All sustainability metrics remain in one dashboard.
2. Real-Time Collaboration
Google Sheets allows multiple users to update data simultaneously.
3. Improved Environmental Performance
Organizations can monitor sustainability metrics easily.
4. Better Resource Optimization
Managers can optimize energy, water, and workspace usage.
5. Cost Reduction
Energy and water cost analysis helps reduce operational expenses.
Best Practices for Using the Smart Workplace Sustainability Dashboard
Click to Buy Smart Workplace Sustainability Dashboard in Google Sheets
Organizations should follow certain best practices to maximize the dashboard’s value.
1. Update Data Regularly
Sustainability data should be updated frequently.
2. Monitor KPIs Monthly
Managers should review sustainability metrics regularly.
3. Set Environmental Targets
Organizations should define measurable sustainability goals.
4. Encourage Department Accountability
Departments should track their energy and water consumption.
5. Analyze Trends
Trend analysis helps organizations identify improvement opportunities.
How Does This Dashboard Improve Workplace Sustainability?
Click to Buy Smart Workplace Sustainability Dashboard in Google Sheets
The Smart Workplace Sustainability Dashboard helps organizations improve environmental performance by:
- Monitoring energy usage
- Tracking water consumption
- Measuring workspace utilization
- Analyzing environmental costs
- Supporting sustainability reporting
Therefore, organizations can make better environmental decisions and achieve sustainability goals.
Conclusion
Sustainability has become essential for modern workplaces. Organizations must continuously monitor energy usage, water consumption, and workspace efficiency to reduce environmental impact.
The Smart Workplace Sustainability Dashboard in Google Sheets provides a powerful yet simple solution for tracking workplace sustainability metrics.
Because the dashboard includes interactive filters, KPI cards, and analytical charts, organizations can gain deeper insights into their environmental performance.
Moreover, Google Sheets allows real-time collaboration, easy customization, and cloud accessibility.
Therefore, organizations can use this dashboard to improve sustainability, optimize resource usage, and build environmentally responsible workplaces.
Visit our YouTube channel to learn step-by-step video tutorials
Youtube.com/@NeotechNavigators
Watch the step-by-step video tutorial:
Click to Buy Smart Workplace Sustainability Dashboard in Google Sheets