Waste management has become one of the most important responsibilities for modern organizations, municipalities, and environmental agencies. As cities grow and industries expand, waste generation increases significantly. Therefore, organizations must track waste management performance carefully to ensure sustainability, efficiency, and regulatory compliance.
However, many waste management teams still rely on scattered spreadsheets, manual reports, and delayed performance reviews. As a result, decision-makers often struggle to monitor waste collection efficiency, recycling performance, landfill usage, and operational costs.
Therefore, organizations increasingly adopt data-driven tools to monitor environmental performance. One of the most practical and accessible solutions is the Waste Management KPI Scorecard in Google Sheets.
The Waste Management KPI Scorecard in Google Sheets is a ready-to-use template designed to track important waste management metrics using structured KPI monitoring. This scorecard includes 10 different KPIs that help organizations measure operational efficiency, sustainability performance, and waste reduction efforts.
Moreover, this template provides dynamic dashboards, trend analysis, and automated calculations that allow managers to analyze waste performance quickly. Because the scorecard runs in Google Sheets, teams can access the dashboard from anywhere and collaborate in real time.
In this article, we will explore everything about the Waste Management KPI Scorecard in Google Sheets, including its features, benefits, best practices, and frequently asked questions.
What is a Waste Management KPI Scorecard in Google Sheets?
Click to Buy Waste Management KPI Scorecard In Google Sheets
A Waste Management KPI Scorecard in Google Sheets is a performance monitoring tool that tracks waste-related metrics using structured dashboards and KPI reports.
Organizations use this scorecard to monitor key waste management indicators such as:
-
Waste collection performance
-
Recycling rate
-
Waste diversion rate
-
Landfill reduction
-
Waste processing efficiency
-
Environmental compliance metrics
Instead of analyzing waste management data manually, managers can use this scorecard to monitor performance visually.
Moreover, the scorecard automatically compares Actual performance, Targets, and Previous results, helping organizations quickly identify whether KPIs meet expectations.
Because the template uses interactive dashboards and automated formulas, it simplifies waste management analytics significantly.
Why Do Organizations Need Waste Management KPI Scorecards?
Waste management operations involve several processes such as waste collection, transportation, recycling, treatment, and disposal. Therefore, organizations must monitor performance continuously.
However, without proper monitoring tools, managers often struggle to track performance accurately.
A Waste Management KPI Scorecard helps organizations solve these problems.
1. Improves Environmental Monitoring
Organizations can monitor sustainability metrics and environmental performance more effectively.
2. Enables Data-Driven Decisions
Managers can analyze KPI trends and identify inefficiencies quickly.
3. Enhances Operational Efficiency
Waste collection, recycling programs, and disposal processes become easier to manage.
4. Improves Sustainability Reporting
Organizations can track waste reduction goals and sustainability targets.
5. Supports Compliance Monitoring
Environmental regulations require organizations to monitor waste performance carefully. KPI scorecards help ensure compliance.
Key Features of the Waste Management KPI Scorecard in Google Sheets
Click to Buy Waste Management KPI Scorecard In Google Sheets
The Waste Management KPI Scorecard in Google Sheets includes several powerful features that help users analyze waste management performance easily.
The template includes multiple sheets that support KPI monitoring, data entry, and performance analysis.
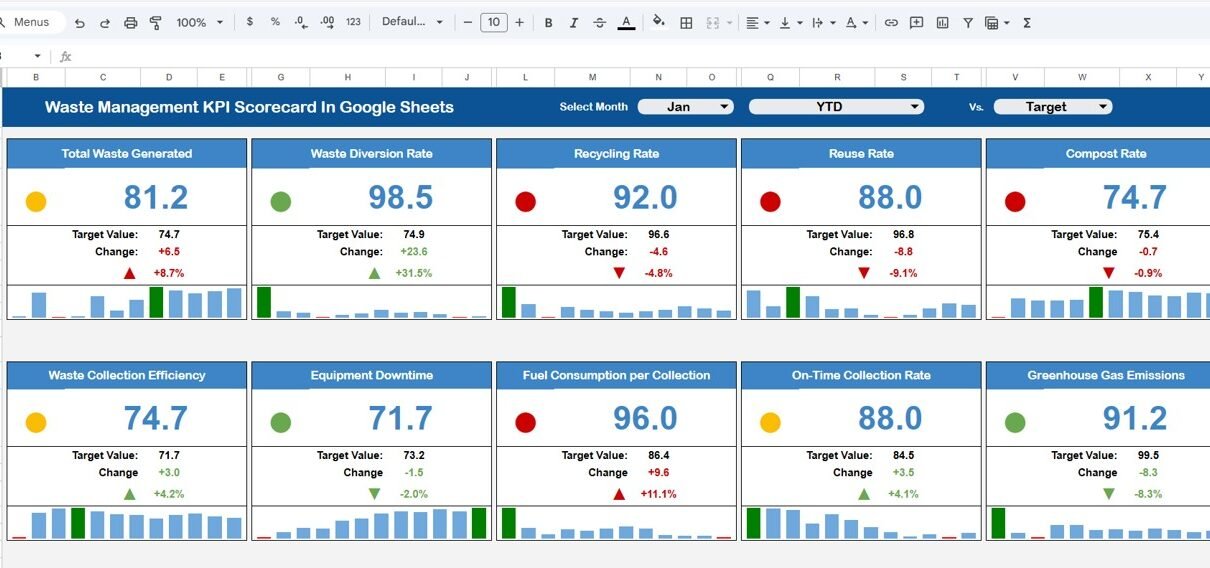
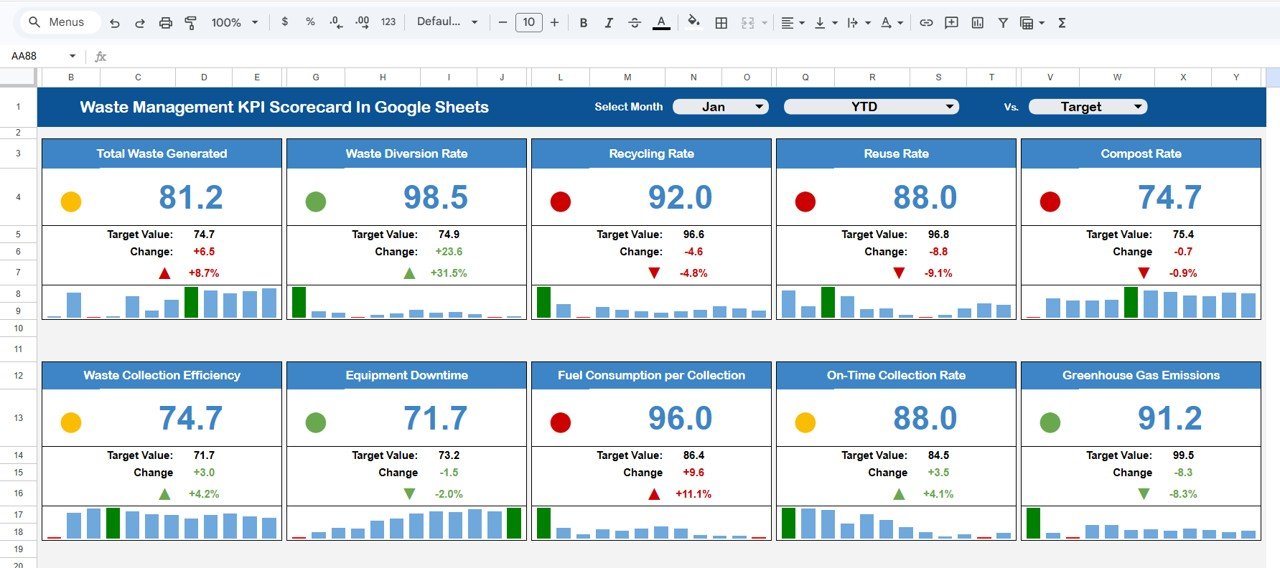
Dashboard Sheet – KPI Performance Overview
The Dashboard Sheet acts as the main page of the scorecard.
This sheet displays all KPI performance indicators in a structured format. The dashboard monitors 10 different KPIs to evaluate waste management performance.
At the top of the dashboard, users can select the month from the dropdown menu. Once users choose a month, the entire dashboard automatically updates.
As a result, managers can analyze monthly performance instantly.
The dashboard also provides two key options:
-
MTD (Month-To-Date) view
-
YTD (Year-To-Date) view
Users can click MTD to analyze monthly data and YTD to analyze yearly performance.
Performance Indicators in the Dashboard
Click to Buy Waste Management KPI Scorecard In Google Sheets
The dashboard compares different performance metrics such as:
-
Actual performance
-
Target values
-
Percentage variance
Additionally, the dashboard uses traffic light indicators and up/down arrows to display performance trends.
Traffic Light Indicators
Traffic light colors make it easier to understand KPI performance:
-
Green – KPI performing well
-
Yellow – Performance requires attention
-
Red – KPI performing below target
Arrow Indicators
Up and down arrows indicate percentage changes in performance.
-
Up Arrow – Improvement compared to target or previous results
-
Down Arrow – Decline in performance
Therefore, managers can quickly identify high-performing KPIs and areas that need improvement.
Click to Buy Waste Management KPI Scorecard In Google Sheets
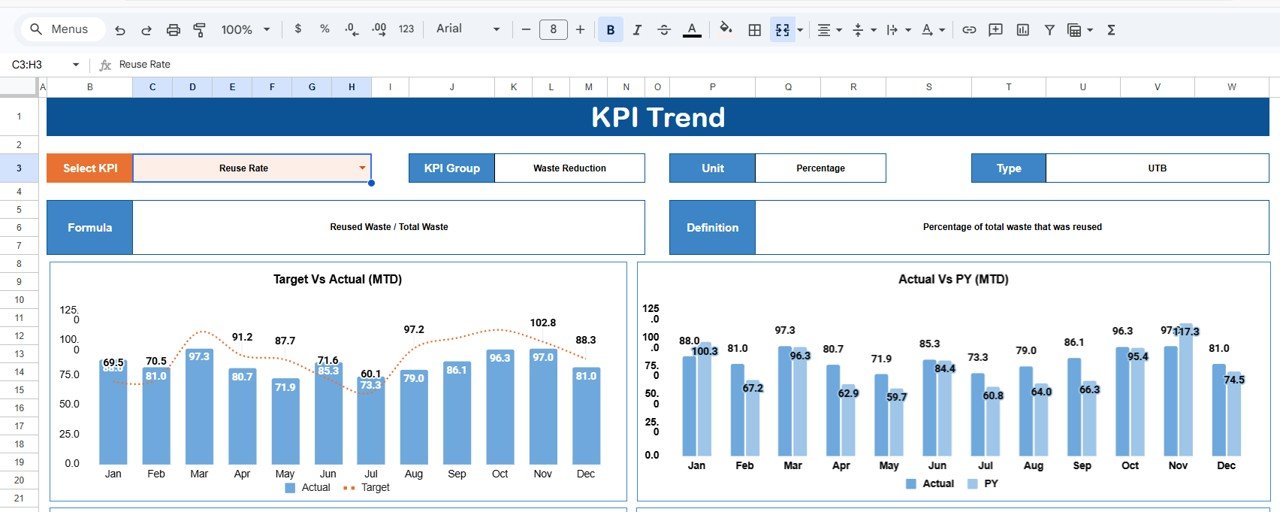
KPI Trend Sheet – KPI Performance Analysis
The KPI Trend Sheet helps users analyze the performance trend of individual KPIs.
Users can select a KPI name from the dropdown list available in cell C3.
Once a KPI is selected, the sheet automatically displays detailed information about that KPI.
The sheet includes the following information:
- KPI Group
- KPI Unit
- KPI Type (Lower the Better or Upper the Better)
- KPI Formula
- KPI Definition
Additionally, the sheet displays performance trends for the selected KPI, helping managers track changes over time.
Therefore, decision-makers can easily determine whether the KPI performance is improving or declining.
Click to Buy Waste Management KPI Scorecard In Google Sheets
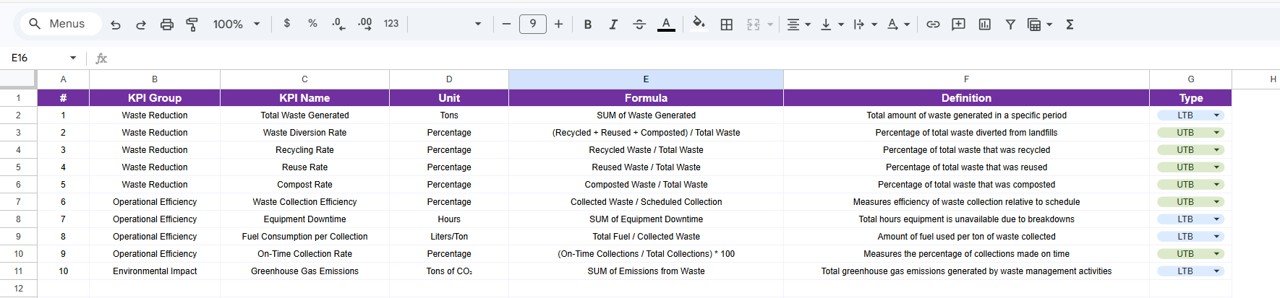
KPI Definition Sheet – KPI Documentation
The KPI Definition Sheet works as a reference library for all KPIs used in the scorecard.
Users must enter the following information:
- KPI Name
- KPI Group
- KPI Unit
- KPI Formula
- KPI Definition
This sheet ensures that every KPI is clearly documented.
As a result, all team members understand how each KPI is calculated and what it measures.
Moreover, clear KPI definitions improve transparency and reporting accuracy.
Click to Buy Waste Management KPI Scorecard In Google Sheets
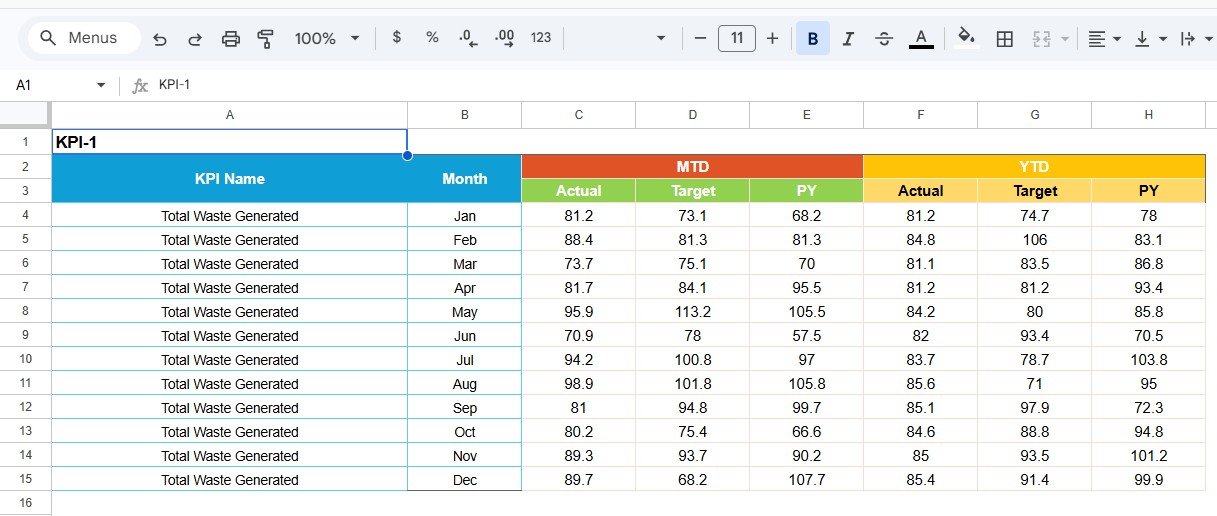
Data Input Sheet – Performance Data Entry
The Data Input Sheet serves as the primary data entry area.
Users must enter the waste management performance data here.
Once the data is entered, the dashboard automatically updates all KPI calculations.
This sheet usually contains information such as:
-
Monthly waste collection data
-
Recycling performance data
-
Waste processing metrics
-
Operational performance numbers
Because all data remains centralized in one sheet, organizations can manage information more efficiently.
Click to Buy Waste Management KPI Scorecard In Google Sheets
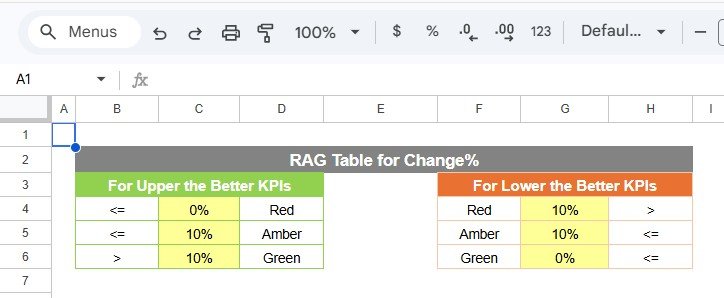
Colour Settings Sheet – Visual Customization
The Colour Settings Sheet allows users to customize dashboard colors.
Users can define color rules for:
-
Traffic light indicators
-
Performance alerts
-
Conditional formatting
For example:
-
Green for good performance
-
Yellow for warning levels
-
Red for critical performance issues
These visual indicators improve dashboard readability and make it easier to interpret performance results.
Advantages of Waste Management KPI Scorecard in Google Sheets
Organizations gain several benefits when they use this scorecard.
1. Easy to Use
Google Sheets offers a simple interface that most professionals already understand.
2. Real-Time Collaboration
Multiple team members can update the scorecard simultaneously.
3. Cloud Accessibility
Users can access the dashboard from any location with internet access.
4. Better Waste Management Insights
Managers can analyze performance trends quickly.
5. Improves Sustainability Tracking
The scorecard helps organizations monitor environmental performance.
6. Cost-Effective Solution
Google Sheets provides powerful analytics without requiring expensive software.
Best Practices for the Waste Management KPI Scorecard
Organizations should follow certain best practices to maximize the value of this scorecard.
1. Define Clear KPIs
Select KPIs that directly measure waste management efficiency and sustainability.
2. Update Data Regularly
Enter performance data frequently to ensure accurate reporting.
3. Review KPI Trends Monthly
Managers should review KPI trends regularly to identify operational issues early.
4. Set Realistic Targets
Organizations should set achievable targets based on historical data.
5. Train Staff Members
Employees should understand how to use the scorecard and interpret KPI data.
What KPIs Should Waste Management Teams Track?
Click to Buy Waste Management KPI Scorecard In Google Sheets
Waste management organizations typically monitor several important KPIs.
Common KPIs include:
- Waste Collection Efficiency
- Recycling Rate
- Waste Diversion Rate
- Landfill Waste Percentage
- Waste Processing Cost
- Waste Reduction Rate
- Waste Generated Per Capita
- Waste Recycling Volume
- Waste Transportation Efficiency
- Waste Sorting Accuracy
These KPIs help organizations evaluate both environmental performance and operational efficiency.
How Does This Scorecard Improve Sustainability?
Sustainability requires consistent monitoring and performance improvement.
The Waste Management KPI Scorecard supports sustainability in several ways:
- Tracks recycling performance
- Monitors landfill reduction goals
- Measures operational efficiency
- Supports environmental reporting
- Helps organizations achieve sustainability targets
Therefore, organizations can make smarter environmental decisions.
Conclusion
Waste management organizations must continuously monitor performance to improve sustainability, reduce environmental impact, and optimize operational efficiency.
The Waste Management KPI Scorecard in Google Sheets provides a simple yet powerful solution for tracking waste management KPIs.
Because the template includes interactive dashboards, KPI trend analysis, automated calculations, and visual indicators, it helps organizations monitor waste management performance efficiently.
Moreover, Google Sheets offers cloud collaboration, easy customization, and real-time data updates, making this tool ideal for modern environmental management.
Therefore, municipalities, environmental agencies, and waste management companies can use this scorecard to gain valuable insights, improve operational performance, and achieve sustainability goals.
Visit our YouTube channel to learn step-by-step video tutorials
Youtube.com/@NeotechNavigators
Watch the step-by-step video tutorial:
Click to Buy Waste Management KPI Scorecard In Google Sheets