Social service organizations play a vital role in supporting communities, improving quality of life, and delivering essential services to vulnerable populations. These organizations often manage multiple programs such as healthcare support, child welfare services, community development, elderly care, education support, and poverty alleviation initiatives. Because these programs involve many activities and stakeholders, organizations must carefully monitor performance to ensure resources create meaningful impact.Social Services KPI Scorecard In Google Sheets
However, measuring the performance of social service programs can become challenging. Data often spreads across different reports, spreadsheets, and monitoring systems. As a result, managers may struggle to evaluate whether programs achieve their intended outcomes. Therefore, organizations increasingly use Key Performance Indicator (KPI) scorecards to track progress and evaluate service effectiveness.Social Services KPI Scorecard In Google Sheets
One powerful solution for this purpose is the Social Services KPI Scorecard in Google Sheets.
The Social Services KPI Scorecard in Google Sheets is a ready-to-use performance monitoring template designed to track key performance indicators related to social programs and service delivery. Because Google Sheets allows real-time collaboration and automated calculations, organizations can easily monitor performance metrics, identify gaps, and make informed decisions.
In this article, you will learn everything about the Social Services KPI Scorecard in Google Sheets, including its structure, features, advantages, best practices, and frequently asked questions.
Click to Buy Social Services KPI Scorecard In Google Sheets
What Is a Social Services KPI Scorecard?
A Social Services KPI Scorecard is a structured reporting system that tracks important performance indicators for social service programs.
The scorecard helps organizations measure how effectively they deliver services, allocate resources, and achieve social impact goals. Instead of relying on scattered reports, the scorecard consolidates data into a centralized performance dashboard.
Typically, the scorecard measures indicators such as:
- Number of beneficiaries served
- Program participation rates
- Service delivery efficiency
- Community outreach impact
- Volunteer engagement
- Funding utilization
- Program completion rates
- Client satisfaction scores
- Case resolution time
Because the scorecard displays these indicators visually, decision-makers can quickly evaluate program performance.
Why Do Social Service Organizations Need a KPI Scorecard?
Social service organizations operate in complex environments where accountability and transparency are essential. Governments, donors, and stakeholders expect measurable outcomes from funded programs.
Therefore, a KPI scorecard becomes an essential management tool.
Improved Program Monitoring
The scorecard provides a clear overview of program performance. Managers can easily track whether services reach their intended beneficiaries.
Data-Driven Decision Making
Because the scorecard highlights trends and performance gaps, leaders can make informed decisions about program improvements.
Increased Transparency
Stakeholders can view performance metrics clearly. Consequently, organizations build trust with donors and communities.
Better Resource Allocation
The scorecard identifies which programs perform well and which require additional support.
Continuous Improvement
Regular monitoring encourages organizations to improve service delivery continuously.
Key Features of the Social Services KPI Scorecard in Google Sheets
Click to Buy Social Services KPI Scorecard In Google Sheets
The Social Services KPI Scorecard in Google Sheets includes multiple worksheets that organize KPI information and simplify performance monitoring.
The template tracks 10 different KPIs to evaluate organizational performance.
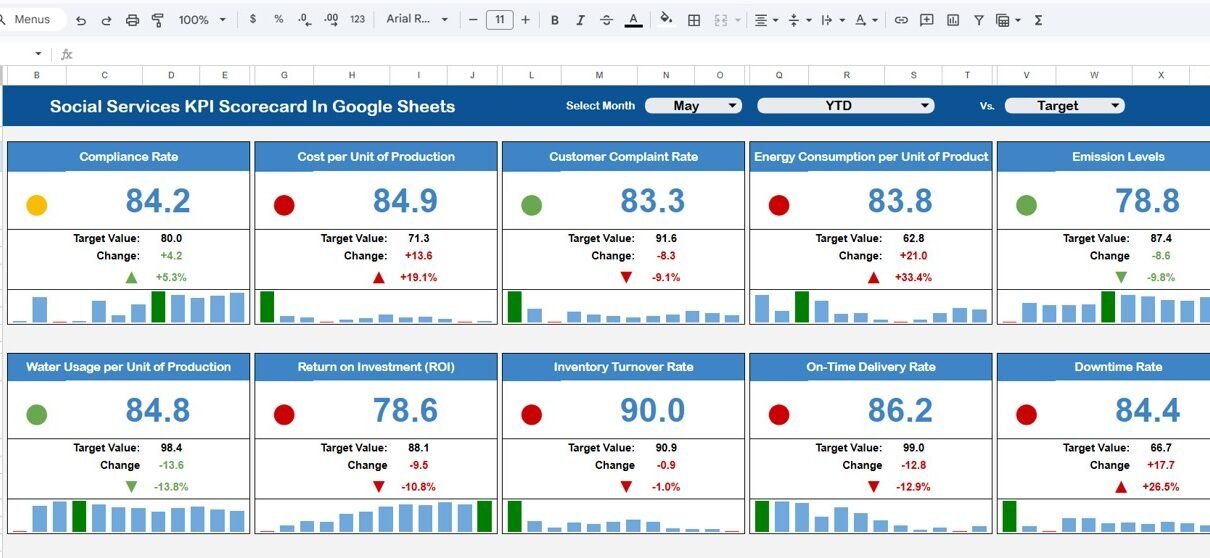
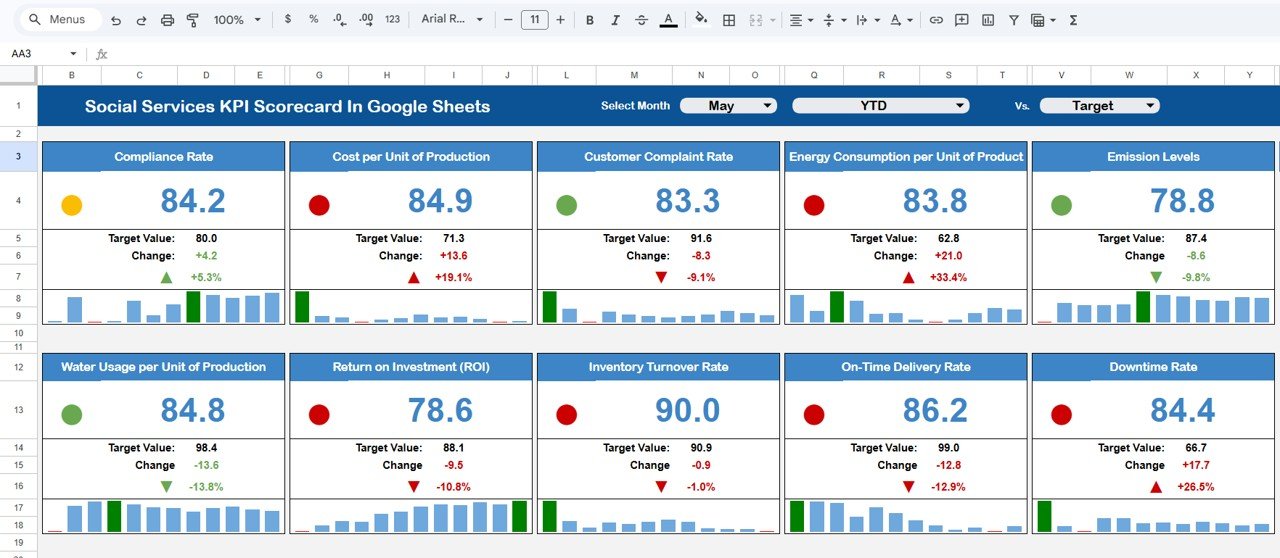
1. Monthly Scorecard Dashboard
The Monthly Scorecard Dashboard acts as the main reporting interface.
At the top of the dashboard, users can select the month from a dropdown list. Once the month is selected, the entire scorecard automatically updates the performance data for that selected period.
Because of this feature, managers can easily compare monthly performance trends.
Performance Indicators Displayed
The dashboard displays:
- KPI Name
- Target Value
- Actual Value
- Performance Variance
- Percentage Change
Traffic Light Indicators
The dashboard uses traffic light indicators to highlight KPI performance:
- 🟢 Green – Target achieved
- 🟡 Yellow – Slightly below target
- 🔴 Red – Below target
These visual indicators allow managers to quickly identify performance issues.
Up and Down Arrow Indicators
In addition, the dashboard includes percentage change indicators with arrows:
-
⬆ Up arrow indicates improvement
-
⬇ Down arrow indicates decline
Therefore, decision-makers can easily identify positive or negative trends.
MTD and YTD Performance View
Click to Buy Social Services KPI Scorecard In Google Sheets
The scorecard includes two performance views:
MTD (Month-to-Date)
Clicking the MTD option shows monthly performance metrics.
This view allows organizations to monitor short-term operational performance.
YTD (Year-to-Date)
Clicking the YTD option displays cumulative yearly performance.
This view helps organizations evaluate long-term progress toward strategic goals.
Because users can switch between MTD and YTD views easily, they can analyze both short-term and long-term performance trends.
Click to Buy Social Services KPI Scorecard In Google Sheets
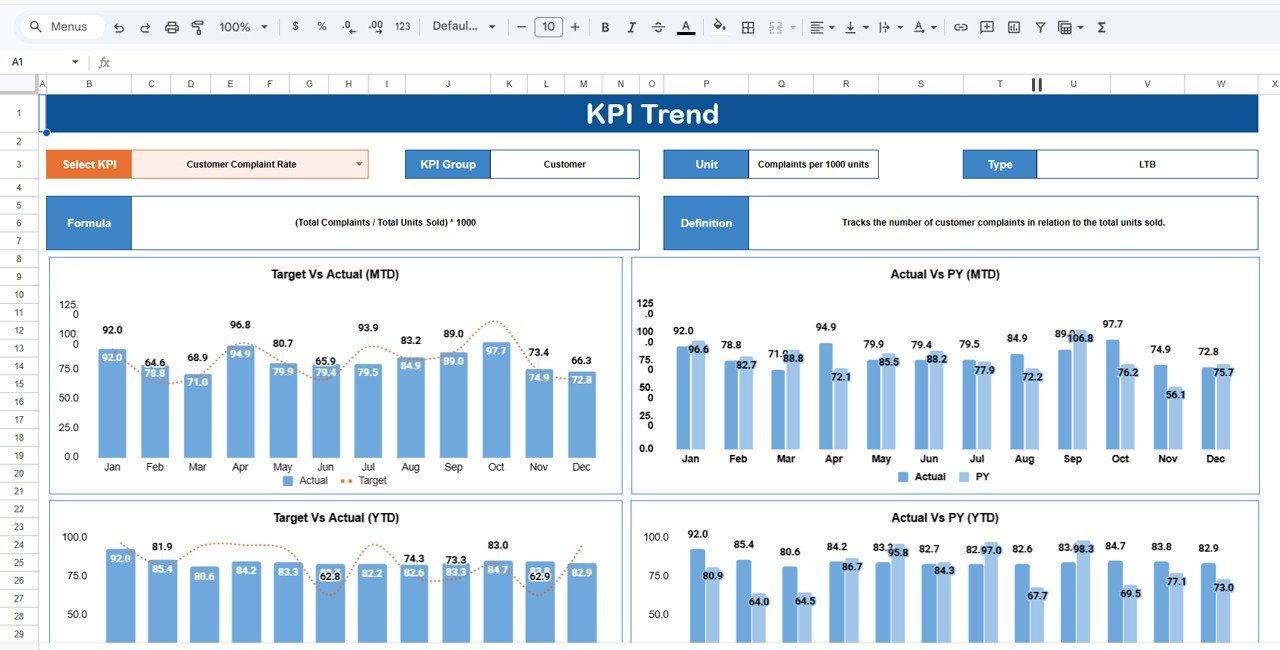
2. KPI Trend Sheet
The KPI Trend Sheet helps users analyze the performance history of individual KPIs.
In cell C3, users can select a KPI from a dropdown list.
Once the KPI is selected, the sheet displays detailed information including:
-
KPI Group
-
KPI Unit
-
KPI Type (Lower the Better or Upper the Better)
This sheet helps managers understand whether a KPI measures positive growth or reduction.
For example:
-
Upper the Better KPIs: Beneficiaries served, service completion rate, volunteer participation.
-
Lower the Better KPIs: Complaint resolution time, service delays, operational costs.
Click to Buy Social Services KPI Scorecard In Google Sheets
Because this sheet focuses on KPI trends, managers can analyze performance improvements over time.
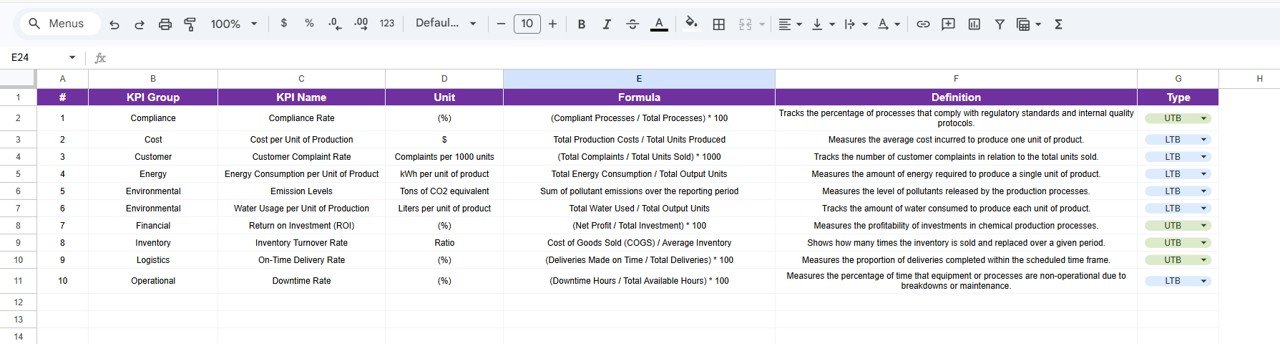
3. KPI Definition Sheet
The KPI Definition Sheet provides documentation for all KPIs used in the scorecard.
In this sheet, users must enter the following information:
- KPI Name
- KPI Group
- KPI Unit
- KPI Formula
- KPI Definition
This sheet ensures every KPI remains standardized and clearly defined.
Because everyone in the organization understands KPI calculations and meanings, reporting accuracy improves significantly.
Click to Buy Social Services KPI Scorecard In Google Sheets
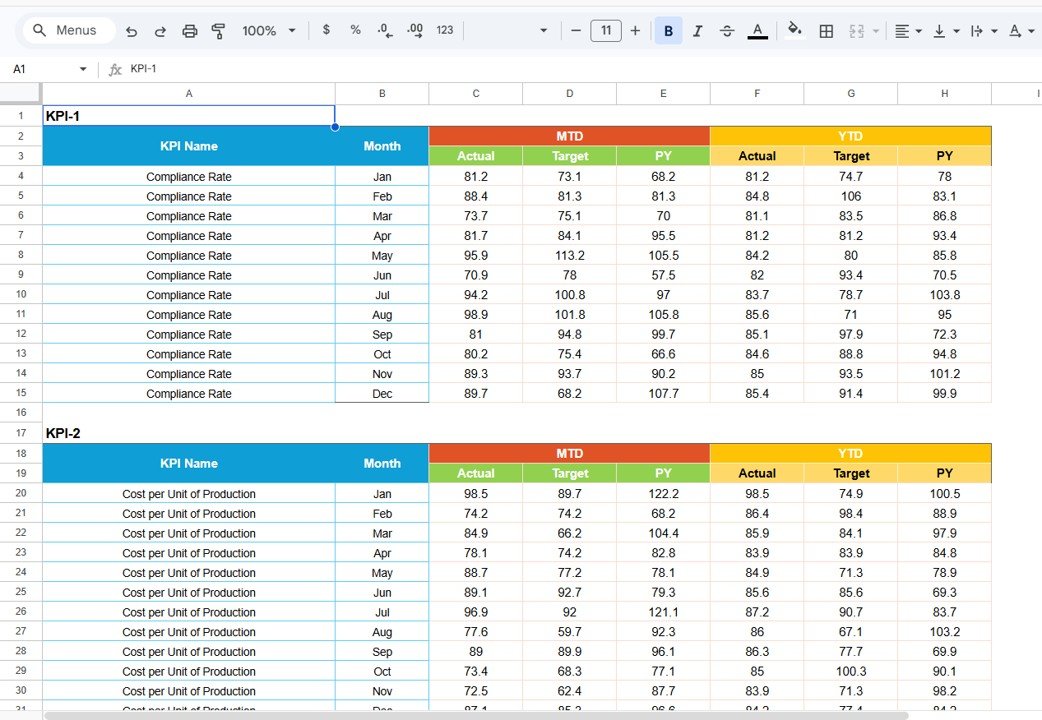
4. Data Input Sheet
The Data Input Sheet is where users enter the raw KPI data.
Users input monthly values for each KPI. The dashboard automatically processes this information and updates the scorecard visuals.
This sheet acts as the central data source for the entire scorecard.
Therefore, accurate data entry is essential for reliable analytics.
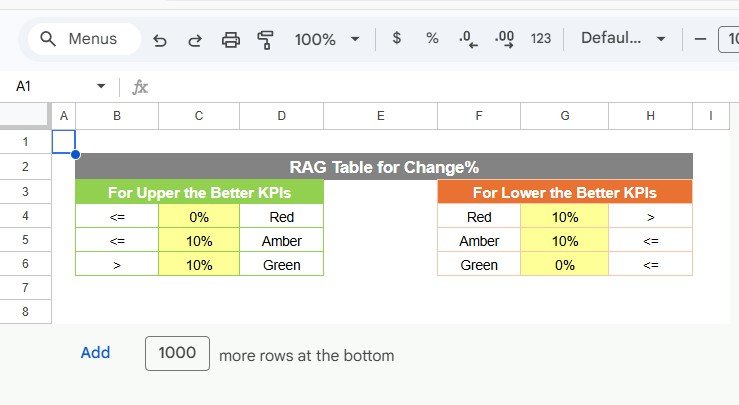
5. Colour Settings Sheet
The Colour Settings Sheet controls the color indicators used in the scorecard.
Users can customize:
-
Traffic light colors
-
Threshold levels for KPI performance
-
Conditional formatting rules
This customization ensures the dashboard aligns with organizational reporting standards.
Click to Buy Social Services KPI Scorecard In Google Sheets
Advantages of the Social Services KPI Scorecard
Using a KPI scorecard provides several advantages.
Clear Performance Monitoring
Organizations can track program outcomes quickly.
Better Accountability
Teams understand how their work contributes to organizational goals.
Improved Stakeholder Reporting
Donors and partners can easily review performance results.
Faster Decision Making
Visual indicators highlight areas requiring attention.
Enhanced Program Efficiency
Managers can identify operational inefficiencies early.
Opportunities for Improvement
Although the scorecard provides strong insights, organizations can enhance it further.
Integration with Program Management Tools
Connecting case management systems can automate data collection.
Real-Time Data Updates
API integration can allow automatic KPI updates.
Advanced Data Visualization
Charts and trend graphs can improve analytical insights.
Impact Measurement Analytics
Adding social impact metrics can improve program evaluation.
Best Practices for the Social Services KPI Scorecard
Click to Buy Social Services KPI Scorecard In Google Sheets
Organizations should follow these best practices to maximize dashboard effectiveness.
Define Clear KPIs
Every KPI must have a clear formula and definition.
Maintain Data Accuracy
Accurate data entry ensures reliable reporting.
Update Data Regularly
Frequent updates improve monitoring effectiveness.
Focus on Impact Metrics
Track indicators that measure real social outcomes.
Use Visual Indicators
Traffic lights and arrows improve readability and decision-making.
Conclusion
Click to Buy Social Services KPI Scorecard In Google Sheets
The Social Services KPI Scorecard in Google Sheets provides an efficient solution for monitoring the performance of social programs and services. Because social service organizations manage complex operations and serve diverse communities, they require structured systems to track outcomes and measure impact.Social Services KPI Scorecard In Google Sheets
This scorecard simplifies performance monitoring by consolidating multiple KPIs into a centralized dashboard. Features such as month selection, MTD and YTD views, traffic light indicators, and KPI trend analysis make it easy to evaluate performance quickly.Social Services KPI Scorecard In Google Sheets
Visit our YouTube channel to learn step-by-step video tutorials
Youtube.com/@NeotechNavigators
Watch the step-by-step video tutorial: