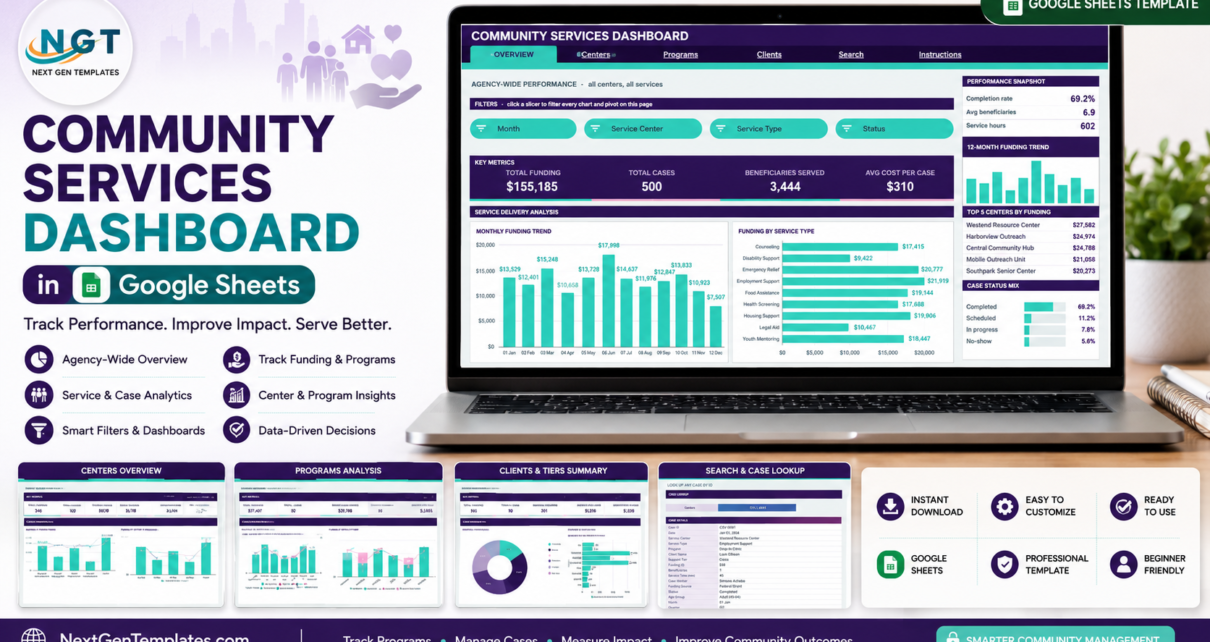
A pivot-and-slicer Community Services Dashboard in Google Sheets that tracks 16 KPIs across Overview, Centers, Programs and Clients pages, plus a Case ID search tab. 500 sample records, 1,000-row capacity, no subscription.
Online Tutorial for Data Analysis and Automation
A pivot-and-slicer Community Services Dashboard in Google Sheets that tracks 16 KPIs across Overview, Centers, Programs and Clients pages, plus a Case ID search tab. 500 sample records, 1,000-row capacity, no subscription.
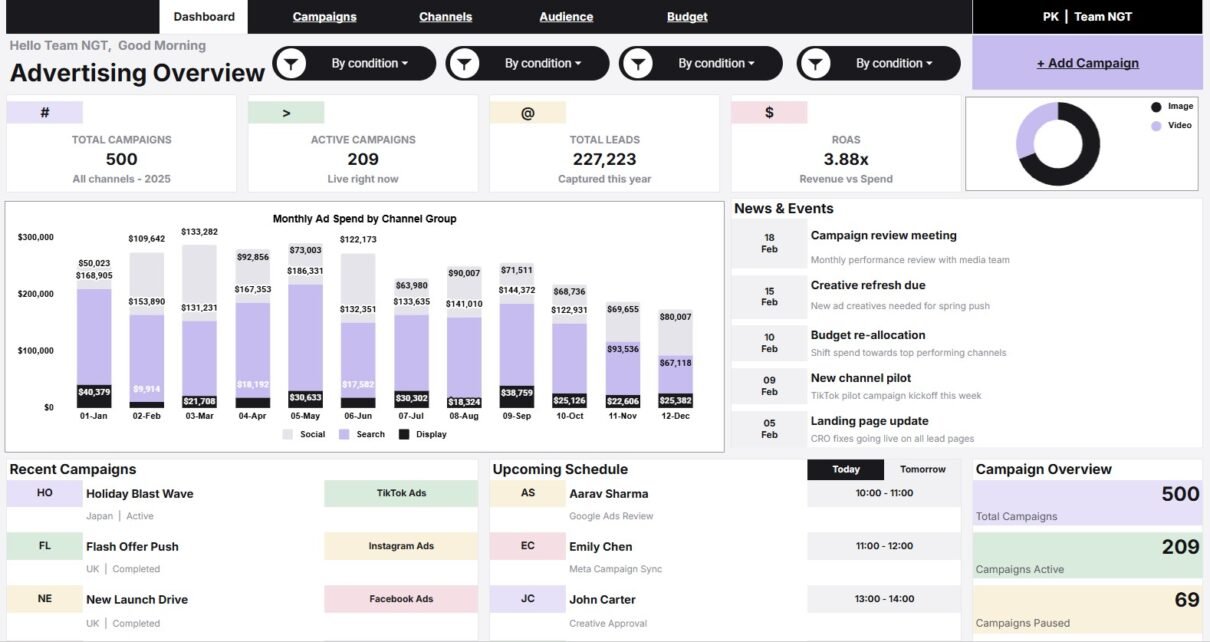
Track cases, aid disbursed, resolved rate, wellbeing, programs, caseload, costs and searchable case records in the Community Support Impact Dashboard in Google Sheets.
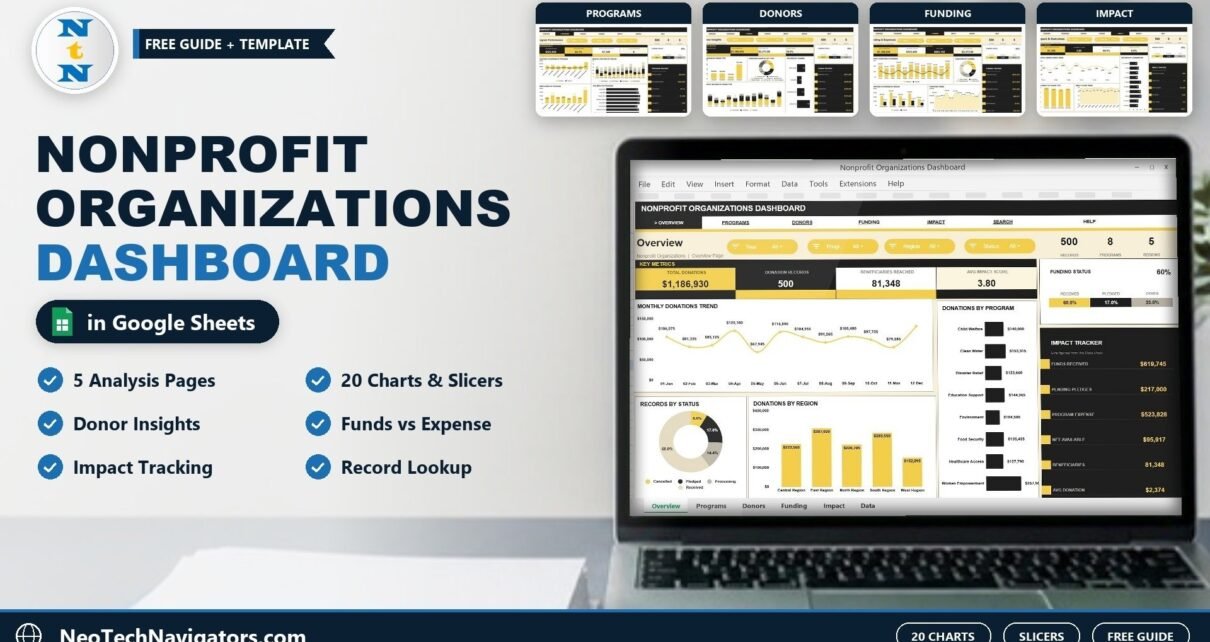
A Google Sheets dashboard for nonprofits and NGOs: Overview, Programs, Donors, Funding and Impact pages with 20 charts and slicers, a Record Lookup sheet and a 500-row sample data sheet.
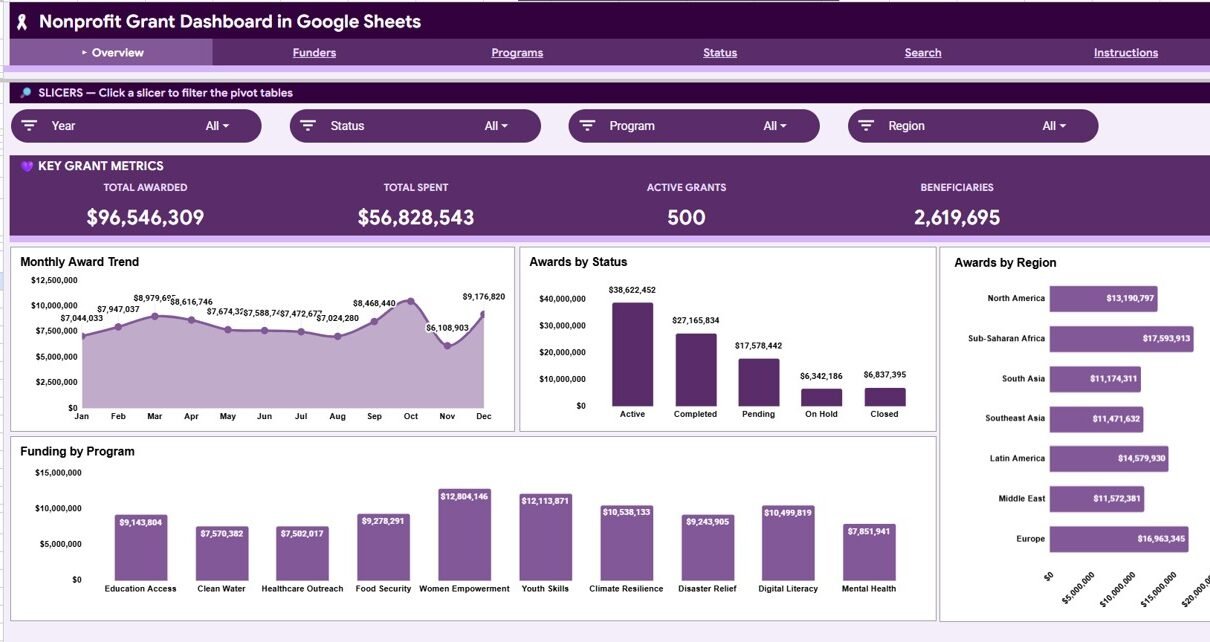
The Nonprofit Grant Dashboard in Google Sheets tracks 4 KPI cards and 13 charts across 6 tabs, with slicers and a Grant ID lookup. Track awards, spend, programs and beneficiaries in under 10 minutes.
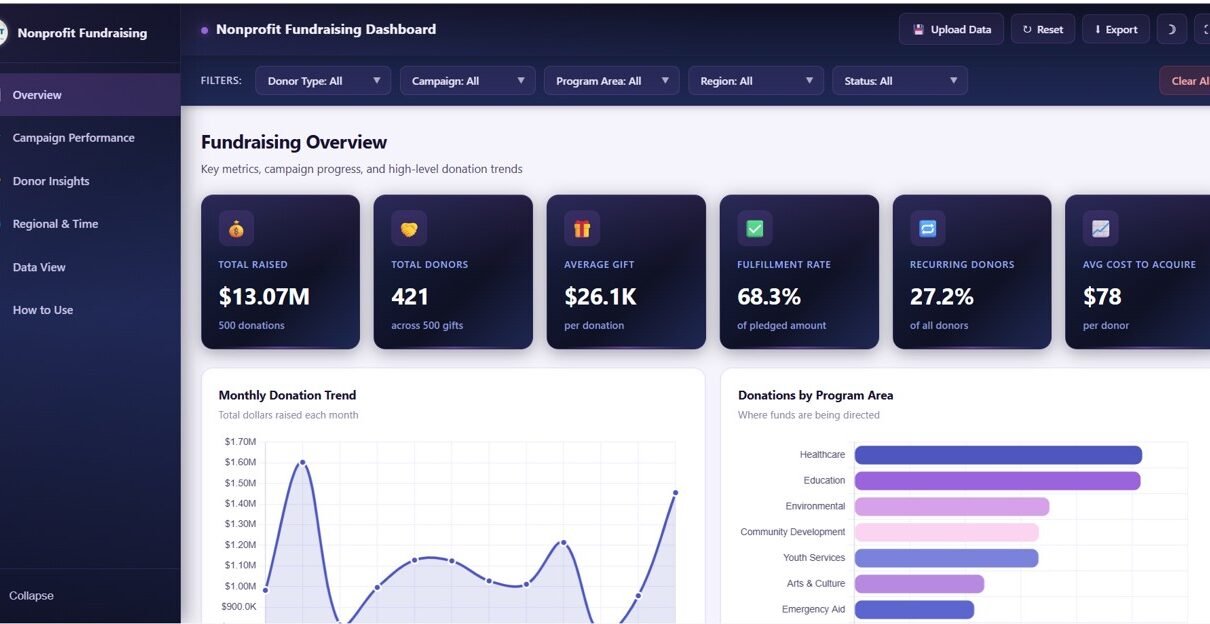
Track donations, campaigns, donor insights, and regional fundraising trends with this interactive Nonprofit Fundraising Dashboard in HTML. Features 5 pages, 6 KPI cards, 15+ charts, and CSV export.
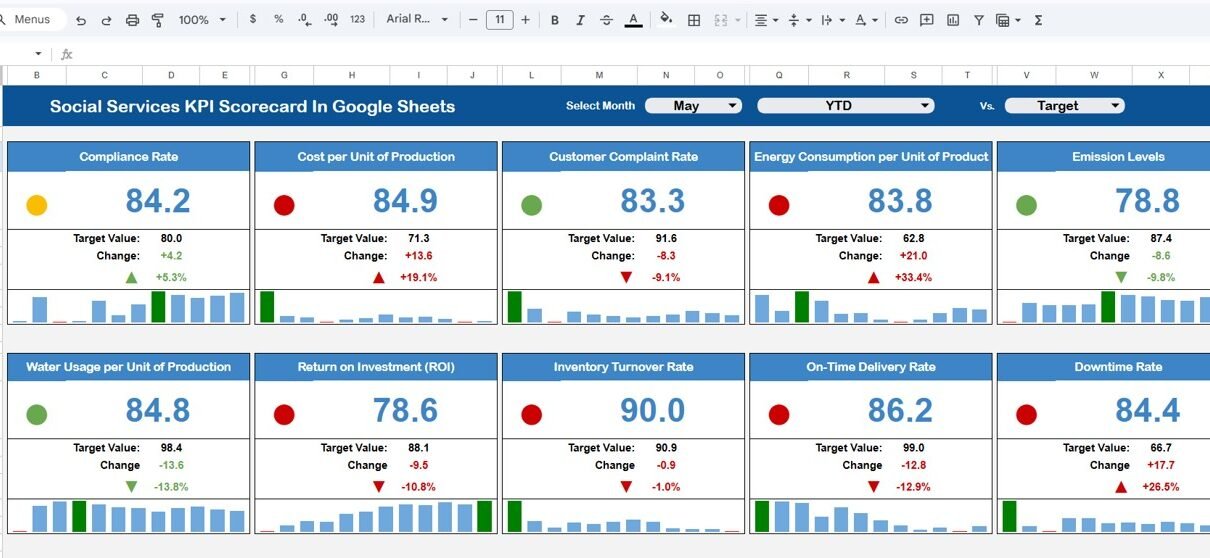
Social service organizations play a vital role in supporting communities, improving quality of life, and delivering essential services to vulnerable populations. These organizations often manage multiple programs such as healthcare support, child welfare services, community development, elderly care, education support, and poverty alleviation initiatives. Because these programs involve many activities and stakeholders, organizations must carefully […]