Grant teams lose hours every month rebuilding the same funder report from scratch. The Nonprofit Grant Dashboard in Google Sheets replaces that grind: it tracks 4 headline KPIs and 13 pre-built charts across 6 connected tabs, and the whole thing rebuilds the moment you paste fresh data. Setup takes under 10 minutes, and it runs entirely in a browser with no add-ons.
If you manage awards across multiple funders, programs and regions, you already know the problem — the data lives in one messy sheet, and turning it into something a board or funder can read is the hard part. This Nonprofit Grant Dashboard in Google Sheets solves exactly that, turning a single grant log into cards, charts, slicer filters and a Grant ID lookup.
Key Features of the Nonprofit Grant Dashboard in Google Sheets
Click here to purchase the Nonprofit Grant Dashboard in Google Sheets.
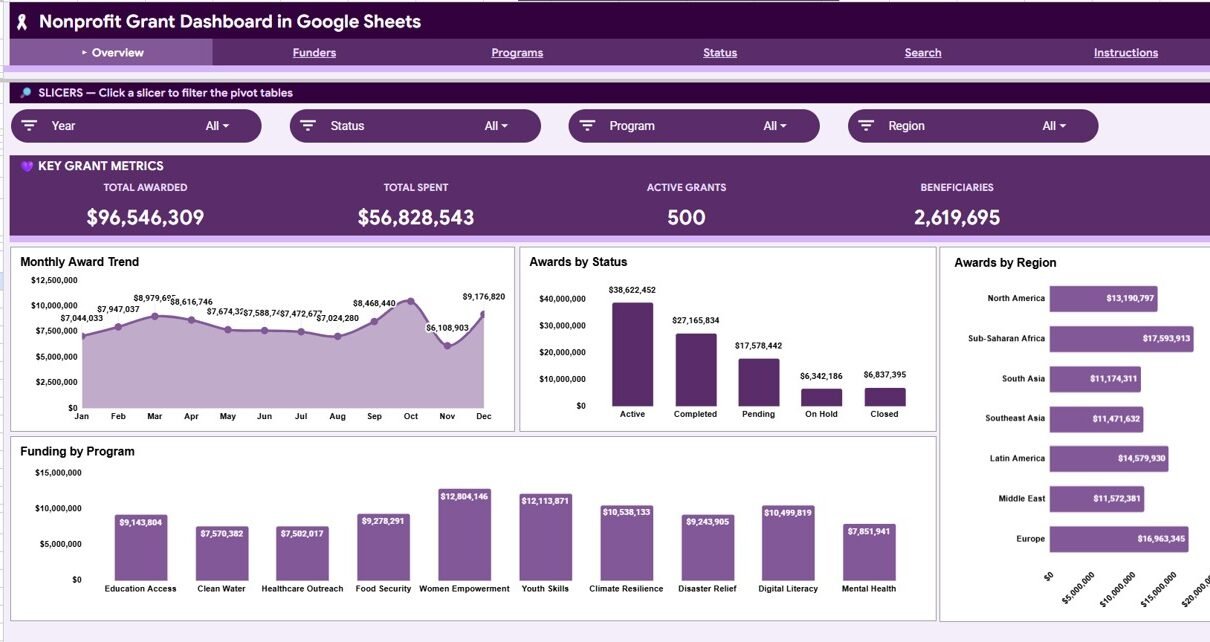
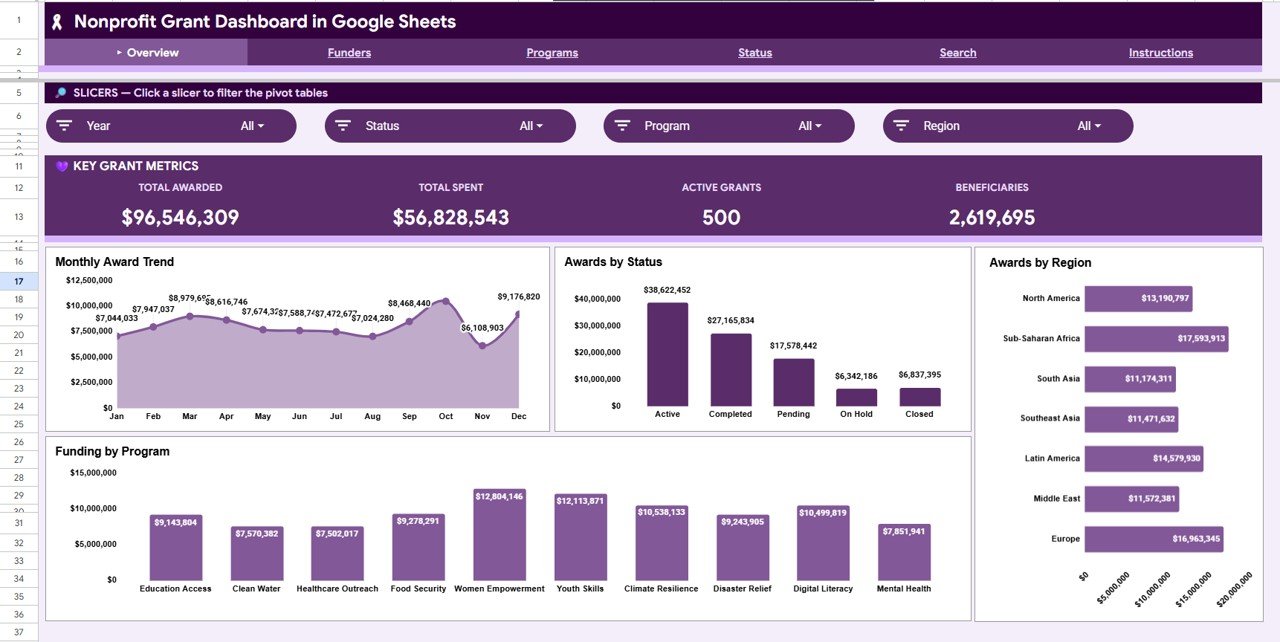
The dashboard is built around four KPI cards — Total Awarded, Total Spent, Active Grants and Beneficiaries — that update automatically whenever you change the underlying data. These give leadership an instant read on portfolio health.
It ships with 13 charts spread across four analysis tabs, covering award trends, status breakdowns, regional reach, funder contributions and program funding. Native slicers sit at the top of each page, so one click filters every chart by funder, program, region or status. A separate Search tab acts as a Grant Lookup that returns any grant’s full record by Grant ID. Everything works inside Google Sheets — no extensions, no scripts, no installs.
Dashboard Pages Explanation
Overview Dashboard
The Overview tab opens with the four KPI cards and slicers that control the page. Its charts are Monthly Award Trend (awarded value month by month), Awards by Status (portfolio split across Active, Completed and Pending), Awards by Region (value across the regions you serve) and Funding by Program (which programs attract the most money).
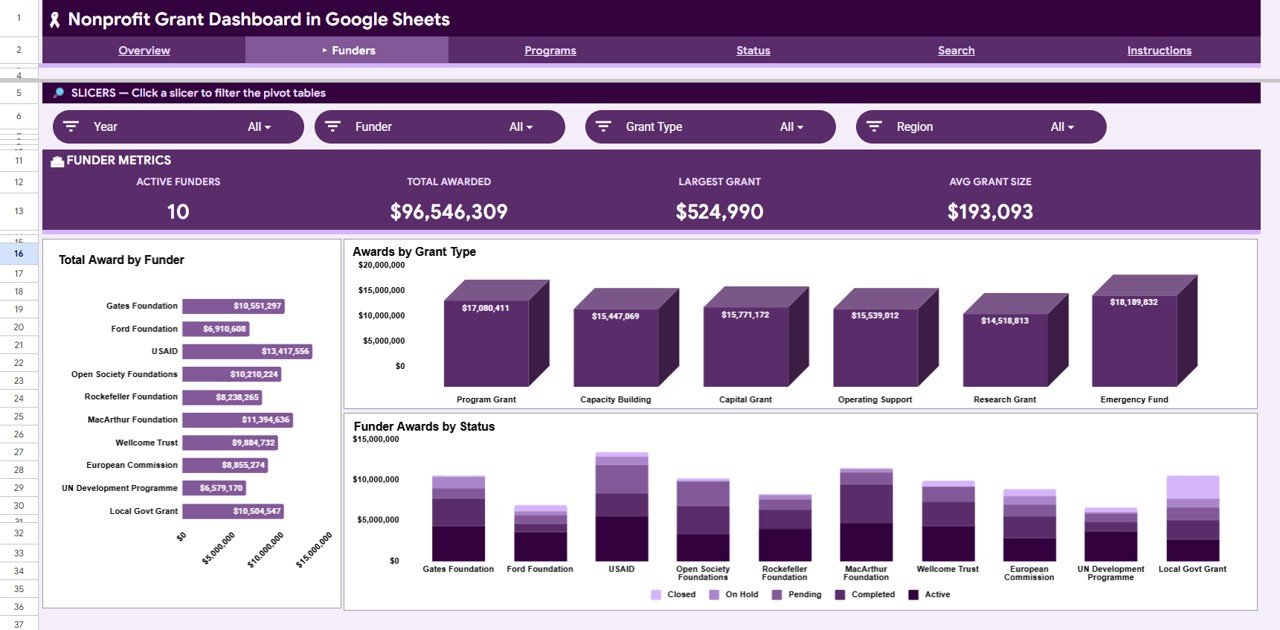
Funders
Click here to purchase the Nonprofit Grant Dashboard in Google Sheets.
The Funders tab shows where the money comes from. Total Award by Funder ranks each funder by total value, Awards by Grant Type breaks the portfolio down by type, and Funder Awards by Status cross-tabs each funder against grant status so you can track progress funder by funder.
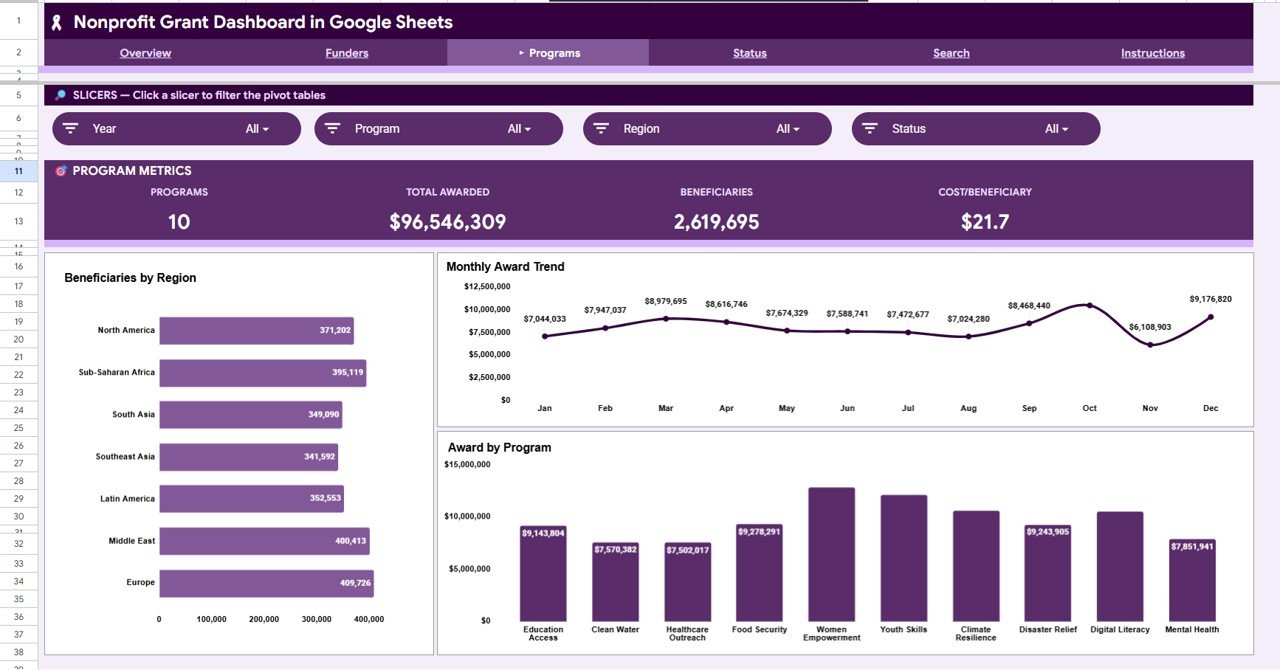
Programs
Click here to purchase the Nonprofit Grant Dashboard in Google Sheets.
The Programs tab links funding to impact. Beneficiaries by Region shows how many people each region reaches, Monthly Award Trend tracks program-level award flow across the year, and Award by Program compares total value secured per program.
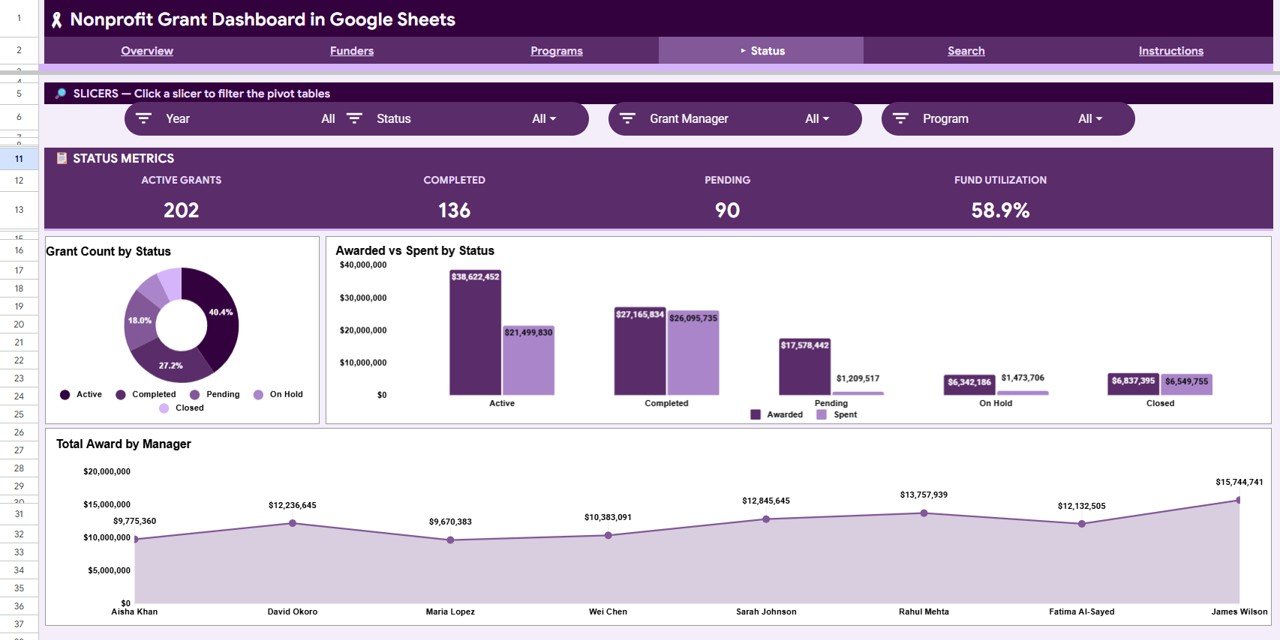
Status
The Status tab is built for utilisation and accountability. Grant Count by Status counts how many grants sit in each stage, Awarded vs Spent by Status compares committed money against money actually spent, and Total Award by Manager shows the value each grant manager is responsible for.
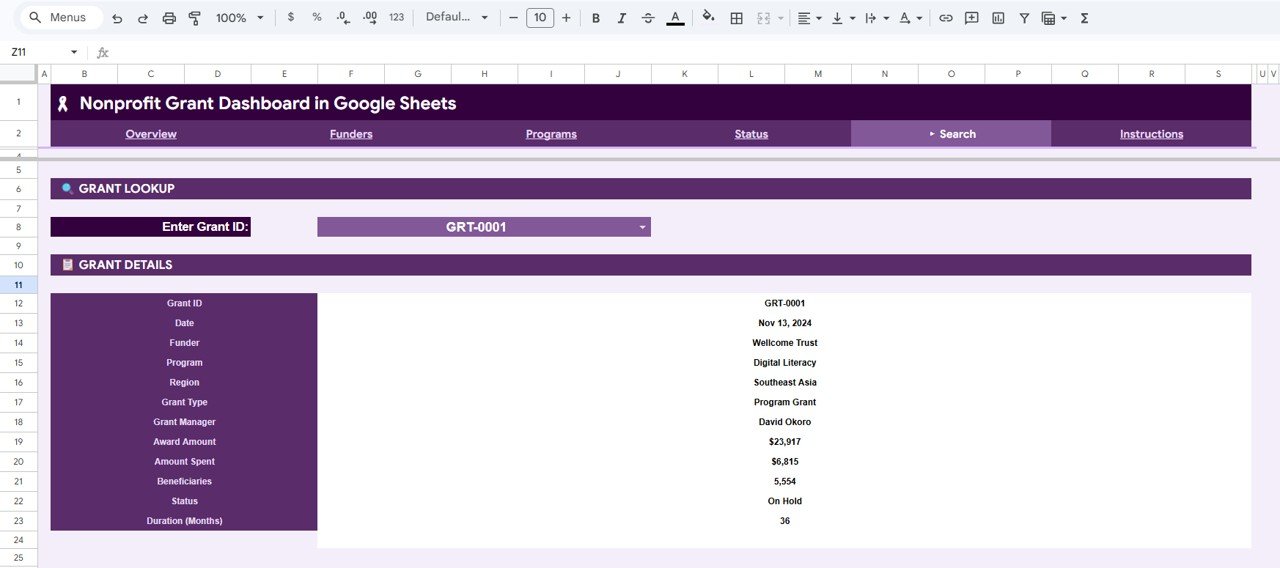
Search Sheet
Click here to purchase the Nonprofit Grant Dashboard in Google Sheets.
The Search tab is a Grant Lookup. Pick any Grant ID from the dropdown and the sheet returns the complete record — Date, Funder, Program, Region, Grant Type, Grant Manager, Award Amount, Amount Spent, Beneficiaries, Status and Duration in Months — ideal for pulling up one grant during a call or audit.
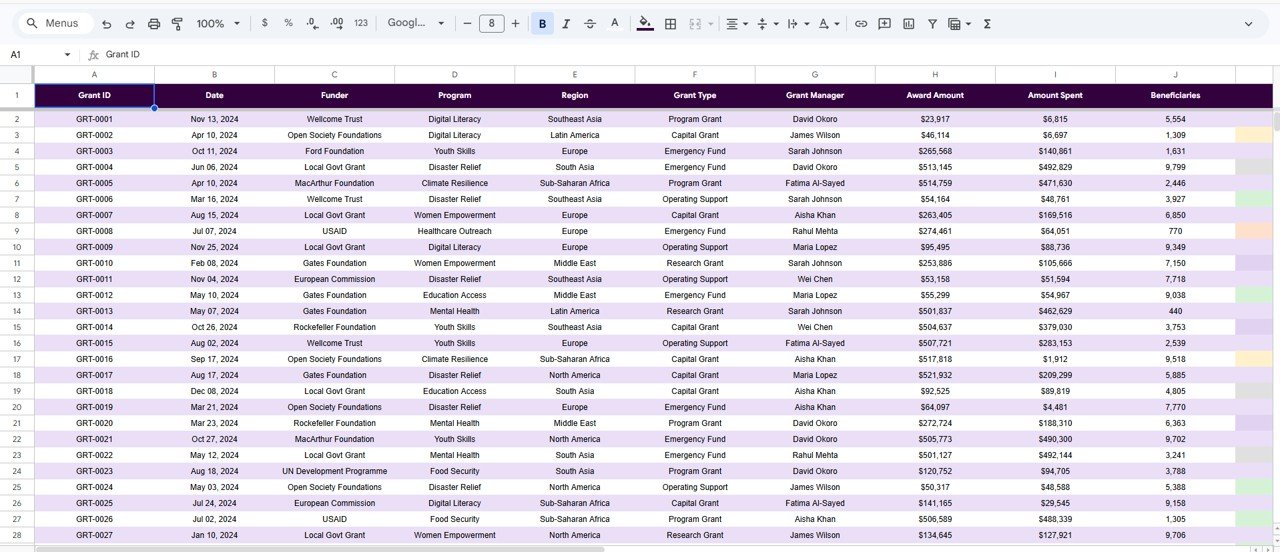
Data Sheet
The Data tab is the engine. Enter or paste your grant records in the same column format, and every card, chart, slicer and the lookup rebuild from this one table.
Nonprofit Grant Dashboard: Google Sheets vs. Excel vs. Paid Grant Software
Click here to purchase the Nonprofit Grant Dashboard in Google Sheets.
| Feature | This Template (Google Sheets) | Microsoft Excel Dashboard | Fluxx / Submittable / Blackbaud |
|---|---|---|---|
| Cost | $9.99 one-time | $17.99 one-time | $5,000–$30,000+ / year |
| Platform | Browser, any device | Desktop Excel | Web SaaS |
| Setup time | Under 10 minutes | Under 10 minutes | Weeks (onboarding) |
| Real-time collaboration | ✅ Built in | Needs OneDrive / 365 | ✅ Yes |
| Mobile access | ✅ Sheets app | Limited | ✅ Yes |
| Customisable fields | ✅ Fully open | ✅ Fully open | Limited / paid tiers |
| Share with a link | ✅ One click | File send | ✅ Yes |
| Grant ID lookup | ✅ Built in | ✅ Built in | ✅ Yes |
| Year-1 cost at 5 users | $9.99 total | $17.99 total | $5,000–$30,000+ |
For grant teams that want funder-ready reporting without paying thousands a year for grant-management software, the Nonprofit Grant Dashboard in Google Sheets sits in the sweet spot.
Who Should Use This Template
Perfect for:
- Small and mid-size nonprofits managing 10–500 grants across multiple funders and programs
- Grant managers and program officers who need funder-ready charts without a data team
- Founders and treasurers tracking awarded vs spent and beneficiaries on a fixed budget
Not a fit if:
- You are a large foundation needing full grants-management workflow, approvals and SOC 2 compliance
- You require automated funder portals or online application intake
Real-World Use Cases
Maria runs grants at a 25-person community nonprofit. Each month she pastes her award log into the Data tab and uses the Overview cards to show her board Total Awarded versus Total Spent in seconds — no more rebuilding a deck by hand.
David is a program officer managing 60 grants across four regions. He leans on the Status tab to compare Awarded vs Spent and the Total Award by Manager chart to balance workload across his team.
Aisha prepares funder reports for a global education charity. She filters the Programs tab by region with one slicer click and shares a clean Beneficiaries by Region view with each funder.
Advantages of the Nonprofit Grant Dashboard in Google Sheets
The biggest advantage is cost versus capability: a one-time $9.99 purchase replaces reporting work that grant teams often pay thousands a year for. Because it lives in Google Sheets, collaboration is built in — trustees and funders can be given view access with a single link, and the dashboard opens on any device through the Sheets mobile app.
It also saves time. The Data tab drives everything, so monthly reporting becomes a paste-and-refresh task rather than a rebuild. Slicers make ad-hoc questions — “what did Funder X give us this year?” — a one-click answer instead of a formula edit.
Opportunities for Improvement
Click here to purchase the Nonprofit Grant Dashboard in Google Sheets.
The dashboard is reporting-first, not a full grants-management system. It does not handle online application intake, approval workflows or automated funder portals, so very large foundations with compliance requirements will outgrow it. It also relies on clean, consistent data entry in the Data tab — if statuses or funder names are typed inconsistently, charts will split them. A quick data-validation dropdown on key columns is a sensible addition for bigger teams.
Best Practices
Keep the column structure of the Data tab intact and paste new records below the existing rows so charts auto-expand. Use consistent labels for Status, Funder and Program so slicers group cleanly. Duplicate the file at the start of each fiscal year to keep an archive, and share a view-only copy with funders rather than the editable master.
Explore Relevant Templates
Get the Nonprofit Grant Dashboard in Google Sheets on NextGenTemplates. It is also available as a Nonprofit Grant Dashboard in Excel and a Nonprofit Grant Dashboard in Power BI.
If you manage the wider funding cycle, these related Google Sheets tools pair well: the Grant Management KPI Dashboard in Google Sheets, the Grant Proposal Submission Calendar in Google Sheets, the Fundraising Campaign KPI Dashboard in Google Sheets, the Charity Fundraising KPI Scorecard in Google Sheets, the Disaster Relief KPI Dashboard in Google Sheets and the Church Finance Dashboard in Google Sheets. To build your own visuals from scratch, see Google’s official guide to adding charts in Google Sheets.
Frequently Asked Questions
What KPIs does the Nonprofit Grant Dashboard in Google Sheets track?
The Nonprofit Grant Dashboard in Google Sheets tracks four headline KPIs — Total Awarded, Total Spent, Active Grants and Beneficiaries — plus 13 charts covering award trends, status, region, funder and program. All metrics update automatically when you replace the sample data.
How long does setup take?
Setup takes under 10 minutes. Make your own copy of the Nonprofit Grant Dashboard in Google Sheets, paste your grant records into the Data tab in the same column order, and every card, chart, slicer and the Grant Lookup rebuild themselves.
Can I filter the dashboard by funder or program?
Yes. The Nonprofit Grant Dashboard in Google Sheets uses native slicers on each analysis tab, so a single click filters every chart on the page by funder, program, region or status with no formulas to edit.
How does this compare to paid grant software like Fluxx or Blackbaud?
Paid grant-management platforms run $5,000–$30,000+ per year. The Nonprofit Grant Dashboard in Google Sheets is a one-time $9.99 purchase that covers reporting, filtering and grant lookup — ideal for teams that need clear analytics without enterprise pricing.
Do I need any add-ons or installs?
No. The Nonprofit Grant Dashboard in Google Sheets runs entirely in your browser inside Google Sheets, with no extensions, scripts or installs, and it works on the Google Sheets mobile app.
About the Author
Built by PK — Microsoft Certified Professional with 15+ years of Excel, Google Sheets, and Power BI experience. Founder of NextGenTemplates, reaching 300K+ subscribers across YouTube channels. Every template is hand-built and tested before release.
Conclusion
If grant reporting eats your month, the Nonprofit Grant Dashboard in Google Sheets gives you cards, charts, slicers and a grant lookup in one connected file for a one-time price. Click here to purchase the Nonprofit Grant Dashboard in Google Sheets.
Instant download · One-time payment · No subscription.
🎥 For step-by-step video tutorials, visit YouTube.com/@NeoTechNavigators.
Last updated: June 2026