The Grant Management KPI Dashboard in Google Sheets tracks grant performance KPIs across 6 interactive worksheets, with MTD and YTD comparisons against targets and prior-year benchmarks. Nonprofit organizations worldwide manage over $800 billion in annual grant funding, yet most grant teams still rely on manual spreadsheets with no structured KPI tracking. This dashboard closes that gap with month-level filtering that updates every metric instantly — setup takes under 10 minutes.
Whether you manage federal grants, foundation awards, or corporate giving programs, tracking fund utilization rate, compliance scores, disbursement timelines, and beneficiary outcomes in one file eliminates the reporting chaos that leads to missed deadlines and audit findings. This is a ready-to-use template in Google Sheets.
Key Features of Grant Management KPI Dashboard in Google Sheets
Click here to Purchase the Grant Management KPI Dashboard in Google Sheets
The Grant Management KPI Dashboard in Google Sheets delivers structured grant performance tracking with 6 purpose-built worksheets. It supports MTD and YTD dual tracking, conditional formatting arrows for instant status checks, 12-month trend charts for every KPI, and a central KPI Definition registry with LTB/UTB logic. The month selector dropdown on cell D3 recalculates the entire dashboard with one click.
Key capabilities include automatic Target vs. Actual and Previous Year vs. Actual comparisons, configurable first month of the fiscal year, and the ability to add unlimited custom grant KPIs without editing any formulas. The dashboard is built entirely with native Google Sheets functions — no scripts, no add-ons, no macros.Grant Management KPI Dashboard in Google Sheets
Dashboard Sheets Explanation
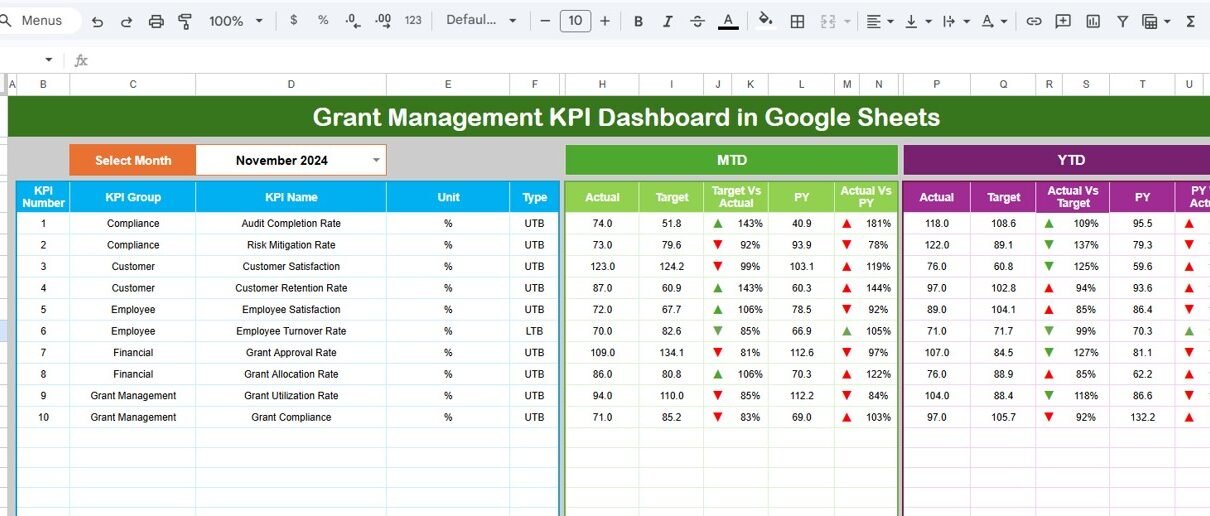
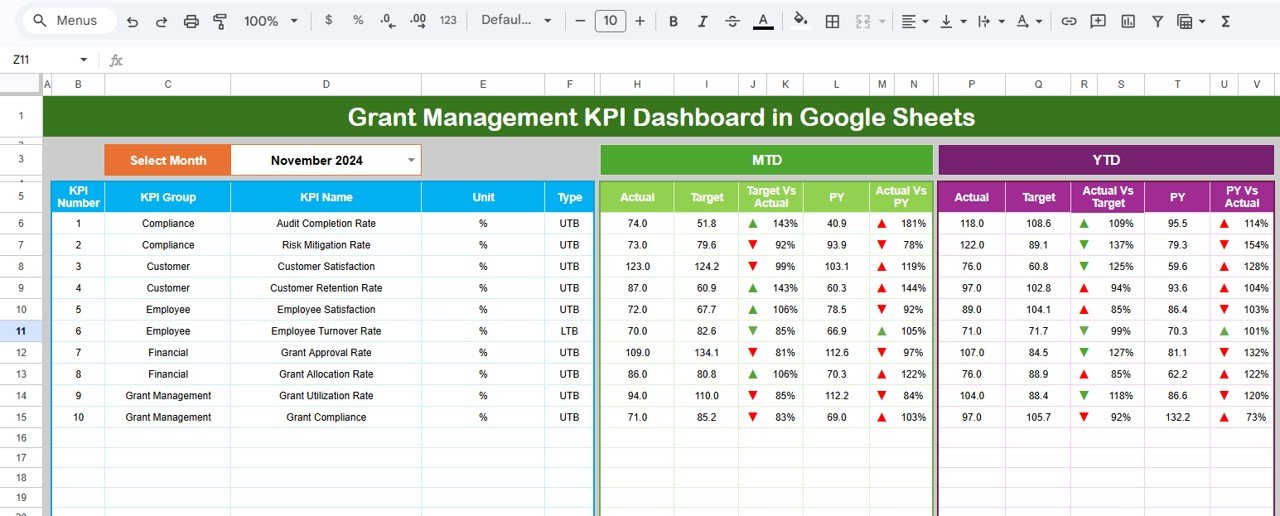
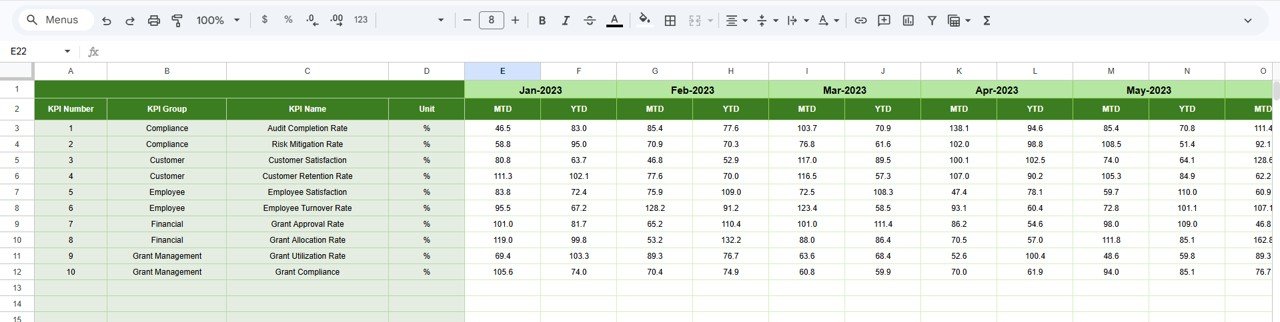
1. Dashboard Sheet
This is the main sheet tab. Here, all information about all of the KPIs is displayed. On range D3, you can select the Month from the drop-down. The whole dashboard numbers change for that selected month.
The dashboard shows MTD Actual, Target, Previous Year data along with the Target Vs Actual and PY vs Actual with conditional formatting up/down arrows. It also shows YTD Actual, Target, Previous Year data along with the Target Vs Actual and PY vs Actual with conditional formatting up/down arrows.
Grant Management KPI Dashboard in Google Sheets
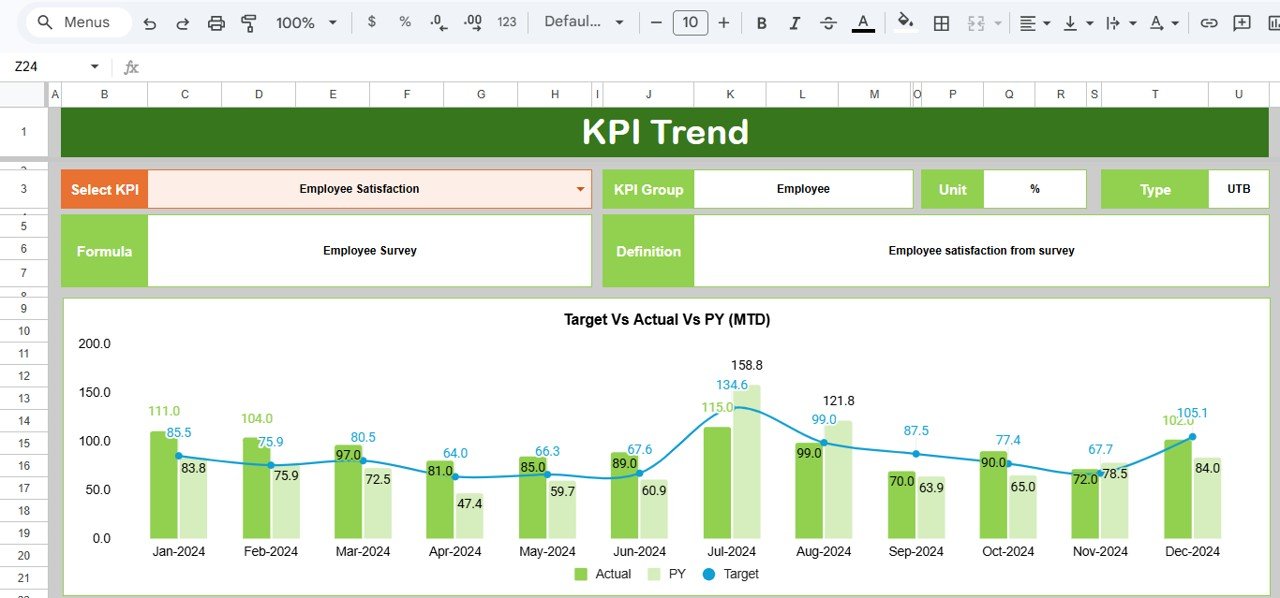
2. KPI Trend Sheet
Here you can select the KPI name from the drop down available on range C3. The sheet displays the KPI Group, Unit of KPI, Type of KPI (Lower the Better or Upper the Better), Formula of the KPI and Definition of the KPI. MTD and YTD trend charts plot Actual, Target, and Previous Year numbers across all 12 months.
KPI Trend Sheet
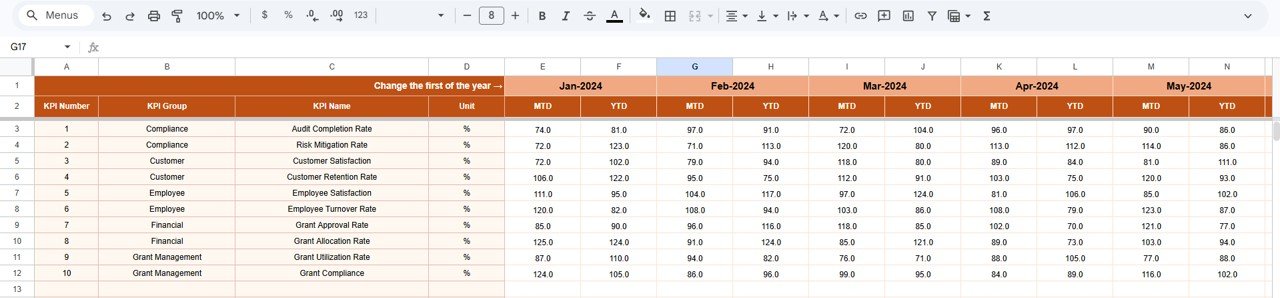
3. Actual Numbers Input Sheet
Here you enter the actual numbers for YTD and MTD for a particular month. You can change the months from range E1. Just input the first month of the Year on range E1 and the sheet adjusts all 12 month columns accordingly.
Actual Numbers Input sheet
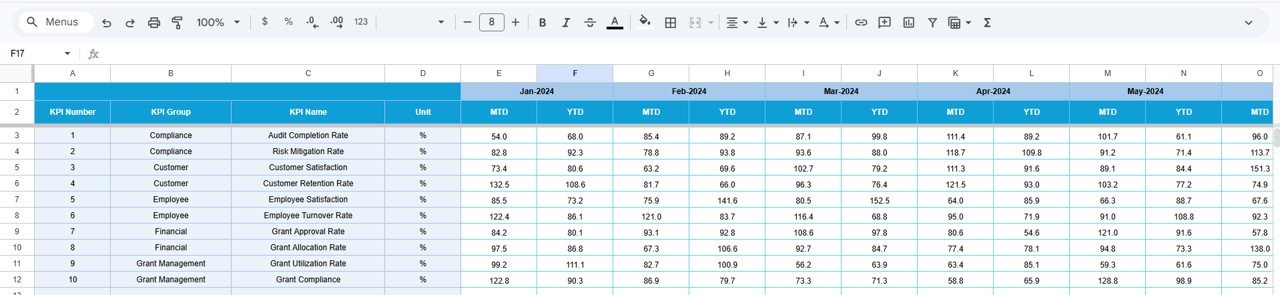
4. Target Number Input Sheet
In this sheet tab, you enter the Target numbers for each KPI for the particular month as MTD as well as YTD. Setting accurate targets is critical for grant compliance reporting and funder accountability.Grant Management KPI Dashboard in Google Sheets
Target Number Input sheet
5. Previous Year Number Sheet
Enter the numbers for the previous year same as you have entered for the current year. This enables year-over-year comparison on every KPI, giving grant managers the historical context funders expect in annual reports.
Previous Year Number Input sheet
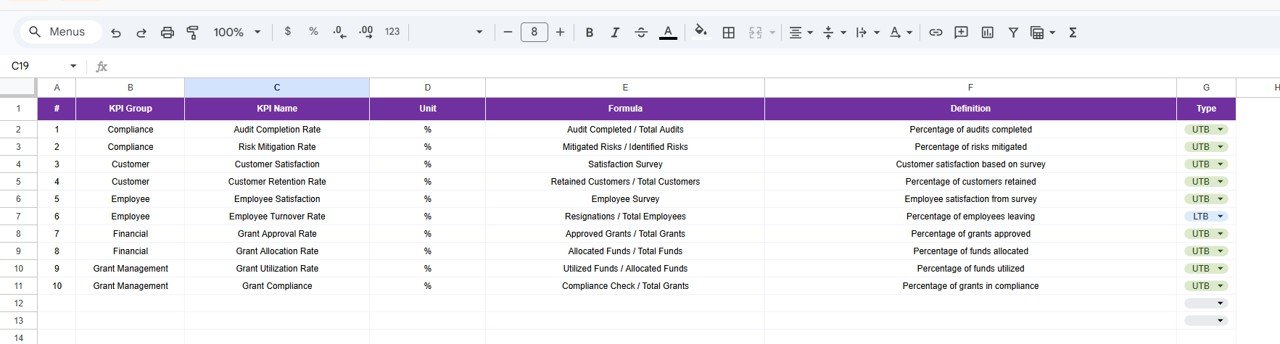
6. KPI Definition Sheet
In this sheet tab, you enter the KPI Name, KPI Group, Unit, Formula and KPI definition. In the last column enter the KPI type as LTB (Lower the Better) or UTB (Upper the Better). This central registry drives the KPI Trend sheet’s descriptive fields automatically.Grant Management KPI Dashboard in Google Sheets
KPI Definition sheet
Grant Management KPI Dashboard vs. Microsoft Excel Dashboard vs. Fluxx / Submittable — Feature Comparison
| Feature | Grant Management KPI Dashboard (Google Sheets) | Microsoft Excel Grant Dashboard | Fluxx / Submittable / SmartSimple |
|---|---|---|---|
| Cost | $8.99 one-time | $14.99–$17.99 one-time | $5,000–$50,000+/year |
| Platform | Google Sheets (free) | Microsoft Excel (license needed) | Cloud SaaS |
| Setup Time | Under 10 minutes | 10–15 minutes | 4–12 weeks onboarding |
| Real-Time Team Collaboration | ✅ Built-in | ❌ File sharing only | ✅ Yes |
| Mobile Access | ✅ Google Sheets app | Limited | ✅ Yes |
| Customizable KPIs | ✅ Add/modify any KPI | ✅ Modify formulas | Limited to built-in reports |
| Share with Link | ✅ One click | ❌ Email attachment | ✅ Dashboard sharing |
| Year-1 Cost (5 users) | $8.99 total | $14.99–$17.99 total | $5,000–$50,000+ |
| Prior Year Comparison | ✅ Built-in PY tracking | ✅ Manual setup | ✅ Automated |
For grant-funded teams that want KPI tracking without paying $5,000+/year for grant management SaaS, the Grant Management KPI Dashboard sits in the sweet spot.
Who Should Use This Template
Click here to Purchase the Grant Management KPI Dashboard in Google Sheets
Perfect for:
- Grant managers at nonprofits and NGOs (5–200 staff) tracking fund utilization, compliance, and disbursement KPIs monthly
- Program officers reporting grant performance to funders, boards, and government agencies each quarter
- Foundation staff monitoring grantee outcomes and comparing actual vs. targeted milestones across multiple awards.Grant Management KPI Dashboard in Google Sheets
- Freelance grant consultants delivering monthly performance scorecards to multiple nonprofit clients
Not a fit if:
- You need integrated applicant portals with automated grant lifecycle management (consider Fluxx or SmartSimple)
- Your organization requires SOC 2 compliance and audit-trail logs on grant data entry
- You need automated payment disbursement workflows tied to milestone approvals
Real-World Use Cases
Anika manages grants at a 40-person education nonprofit in Nairobi. She uses the Grant Management KPI Dashboard to track 12 grant KPIs including fund utilization rate, compliance score, beneficiary reach, and disbursement timing across 6 active grants. The MTD vs Target comparison lets her flag underperforming programs in weekly staff meetings — without paying $8,000/year for Fluxx analytics.
Carlos is a program officer at a community foundation in Denver. He tracks grant outcomes for 15 grantees using the KPI Trend sheet. The 12-month trend charts help him identify which organizations consistently meet milestones and which need capacity-building support — visual proof his board needs before approving renewals.
Priya consults for three small nonprofits as a freelance grant strategist in Mumbai. She duplicates the dashboard for each client, entering their specific KPIs and targets. The Previous Year comparison lets her show clients exactly where their grant performance has improved — without building custom reports from scratch each quarter.
Advantages of the Grant Management KPI Dashboard
- Zero formula building required — all calculations, conditional formatting, and trend charts are pre-built. Replace sample data and the dashboard works immediately.Grant Management KPI Dashboard in Google Sheets
- Real-time collaboration — Google Sheets lets your entire grants team view and edit simultaneously from any device, eliminating version control issues common with Excel files emailed between team members.Grant Management KPI Dashboard in Google Sheets
- $8.99 one-time vs. $5,000+/year — for small to mid-size nonprofits that need KPI tracking without enterprise grant management software, this template saves thousands annually.
- LTB/UTB logic built in — the KPI Definition sheet automatically determines whether a lower or higher value is better for each metric, so conditional formatting arrows always point the right direction.
- Funder-ready reporting — the MTD/YTD comparison format matches what most institutional funders expect in quarterly progress reports.
Opportunities for Improvement
Click here to Purchase the Grant Management KPI Dashboard in Google Sheets
- The dashboard does not include an applicant intake portal — you will need a separate system (or a Google Form) to collect grant applications.
- There is no automated data connection to accounting software. Actual numbers must be entered manually each month, which adds 10–15 minutes of data entry per reporting period.
- The template does not generate compliance documents or audit reports automatically — it tracks the KPIs that feed into those documents, but the final report assembly remains manual.
Best Practices
- Define KPIs before entering data — fill out the KPI Definition sheet first with clear names, formulas, and LTB/UTB types. This ensures the Dashboard and Trend sheets display correctly from the start.
- Update actual numbers on the same day each month — consistency in data entry timing makes trend analysis reliable and avoids partial-month comparisons.
- Share view-only links with funders — use Google Sheets sharing settings to give funders read-only access so they can check progress anytime without editing your data.
- Set the fiscal year start month on E1 — if your grant cycle starts in April or July, configure cell E1 on the Actual Numbers Input sheet to align all 12 columns with your fiscal calendar.
- Duplicate for each major grant — if you manage grants with very different KPI sets, create a separate copy for each grant rather than tracking all in one file.
Explore Relevant Templates
📊 Fundraising Campaign KPI Dashboard in Google Sheets — Tracks fundraising KPIs with the same MTD/YTD structure and conditional formatting.
📊 Charity Fundraising KPI Scorecard in Google Sheets — A traffic-light scorecard format for quick fundraising performance reviews.
📊 Nonprofit Organizations Report in Excel — Track 5 KPIs across donors, programs, and impact in Excel format.
🔗 Browse all Google Sheets KPI Dashboard Templates
Frequently Asked Questions
Click here to Purchase the Grant Management KPI Dashboard in Google Sheets
What KPIs does the Grant Management KPI Dashboard track?
The Grant Management KPI Dashboard tracks any grant metric you define — fund utilization rate, compliance scores, disbursement timelines, beneficiary outcomes, grant success rate, and more. You add your own KPIs in the KPI Definition sheet with full descriptions and formulas.
How long does setup take for this grant dashboard?
Setup takes under 10 minutes. Copy the Google Sheets file to your Drive, enter your KPI definitions, add target and actual numbers, and the Dashboard sheet displays all comparisons automatically with conditional formatting arrows.Grant Management KPI Dashboard in Google Sheets
Can I track both MTD and YTD grant performance?
Yes. Every KPI in the Grant Management KPI Dashboard shows both Month-to-Date and Year-to-Date numbers for Actual, Target, and Previous Year — with automatic variance calculations and directional arrows.
How does this compare to Fluxx or Submittable?
The Grant Management KPI Dashboard costs $8.99 one-time versus $5,000–$50,000+/year for Fluxx or Submittable. It covers KPI tracking and reporting but does not include applicant portals, automated workflows, or payment processing that enterprise grant platforms provide.
Can multiple team members edit this dashboard at the same time?
Yes. Google Sheets supports real-time collaboration — your entire grants team can view and edit the dashboard simultaneously from any device with a browser or the Google Sheets mobile app.
Does this template work on Mac and mobile devices?
Yes. The Grant Management KPI Dashboard runs entirely in Google Sheets, which works on Windows, Mac, Chromebook, iOS, and Android. No desktop software installation needed.
Can I customize the KPIs in this dashboard?
The KPI Definition sheet lets you add, remove, or modify any KPI. Enter the name, group, unit of measurement, formula, description, and whether the KPI is Lower the Better (LTB) or Upper the Better (UTB).
About the Author
Built by PK — Microsoft Certified Professional with 15+ years of Excel, Google Sheets, and Power BI experience. Founder of NextGenTemplates, reaching 300K+ subscribers across YouTube channels. Every template is hand-built and tested before release.
Conclusion
The Grant Management KPI Dashboard in Google Sheets gives nonprofit grant teams a structured, funder-ready KPI tracking system with 6 worksheets, MTD/YTD dual tracking, conditional formatting arrows, and 12-month trend charts — all for a one-time $8.99 payment.
Click here to Purchase the Grant Management KPI Dashboard in Google Sheets
✅ Instant download · One-time payment · No subscription
Visit our YouTube channel for step-by-step tutorials: Youtube.com/@NeoTechNavigators
For more Google Sheets templates and resources, visit Google Sheets Help Center.