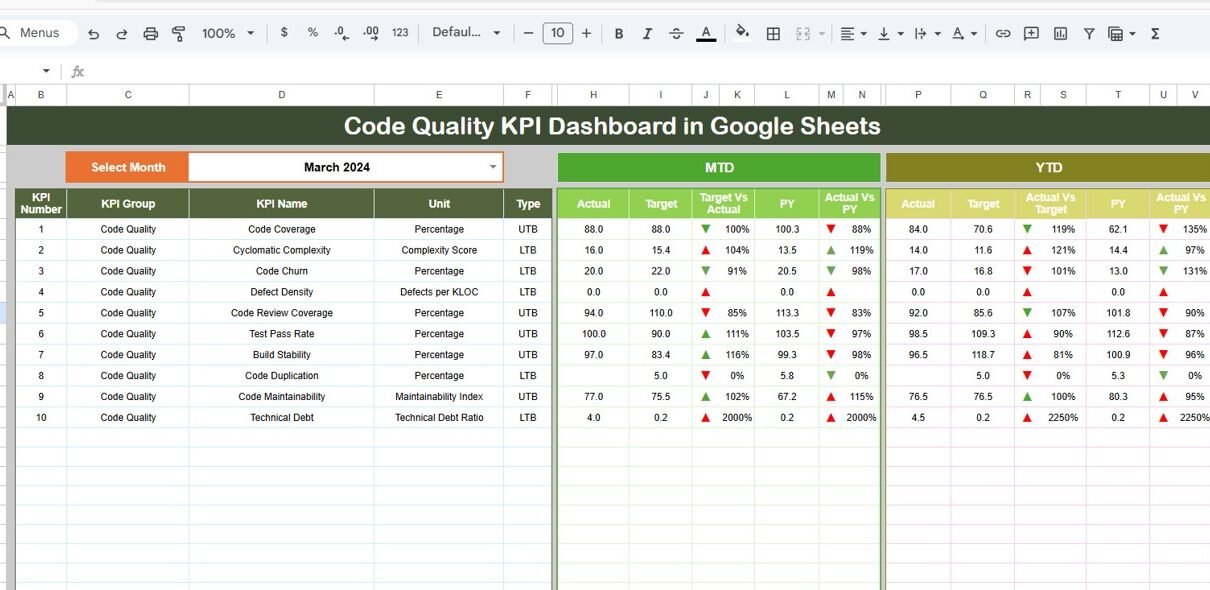
In today’s fast-moving software development world, maintaining high code quality is not optional—it is essential. Teams continuously write, test, and deploy code. However, without proper tracking, code quality can quickly decline. As a result, bugs increase, delivery slows down, and customer satisfaction drops.Code Quality KPI Dashboard in Google Sheets
So, how can you ensure consistent code quality while managing multiple KPIs?
This powerful and ready-to-use dashboard helps development teams monitor, analyze, and improve code quality using structured KPIs. Moreover, it provides real-time insights into performance trends, targets, and historical comparisons.
In this detailed guide, you will learn everything about this dashboard, including features, KPIs, advantages, best practices, and FAQs.Code Quality KPI Dashboard in Google Sheets
What is a Code Quality KPI Dashboard in Google Sheets?
A Code Quality KPI Dashboard in Google Sheets is an interactive reporting tool designed to track software development performance using key metrics.
Instead of relying on multiple tools or reports, you can centralize all your KPIs in one dashboard. Therefore, teams can:
- Monitor code quality trends
- Compare actual vs target performance
- Track monthly and yearly progress
- Identify improvement areas
- Make faster, data-driven decisions
Moreover, Google Sheets makes it easy to collaborate, update, and share data in real time.
Why Do You Need a Code Quality KPI Dashboard?
Click to Buy Code Quality KPI Dashboard in Google Sheets
Without proper tracking, teams struggle to maintain consistent quality. For example, developers may overlook bugs, delay fixes, or miss performance issues.
However, with this dashboard, you can:
- Improve software reliability
- Reduce bug rates
- Increase development speed
- Enhance team accountability
- Align performance with business goals
Therefore, it becomes an essential tool for every software team.
Key Features of the Code Quality KPI Dashboard in Google Sheets
This dashboard includes 6 structured worksheets, each designed to provide deep insights.
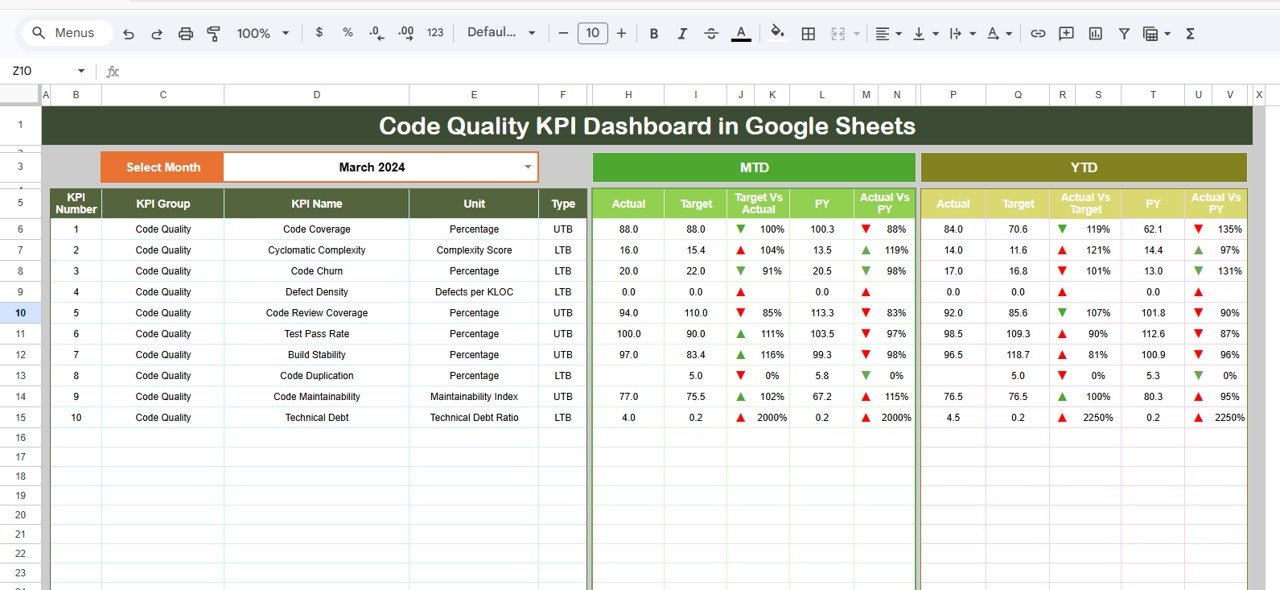
Dashboard Sheet – Central Overview
This is the main sheet where all KPI insights are displayed.
🔹 Key Highlights:
- Month selector (Cell D3) for dynamic analysis
- MTD (Month-to-Date) metrics
- YTD (Year-to-Date) metrics
- Target vs Actual comparison
- Previous Year vs Actual comparison
- Conditional formatting with up/down arrows
Click to Buy Code Quality KPI Dashboard in Google Sheets
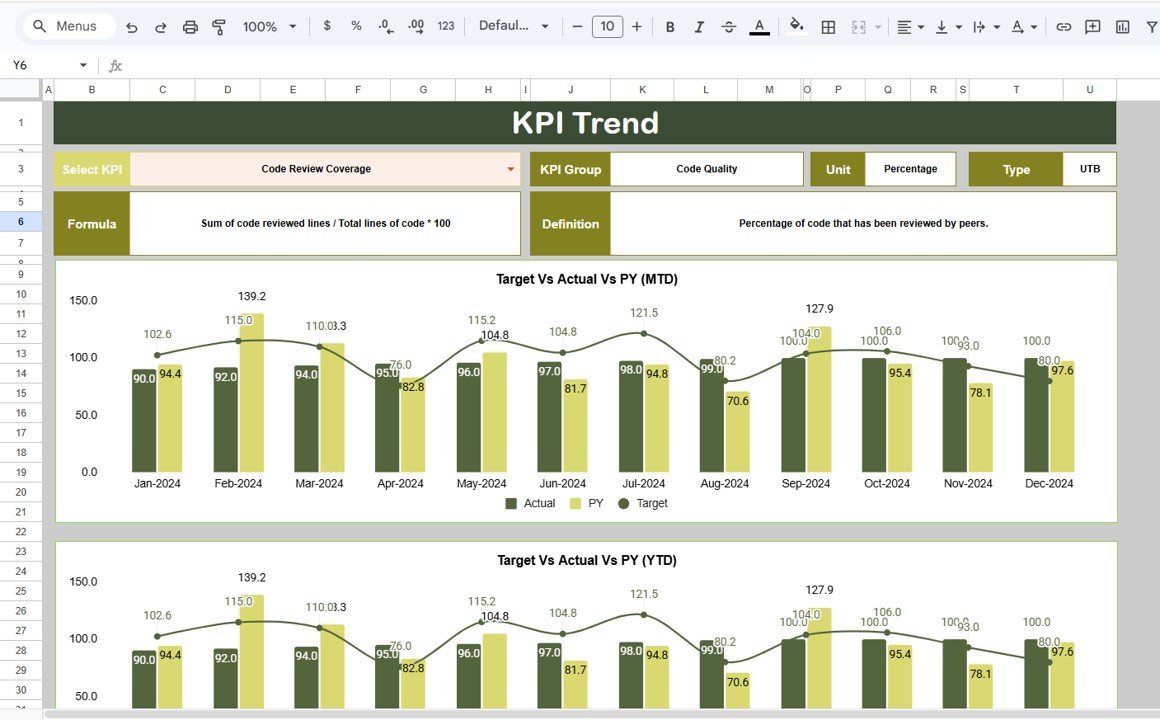
KPI Trend Sheet – Deep KPI Insights
This sheet allows detailed analysis of individual KPIs.
🔹 Features:
- KPI selection dropdown (Cell C3)
- KPI Group and Category
- KPI Unit (%, hours, count, etc.)
- KPI Type (Lower is Better / Higher is Better)
- KPI Formula
- KPI Definition
Click to Buy Code Quality KPI Dashboard in Google Sheets
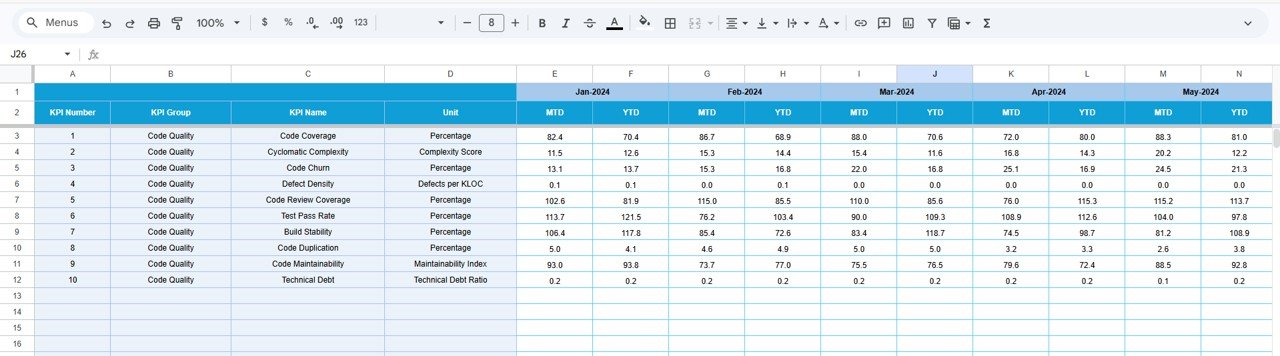
Actual Numbers Sheet – Data Entry Section
This sheet stores actual performance data.
🔹 Features:
-
Enter MTD and YTD values
-
Month selection (Cell E1)
-
Structured input format’

Target Sheet – Performance Goals
This sheet defines KPI targets.
🔹 Features:
-
Monthly targets (MTD & YTD)
-
KPI-wise target tracking
Click to Buy Code Quality KPI Dashboard in Google Sheets
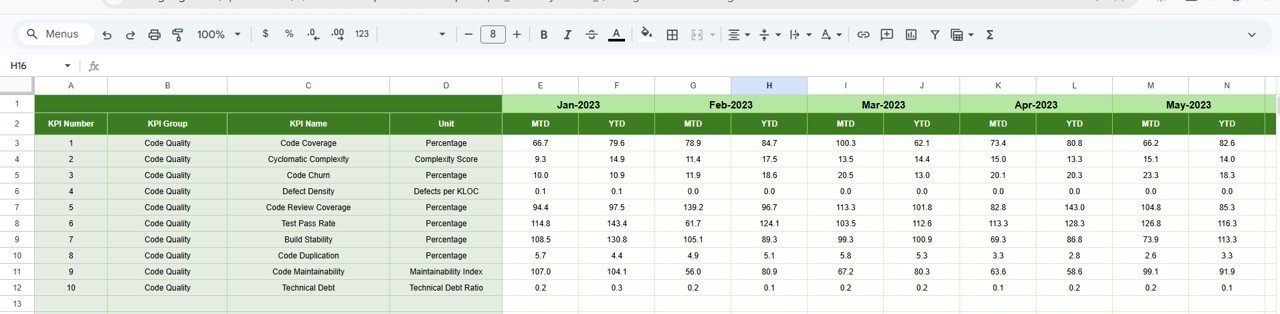
Previous Year Sheet – Historical Comparison
This sheet stores previous year data.
🔹 Features:
-
Year-over-year comparison
-
Historical performance tracking
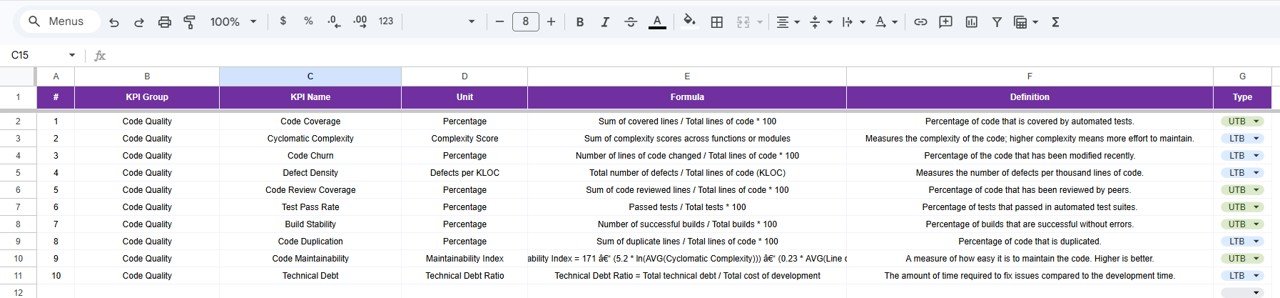
KPI Definition Sheet – KPI Master Data
This sheet acts as a reference table.
🔹 Includes:
- KPI Name
- KPI Group
- Unit
- Formula
- KPI Definition
Click to Buy Code Quality KPI Dashboard in Google Sheets
What Insights Can You Get from This Dashboard?
This dashboard helps answer critical questions:
- Which KPIs are improving or declining?
- Are we meeting our targets?
- How does current performance compare to last year?
- Which areas need immediate attention?
- Are development practices improving?
Advantages of Code Quality KPI Dashboard in Google Sheets
Improved Code Quality
Click to Buy Code Quality KPI Dashboard in Google Sheets
-
Helps reduce bugs
-
Ensures consistent standards
-
Improves testing practices
Better Decision-Making
-
Provides real-time insights
-
Enables data-driven actions
-
Reduces guesswork
Increased Team Accountability
-
Tracks individual and team performance
-
Encourages ownership
Easy Collaboration
-
Google Sheets allows real-time sharing
-
Teams can update data easily
Cost-Effective Solution
-
No expensive software required
-
Easy to implement
How Does This Dashboard Improve Development Performance?
Click to Buy Code Quality KPI Dashboard in Google Sheets
When teams track KPIs regularly:
-
They identify issues early
-
They fix bugs faster
-
They improve coding standards
-
They deliver projects on time
Therefore, overall productivity increases significantly.
Best Practices for the Code Quality KPI Dashboard
Keep KPIs Relevant
-
Focus on meaningful metrics
-
Avoid unnecessary KPIs
Update Data Regularly
-
Maintain accurate records
-
Ensure timely updates
Use Conditional Formatting
-
Highlight performance trends
-
Identify risks quickly
Set Realistic Targets
-
Align targets with business goals
-
Avoid unrealistic expectations
Review Trends Frequently
-
Analyze monthly and yearly data
-
Track improvements
Who Should Use This Dashboard?
- Software Developers
- QA Engineers
- Project Managers
- DevOps Teams
- CTOs and Tech Leads
How to Use the Dashboard Effectively?
- Enter actual data in the Actual Sheet
- Set targets in the Target Sheet
- Add historical data in the Previous Year Sheet
- Define KPIs in the KPI Definition Sheet
- Use dashboard filters for analysis
Conclusion
Click to Buy Code Quality KPI Dashboard in Google Sheets
The Code Quality KPI Dashboard in Google Sheets is a powerful tool for tracking and improving software performance.
It helps teams:
-
Monitor KPIs effectively
-
Improve code quality
-
Reduce defects
-
Deliver better software
Therefore, if you want to build high-quality software consistently, this dashboard is a must-have solution.
Visit our YouTube channel to learn step-by-step video tutorials